


 Arguments


Recent Comments
Prev 626 627 628 629 630 631 632 633 634 635 636 637 638 639 640 641 Next
Comments 31651 to 31700:
-
Trevor_S at 08:46 AM on 18 January 2015Global warming made 2014 a record hot year – in animated graphics
Thanks for all the replies but I think you suffer from the misguided thinking that data and science is what interests them :) It doesn't matter what Science is presented to them, they will keep denying.
As I have pointed out several times, it's not these people I am concerned about, they will deny in their grave. I was just answering the rhetroical question as to what deniers would use now. Just as an aside, none of them take this site seriously... sigh. If you want a reasonable synopsis of the nonsense they use, go to reddit
What concerns me is those that understand and accept the Science aren't doing anything. A recent example, the AGU conference, the LIMA comference, Dr Abrahams doing Aid work in Africa. All massive emitters. I know you think this is important work, which is the exact same reason everyone else gives and nothing is done. Everyone is waiting for everyone else, if you guys won't cut emissions, who will ? Causal Inefficeacy isn't a good reason. Yes, we have personally cut back enormously.
As to Dr Abrhams Aid work. I used to fly to Cambodia to do Aid work but now I rely on the support network in country and transfer funds electronically from here to fund the projects I support. So I can empathise with how hard it is not to be involved but the emissions are not justified. Once we've chewed away that emissions budget, there's no realistic way of going back.
-
Tom Curtis at 06:47 AM on 18 January 2015Global warming made 2014 a record hot year – in animated graphics
Trevor_S @7, a few things you may want to point out to your friends:
1) "Skeptics" are often dubios about surface temperature records because adjustments need to be made for time of observations (which has not been constant), change of site conditions, and change of instruments. Satellite temperature data, however, have come from a succession of 12 different satellites, requiring a site adjustment for the entire Earth at once for each transition. Further, the orbits of satellites decay over time, requiring a continous "site move" adjustments for the entire data set. Finally, satellites do not pass over a given point on the Earth at the same time each day (let alone punctually at the time of minimum and maximum temperatures), thereby requiring a continuous Time of Observation adjustment every day. (I have used the names for the equivalent surface adjustments rather than those used for the satellite adjustments.)
The fact that these adjustments need to be made for the entire record at the same time, rather than for individual instruments as with the surface record, means there are no nearby stations without the adjustments which allow comparisons to check for biases introduced by the adjustment. Consequently the story of the satellite record is a history of major errors corrected after some time in successive versions:
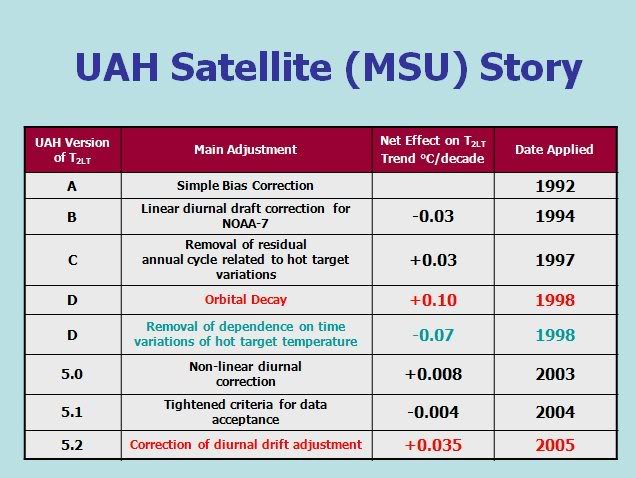
There is currently a peer reviewed paper pointing out a purported additional error that has not been publicly accepted by the authors of the UAH temperature set. They have, however, given notice that a new version is forthcoming which will make a significant difference.
2) The TLT record is not based on a single set of instruments but on the differences between two sets of instruments, meaning it compounds the errors of each seperate set of instruments. As Carl Mears (of RSS) says:
"TLT is constructed by calculating a weighted difference between MSU2 (or AMSU 5) measurements from near limb views and measurements from the same channels taken closer to nadir, as can be seen in Figure 1 for the case of MSU. This has the effect of extrapolating the MSU2 (or AMSU5) measurements lower in the troposphere, and removing most of the stratospheric influence. Because of the differences involves measurements made at different locations, and because of the large absolute values of the weights used, additional noise is added by this process, increasing the uncertainty in the final results."
(My emphasis)
UAH uses a different method, but the same problem applies.
3) As noted by Jim Eager, satellites do not measure surface temperature. In fact, they do not even measure the same portion of the atmosphere over different locations of the globe. RSS has provided the weighting functions for the TLT channel over land and water:

Thus, the altitude from 0 - 300 meters of the atmosphere provides around 4.5% of the signal over ocean, but only 4% over land. Of course, the amount provided over land depends on the altitude of the surface, so that the weightings over Denver, for example, would be different to the weightings over the qattara depression. The reason satellite records do not show temperatures over the Himalayas is not because the satellites won't clear the mountains, but because the difference in weighting is so great that it would make inclusion of the data nonsensical. Changes in surface pressure (the presence of highs or lows) will also change the weightings slightly.
The actual surface also contributes some of the signal (about 5% over land, and 3.8% over ocean), but that contribution also varies depending or surface type.
For what it is worth, about 50% of the signal comes from the first 3000 meters of the atmosphere (including the surface), and 50% from above. Because each altitude band above (approx) 2400 meters contributes less an less, that means the mean altitude of the temperature measurement in the TLT channel is close to, but above 3000 meters.
4) Actual attempts to measure the actual surface temperature using satellites have been made, with the current benchmark for accuraccy being +/- 1 K. For comparison, surface instruments read by eye have an accuracy of +/- 0.25 K for mercury thermometers, and 0.05 K for electronic thermometers. UAH can report greater accuraccy than that, but only by not actually reporting surface temperatures and not specifying too closely what part of the Earth/atmosphere system they are reporting the temperature of (as it varies by time, season, and geographical location).
-
Enginerd at 04:47 AM on 18 January 2015Global warming made 2014 a record hot year – in animated graphics
Trevor: In addition to what Jim pointed out, I recommend reminding your peers that UAH satellite data shows a long-term trend of +0.14 degrees per decade, which aligns pretty closely with the rate of temperature increase for the surface data sets.
I personally don't see the point of obsessing over which year has the highest temperature in which data set, because the ranking of specific years varies across them. We have known this for some time now. Much more important to me is that *all* reliable data sets show a steady temperature increase (behind a noisy year-to-year signal) and the rate of increase is indeed comparable across all of them.
-
Jim Eager at 01:38 AM on 18 January 2015Global warming made 2014 a record hot year – in animated graphics
Trevor, try pointing out to them that UAH (and RSS) does not measure surface temp. Not that it will make any difference to them, mind, but it may keep the conversation going a bit longer.
-
Trevor_S at 20:22 PM on 17 January 2015Global warming made 2014 a record hot year – in animated graphics
The deniers I know all just say the UHA Sat. data doesn't show it as the warmest year, the sateleite data is more accurate and the conversation ends their.
I don't actually know anyone amongst my peers or friends who aren't deniers.
-
dana1981 at 15:22 PM on 17 January 2015Global warming made 2014 a record hot year – in animated graphics
One Planet Only Forever @5 - the ones I listed are years that were records at the time, i.e. 1997 was the hottest year on record as of 1997.
-
One Planet Only Forever at 13:02 PM on 17 January 2015Global warming made 2014 a record hot year – in animated graphics
dana,
The following statement does not seem to be correct. Perhaps it was meant to indicate the years of strong El NIno influence.
"As this graphic shows (click here for an animated version), the last five record hot years of 2010, 2005, 1998, 1997, and 1995 were all assisted by El Niño events."
The order of warmest J-D year averages in the GISSTemp data set are: 2014; 2010; 2005; 2007; 1998; 2002 and 2013 (tied); 2003 and 2006 and 2009 (tied).
The order of warmest year averages in the NOAA data set are: 2014; 2010 and 2005 (tied); 1998; 2003 and 2013 (tied); 2002; 2006; 2007 and 2009 (tied).
Reviewing the NOAA ONI data set (here) shows that the significant El Nino events were: 2010-11; 2006-07 (weak); 2004-05; 2002-03; 1997-98; 1994-95.
Knowing that increased surface temperatures lag behind the ONI 0.5C El Nino anomoly date it can be seen that except for 2013 and 2014 the record years were El Nino influenced. It also indicates thta the 1994-95 El Nino event did not produce an annual average surface temeprature result high enough tobe among the top 10 years. In fact, 1995 was only the 16th warmest in the GISTEMP data, and 17th in the NOAA data set.
-
citizenschallenge at 10:50 AM on 17 January 2015Global warming made 2014 a record hot year – in animated graphics
Here's another animated graphic that does an excellent job of putting the temperature trend into perspective -
2014 On Pace for Hottest Year - Climate Central
-
Kevin C at 09:54 AM on 17 January 2015Uncertainty, sensitivity and policy: Kevin Cowtan's AGU presentation
This is a very brief outline. It's late and I'm tired, so apologies for the poor writing:
Why do we reconstruct temperatures over sea ice from land temperatures? There are four sources of evidence on which this decision was made:
- The physics.
- The models.
- The observations.
- The experts.
But first, one thing needs to be clear: rapid arctic warming is a winter phenomena. The central arctic can't warm in summer, because melting ice holds the temperature around zero. That's vital to understand the rest of this discussion - we are talking about something which happens in winter.
The physics
Global mean surface temperature is based on historical records, which limit how we can measure it. We can't use brightness temperatures because we don't have the data. We've got weather station data, so we use 2m air temperatures. But marine air temperatures are unreliable, so we use sea surface temperature as a proxy for air temperature over the oceans.
When it comes to understanding the physics of the problem, to a first approximation we can say that the sun heats the surface and the surface heats the air. If the surface is cool, it can cool the air too. That's true for land or ocean.
The big difference is that ocean surface is liquid, and surface mixing means that the effective surface heat capacity is much greater than for land. (Waves and spray improve heat exchange with the air too). As a result, temperature variation over land is much greater than over the oceans, whether it be diurnal or seasonal. Many of us experience this if we visit the coast - temperatures swings become smaller as you approach the sea.
What happens over sea ice? The air temperature is no longer coupled to the water temperature. Ice is a reasonable insulator, and snow on ice is very good (Kurtz et al 2011). So the thing which makes oceans different from land has gone away. Air temperatures over water behave differently from air temperatures over land. Air temperatures over sea ice, especially with a covering of snow, behave like air temperatures over land.
This different behaviour can be seen in the land and ocean temperature data. They show different amounts of variation over time, and they vary spatially over different distances. And if we use the land and ocean data to reconstruct temperatures in the isolated central arctic, we get very different results - mainly because of the different behaviour of the temperatures fields (but the distance to the nearest observation plays a role too).
The models
The reanalysis models incorporate the physics, including freezing/melting effects. And as we saw in my last post, the three modern models agree well with our reconstruction. Here's a month-by-month comparison to MERRA, comparing kriging reconstructions from the land and ocean data respectively. This is for the most isolated region of the central arctic, chosen to be most distant from any weather station, and so it's as hard as it gets. The SST based reconstruction doesn't show remotely enough variation, whereas the land data shows the right sort of variability, and fairly good agreement with the features even for the most isolated region of the Arctic.

Observations
In the paper we did a comparison over the same region with the international arctic buoy program (IABP) data of Rigor et al. In particular they produced a dataset by kriging combining land stations and temperatures measured on ice buoys in the central arctic. We showed a comparison with IABP in the paper. Rigor et al also examined kriging ranges by season, and found that while the distances over which temperatures were correlated in the summer were small, in winter they could be up to 1000km, including between land and ice stations.
In addition, the AVHRR satellite data also show rapid arctic warming comparable to reanalysis models. So there are two independent source of observational data showing similar behaviour over ice to us.
The experts
Because I was worried about this issue, I went to the 2013 EarthTemp meeting on temperatures in the Arctic. Which meant I could ask the experts about how air temperatures behave over sea ice. And they produced the same answer, for basically the theoretical reasons I outlined above.
Practical aspects
So what would happen if we were to reconstruct temperatures over the central arctic from sea surface temperatures instead of from air temperatures?
Winter sea ice extent hasn't changed as much as summer extent, which means that the limit of the winter sea ice hasn't moved very far. Sea surface temperatures at the edge of the sea ice are anchored at around freezing for the same reason as arctic temperatures in the summer. Further away from the ice other factors, such as tropic sea surface temperature and meridional heat transport also play a role. Even so, the variation in sea surface temperature in the northernmost sea cells in winter is small, and as a result a reconstruction from sea surface temperature will never show much change.
In other words, if we reconstruct air temperatures over sea ice from sea surface temperatures, we are imposing a constraint that the central arctic can not change in temperature, even in winter. But we're doing so with no physical basis - the freezing of water more than 1500km away doesn't constrain temperatures, any more than sea surface temperatures can do much to moderate temperature extremes 1500km inland.
-
Esop at 05:42 AM on 17 January 2015Global warming made 2014 a record hot year – in animated graphics
Record setting temp in an ENSO neutral year should send a rather clear message to the hordes of gullible MSM journalists that they have been duped by the deniers, but waiting for them to realize that is sort of like waiting for Godot.
Wonder what happened to the cooling that the ''skeptics'' (like Svensmark) promised us back in 2009 and even before that. Wasn't it something about cosmic rays, negative PDO, record low solar and other minor drivers?
I have asked the ''skeptics'' for years about what natural driver would be the cause when 2014 or 15 would break the record. ''Not gonna happen, it is cooling'', was the default response. However, don't be surprised when they come up with all kinds of excuses and how the record was ''expected'', though''. Sorta like when the BEST results came out.
Will the MSM buy those excuses and ''explanations''? Most likely.
-
Dawei at 04:43 AM on 17 January 2015Global warming made 2014 a record hot year – in animated graphics
Good article Dana. It would be interesting to see how 2014 measures to previous warm years with respect to other natural cycles, and to see how it stands in a reconstructed temperature record that removes all of the natural signals (I know I've seen that somewhere before...)
-
It's the sun
Postimage is quite usable, also free. Imgur is another option for image hosting.
-
TonyMo at 02:15 AM on 17 January 2015It's the sun
Ah, I see, nothing easy in this life! So next stupid question - where and how do I host my images to do this? Thanks' very much for you reply. T
Moderator Response:[RH] Try tinypic.com
-
Yvan Dutil at 02:15 AM on 17 January 2015Global warming made 2014 a record hot year – in animated graphics
I have used some of your graph for my blog. I think they are refered correctly, but if there is any issue let me know.
voir.ca/yvan-dutil/2015/01/16/une-pause-quelle-pause/
-
TonyMo at 01:32 AM on 17 January 2015It's the sun
Sorry to be so stupid, but can anyone tell me how to insert graphs or pictures int a comment? Many thanks T
Moderator Response:[RH] Look at the comments text box. On top there are three tabs. One says "insert." You click the image icon and paste in a link to the image. Note that your image has to be hosted somewhere. You can't paste in images from your computer. That's just a limitation to our current systems.
-
michael sweet at 21:03 PM on 16 January 2015Uncertainty, sensitivity and policy: Kevin Cowtan's AGU presentation
James Hansen has argued for decades that a satalite capable of measuring aerosols is desperately needed to measure the affect on climate sensitivity. Unfortunately, the mission with that capability was destroyed on launch a few years ago. Does anyone know the status of a replacement satalite?
Why does NASA put so much effort into Mars when holes in their data like this still exist?
-
Kevin C at 19:54 PM on 16 January 2015Uncertainty, sensitivity and policy: Kevin Cowtan's AGU presentation
The issue of how to handle air temperatures over sea ice was in fact the most difficult question we faced. However that's not because there's any uncertainty in the answer - theory, observations, models and expert opinion all point the same way - it's just because no-one has collected all the evidence in one place before. I probably ought to write it up as a paper. I'll try and write a summary in this thread later today, but it's going to be quite long.
But here's one little result I've got pre-prepared. Here's a comparison of CWv2 against ERA-i and MERRA for the region N of 70N:
There's quite a lot of agreement there. Note that the reanalyses show 1998 as even cooler than we do, which would increase the trend since 1998 further.
The only big difference is the period 2010-2012, which MERRA shows as rather cooler, although they come back into line for recent years. What could that be?
The most obvious difference between MERRA and the other two is that MERRA doesn't use land station temperatures - only pressures. So my first thought was to look for a land station homogenisation problem. However, the data argue against that:
1. The difference between MERRA and ERA is seasonal - it only occurs in winter. (In fact all the warming occurs in winter, because in summer melting anchors the temperatures around zero). Station homogenization problems tend to involve jumps, not seasonal differences.
2. The difference isn't localised over a weather station. In fact it's concentrated in the central arctic in a region whose shape matches the region which is most distant from any weather station.
Given that we've already seen that MERRA can show large spurious trends in Africa for regions isolated from the nearest SST or barometer (see our 3rd update), then the current working hypothesis is that MERRA is at fault here. I haven't looked at JMA, but Simmons and Poli (2014) suggests that it is closer to ERA-i. The ERA temperatures also make more sense in terms of the 2012 sea ice minimum than MERRA.
One other feature of interest: Arctic temperatures (and hence the Arctic contribution to coverage bias) have largely stablised since 2005. The big change is from 1997-2005. From this and from looking at similar behaviour in climate models, I do not think that we should assume continued rapid arctic warming, or an early disappearance of Arctic sea ice. My currect working hypothesis is that the models are right when it comes to an ice free Arctic.
-
mercpl at 18:48 PM on 16 January 2015The Antarctic ice sheet is a sleeping giant, beginning to stir
Correct FWL, in fact we already have an example of instantaneous effect of gravity changing sea-level in the daily tidal changes. So if the moon can change the sea level down at my local beach by a few metres in half-a-day, I expect that the GIS can do the same.
-
robert way at 16:37 PM on 16 January 2015Uncertainty, sensitivity and policy: Kevin Cowtan's AGU presentation
Nic Lewis,
I should also mention that Comiso and Hall (2014);s AVHRR satellite skin temperature data and our tests with AIRS satellite data (see our supplementary documents we have uploaded on our website) both support the results of CW2014. Your argument, pardon the pun, is on thin ice. -
robert way at 16:35 PM on 16 January 2015Uncertainty, sensitivity and policy: Kevin Cowtan's AGU presentation
Nic Lewis at 09:19 AM on 16 January, 2015
"3) As I've pointed out to Robert Way before, the difference between ... HadCRUT4 and the Cowtan & Way ... appears to be largely due the way temperatures over sea ice are treated rather than a lack of high latitude coverage in HadCRUT4 per se. The global temperature rise from 1860-79 to 1990-99 per HadCRUT4 (v2 or v3) is virtually identical to the BEST reconstruction with sea temperature used for infilling where there is sea ice. Using air temperatures for infilling where there is sea ice, as the other version of BEST and Cowtan & Way reconsruction do, produces a temperature rise about 6% greater"
Nic Lewis,
Running your code with CW2014 as opposed to HadCRUTv4.2 increases the TCR from 1.33 to 1.47 which corresponds to a ~10% increase in TCR using your method.
Secondly, and more importantly, a thorough read of Cowtan and Way (2014) would show that air temperatures over sea ice should be treated in the same manner as land and not SSTs. You are also welcome to read Dodd et al (2014) and Simmons and Poli (2014) which each find general agreement with the approach we employ. You might also recognize that drift stations on the ice were used in validation of the approach in Cowtan and Way (2014) and these have supported the sea ice treated as land approach. It makes physical sense to those of us who have spent a fair amount of time in the Arctic. This has all been previously pointed out to you. -
Tom Curtis at 10:49 AM on 16 January 2015Uncertainty, sensitivity and policy: Kevin Cowtan's AGU presentation
Nic Lewis @2, the definition of "Transient Climate Response" (TCR) is given by the IPCC as follows:
"The transient climate response (units: °C) is the change in the global
mean surface temperature, averaged over a 20-year period, centred at
the time of atmospheric carbon dioxide doubling, in a climate model
simulation in which CO2 increases at 1% yr–1. It is a measure of the
strength and rapidity of the surface temperature response to greenhouse
gas forcing."As CO2 has not increased by 1% per annum, is not the only forcing change, and we cannot measure ten years into the future to get the 20 year period, not empirical measurement is the TCR, and certainly not by definition. You may think you have defined the TCR as F2xΔT/ΔF (where F2x is the forcing for doubled CO2, ΔT is the change in temperature, and ΔF is the change in forcing). You have not. Rather you have taken the current temperature response to the change in forcing to be a convenient approximation to the TCR.
Given that your formula (2) from Otto et al (2013) is an estimator of TCR, not a definition, it is quite possible as a matter of empirical fact that it is a poor estimator, or that an estimator taking into account thermal inertia is superior.
Moderator Response:[Rob P] - inflammatory text deleted. Please stick to the science and dial the tone down. Thanks.
-
Nic Lewis at 09:19 AM on 16 January 2015Uncertainty, sensitivity and policy: Kevin Cowtan's AGU presentation
Two or three quick points.
1) The authors of Otto et al (who include myself as well as fourteen lead authors of parts of the IPCC AR5 WG1 relevant to TCR and ECS [equilibrium climate sensitivity] estimation) were not mistaken in ignoring the thermal inertia of the climate system when estimating TCR. TCR is defined on a basis which does not account for that thermal inertia. So the estimate in Figure 2(d) is on a different basis than that which corresponds to TCR, and is bound to overstate TCR. I imagine that the same mistake was made in the recent paper by Cawley et al. when estimating TCR using their Alternative minimal model.
2) Well done for highlighting that the hiatus is not of any real significance for estimates of TCR and ECS. Many clmate scientists fail to understand this point - e.g., see Rogelj et al. (2014). As you state, the greatest source of uncertainty is aerosol forcing (ERF).
3) As I've pointed out to Robert Way before, the difference between the amount of warming over the instrumental period shown by HadCRUT4 and the Cowtan & Way infilled reconstruction based thereon appears to be largely due the way temperatures over sea ice are treated rather than a lack of high latitude coverage in HadCRUT4 per se. The global temperature rise from 1860-79 to 1990-99 per HadCRUT4 (v2 or v3) is virtually identical to the BEST reconstruction with sea temperature used for infilling where there is sea ice. Using air temperatures for infilling where there is sea ice, as the other version of BEST and Cowtan & Way reconsruction do, produces a temperature rise about 6% greater.
-
Jim Eager at 08:20 AM on 16 January 20152015 SkS Weekly News Roundup #3A
Tom, I aimed that last line in general, not just at William. Sorry if that wasn't clear. Yet it was William who just came back to explain the obvious once again.
Moderator Response:[PS] Enough.
-
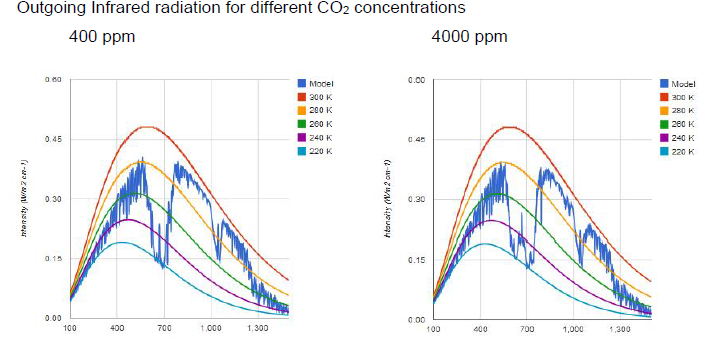
Glenn Tamblyn at 07:48 AM on 16 January 2015CO2 effect is saturated
Mike Hills
That spreading oof the CO2 'notch' due to the sides dropping can be seen in this image. I have used Modtran to show the OLR spectrum for 400 and 4000 ppm of CO2, everything else kept the same.
-
william11409 at 07:45 AM on 16 January 20152015 SkS Weekly News Roundup #3A
Tragically Jm Eager, there will be chldren born in 2015 who will die well before reaching their first year. The criterion given by Localis was "Perhaps deniers might like to predict when the first newborn who will live its life below that level might arrive". There is no time frame given other than "who will live its life". In view of that, 2015 correctly answers the question asked as the length of that life is not knowable. It is almost certain that somewhere a child born in 2015 has died in 2015. Not sure why answering the question accurately is viewed as trivial.
Tom Curtis has tightened the criteria considerably and has accurately answered his own question although as he too uses "lifetime" the length of which, as mentioned above is unknowable, 2017 seems a safer answer than 2016.
And to be critical of comments here to date, there seems to be an implicit assumption that "lifetime" is measured in years when in fact it may be measured only in months or days or hours or even minutes. Just look at the tragedies happening right now in Sierra Leone.
Moderator Response:[PS] If people have a substantive point to make, then please make it, but please no more hair-splitting over trivia. That applies to everyone.
[DB] William has opted to recuse himself from further participation here.
-
Tom Curtis at 07:40 AM on 16 January 20152015 SkS Weekly News Roundup #3A
Jim Eager @10, several of us played this trivial game, including Localis in picking what is afterall an arbitrary benchmark (400 ppmv) as significant. There is no need to pick on William alone.
-
FWL at 06:26 AM on 16 January 2015The Antarctic ice sheet is a sleeping giant, beginning to stir
Y'all are a bit confused about the gravitational and crustal rebound effects from ice sheet melt. When a land ice mass melts and drains into the ocean, the water is redistributed with the speed of gravity waves. For all intents and purposes, we can assume here this is pretty much instantaneous (takes a few weeks - there's some additional effects on ocean currents due to changes in the water's density field, but let's neglect that for now). But now the relative water level around the world's coastlines has not changed uniformly - how's that? That is because of SLA: self-attraction and loading. Self-attraction is about the gravity field: mass has spread from one concentrated place (the ice) over a much larger area (the global ocean). Since water aligns along equipotential surfaces to first order (let's neglect the dynamic sea surface height here ...), and the equipotential surface has just been changed, the relative sea level change is not uniform. So far so good. Now: it also turn's out 'rock-solid' is not so solid afterall, the Earth's crust and upper mantle are actually pretty elastic! Think of memory foam: when you press it down and take off the weight it quickly rebounds. That's the elastic part (elastic also means: instantaneous!). So the solid Earth rises where it was depressed by the ice, and (relative!) sea level there falls. But wait: memory foam also rebounds a while after the weight that depressed it is long gone! That's because it is also visco-elastic, just like the Earth's crust and mantle. This viscoelastic part is called glacial isostatic adjustment (GIA) and takes place for centuries and millenia even after an ice sheet has disappeard (this is why Fennoscandia is rising today even though all ice there disappeared some tenthousand years ago). The gravity part and elastic as well as viscoelsatic part are actually also coupled to each other a little bit, and thus it's pretty complex to solve this so-called 'sea-level-equation' with all feedbacks (like the rotational feedback) and elastic as well as visco-elastic processes taken into account.
-
Jim Eager at 06:01 AM on 16 January 20152015 SkS Weekly News Roundup #3A
William, only if that infant dies before CO2 reaches 400ppm for every day of the year.
Really, it is necessary to play such trivail games?
-
Tom Curtis at 06:00 AM on 16 January 20152015 SkS Weekly News Roundup #3A
CBDunkerson @7, I am fairly sure that Localis wanted to be parsed such that, shortly the first child of the cohort of which no child will experience CO2 levels below 400 ppmv will be born, where the cohort includes that child and all children born thereafter for (at least) several decades. Otherwise his challenge to "deniers" has been trivially answered by William. MA Rodger and I have merely pointed out that he has jumped the gun, and done so by treating Mauna Loa CO2 values as global values.
Being less trivially, shortly there will be born the first child during whose lifetime global seasonally adjusted CO2 levels will never be below 400 ppmv. Shortly after that (a year to two years from the first incidence) will be born the first child during whose lifetime global CO2 levels will never be below 400 ppmv. Based on the global data kept by NOAA, and the annual growth rate of around 2.4 ppmv, the first of these events will occur in the later half of this year (and the second in 2016 or 2017).
Clearly thus stated, the challenge as to when the first child will be born after 2015, and with seasonally adjusted globally averaged CO2 level to below 400 ppmv in their lifetime is not trivial. Perhaps William would like to have a shot at it (without any suggestion he is a "denier")?
-
william11409 at 05:08 AM on 16 January 20152015 SkS Weekly News Roundup #3A
Localis asks deniers to state when the first child to live its life below that level (400ppm CO2). It seems fairly safe to say, based on the comments here it will be in 2015 and possibly in Tasmania. But does giving that answer, ipso facto make any one who gives it a denier? Doubtful I think
Moderator Response:[JH] Snarky comments like the above are not welcome on this website.
-
CBDunkerson at 04:00 AM on 16 January 20152015 SkS Weekly News Roundup #3A
No. Look again.
Yes, there are people in Antarctica and Tasmania and other places where the atmospheric CO2 level is not over 400 ppm. Therefore, there are still humans being born who will experience sub 400 ppm levels. All true... and irrelevant.
Localis didn't say that all children would soon experience this. Only that the first would do so. Are there places on the planet with atmospheric CO2 over 400 ppm? Yes. Have babies been born in any of those places? Yes. Have some of those babies subsequently died without first experiencing less than 400 ppm CO2 levels? Almost certainly yes. Ergo, "the first child ... who will never experience a CO2 level below 400ppm during its lifetime" has either already been born or soon will be. No gun jumping involved... you're just applying a different standard (all children) than was actually stated (first child).
-
wili at 01:51 AM on 16 January 2015Uncertainty, sensitivity and policy: Kevin Cowtan's AGU presentation
"The public discourse does not reflect the science, rather it has been determined by the misinformation context. Some of this has crept back into the scientific discourse as well."
It's that last bit that is particularly worrisome to me, particularly since that then feeds back into the denialosphere and they can and do say, "See, the scientists admitted that there's a 'pause'!" whenever anyone uses this terminology.
Very interesting point about 19th century bucket sampling. It seems to me that I have read some discussion of this issue, but I can't remember where, now.
-
Tom Curtis at 01:33 AM on 16 January 2015The Antarctic ice sheet is a sleeping giant, beginning to stir
sgbotsford @8, not only can the water slosh around, but it can also be drawn to the equator by centripetal forces. Coupled with the loss of mass at Greenland itself, that means the water is not sloshing around the Greenland coast and there is a large loss of local mass resulting in even more sea water been drawn away. Further, Greenland will start rising as it seeks neutral bouyancy the magma, resulting in the ocean floor near Greenland also rising with a consequent reduction of sea level relative to the coast. Finally, the loss of all that mass in one location will sligthly alter the axial tilt of the Earth, resulting in further changes in depth around the globe. The overall result for a 1 meter sea level from melting of the Greenland Ice Sheet would be something like this:

Of course, the West Antarctic Ice Sheet will also be melting, causing something like this:

Obviously the two effects will partially cancel in some areas, and reinforce in others. The net effect should be similar to the observed rate of sea level change due to ice melt:

To that must be added the sea level rise due to thermal expansion, which will also vary by region.
-
Tom Curtis at 00:37 AM on 16 January 20152015 SkS Weekly News Roundup #3A
CBDunkerson @4, I refer you to Cape Grim, Tasmania where at last report the CO2 level was 396 ppmv, will not rise above 400 ppmv till late this year at the earliest, and likely not till 2016. Plenty of people born in Tasmania. Indeed, based on the NOAA CO2 Movie (up to date to January 2014, but it is the latitudinal pattern that is important), even at Brisbane 400 ppmv will not be reliably exceeded till next year.
Localis has jumped the gun, slightly. When the South Pole hits 400 ppmv, however, a post along his lines would be in order.
-
Jim Eager at 00:34 AM on 16 January 2015The Antarctic ice sheet is a sleeping giant, beginning to stir
"Wait a minute: The gravitatational attraction of the ice is NOT going to be a big effect. As the ice melts it still has the same mass. It's just now in a form that it can slosh around."
The above statement sounds confused. Currently the Greenland ice sheet exerts gravitational attraction that makes local sea level surrounding Greenland higher than it would otherwise be. With part or all of that ice gone, along with its gravitational attraction, local sea level would fall, offsetting some or all of the global rise due to the mass of the Greenland ice being distributed in the ocean. It's not that there would be a new gravitational attraction, but rather an existing local attraction would disappear. The gravitational attraction of continental land masses will remain, however, and since there is more land mass in the northern hemisphere, sea level rise will be greater in the northern hemisphere than in the southern h.
-
sgbotsford at 00:02 AM on 16 January 2015The Antarctic ice sheet is a sleeping giant, beginning to stir
What we also discuss is that sea-level rise will not be uniform. Antarctica (and Greenland) are currently losing gigatons of ice each year. That ice is heavy, and we know from first-year physics courses that mass (particularly heavy items) expresses a gravitational attraction. So, all that ice sitting atop Antarctica is pulling ocean waters toward it.
As the ice melts, the gravitational force will lessen, and the waters will “slosh” away from Antarctica. In our paper, we report that sea level rise in the Northern Hemisphere will be greater than the world-wide average whereas sea levels in the region next to Antarctica may actually fall. This means that infrastructure planning on the east and west coasts of North America as well as in Europe must be prepared for a greater than average sea-level rise.
Wait a minute: The gravitatational attraction of the ice is NOT going to be a big effect. As the ice melts it still has the same mass. It's just now in a form that it can slosh around.
If the WAIS slide off into the ocean next Tuesday (doesn't need to melt, just float) and there is enough volume to raise the ocean level by 1-3 meters, that rise will be world wide. There won't be any 6 meters in the Antarctic ocean, and half a meter in Oslo.
That said: Surface waves travel at a few miles per hour. I would (naively, perhaps) expect water level changes to spread at similar speeds. If it spreads at 1.5 miles an hour, then it would take roughly a year to spread to the north pole. I suspect this is an underestimate.
Re: Gravitational rebound. If the reference is to tectonic plates rising after the ice load is removed, this happens on a MUCH slower time scale. Hudson Bay is still rising after the loss of ice 9000 years ago.
-
MA Rodger at 23:43 PM on 15 January 20152015 SkS Weekly News Roundup #3A
CBDunkerson @4.
Since 1978, there has now been 10 children born in Antarctica according to Wiki.
-
CBDunkerson at 22:41 PM on 15 January 20152015 SkS Weekly News Roundup #3A
MA Rodger, last I checked there aren't a lot of babies born in Antarctica. :]
Thus, I think localis's statement is fairly safe. Sure, there will be parts of the planet which are still below 400 ppm, but chances are that there will be plenty of kids who never visit any of those places. Heck, when we consider the unfortunate reality of infant mortality, it's virtually certain that the first kid who will never breathe air with less than 400 ppm CO2 has already been born. As you note, we're still a handful of years away from every kid being in that situation, but the first has already come and gone.
-
MA Rodger at 22:18 PM on 15 January 20152015 SkS Weekly News Roundup #3A
localis @2.
Shortly? Down in Antarctica CO2 it will take possibly four years to reach 400ppm. As of December 2013 readings were 393.9ppm. There isn't much of a seasonal cycle down there like in the Nothern hemisphere. At MLO the last readings below 400ppm will almost certainly be in the Autumn of 2016 with just an outside chance that no 2016 monthly averages drop back below 400ppm. Globally averaged CO2 runs about a year behind MLO.
-
localis at 20:09 PM on 15 January 20152015 SkS Weekly News Roundup #3A
It seems that the first child will be born shortly who will never experience a C02 level below 400ppm during its lifetime. Perhaps deniers might like to predict when the first newborn who will live its life below that level might arrive.
-
The Antarctic ice sheet is a sleeping giant, beginning to stir
This link from Univ Colorado shows how variable the SLR is at the regional level. Higher than average increases are east of Japan and the Philipines and north of Australia whereas much of the US seems to be lower than average. As the site says -"Please note that these trends have been determined for a finite period (1993 - present), and reflect the impact of decadal scale climate variability on the regional distribution of sea level rise."
sealevel.colorado.edu/content/map-sea-level-trends
I'm guessing this variability is not our friend as most areas will get more than their share of SLR at some time as the decadal climate varies one way and then the other.
-
Tom Curtis at 13:10 PM on 15 January 2015CO2 lags temperature
 :
:And here is the CO2 reconstruction we should be using:

The immediate thing to notice is that the CO2 rises by 20 ppmv from 260 ppmv, leading to an expected temperature increase of 0.3 C. Instead we get a temperature decrease of about the same amount. Why?
Well, here is the temperatures over the last 800,000 years:

You will notice that after each large peak, the temperatures plummet rapidly, as we would expect with the rapidly declining NH summer insolation (which drives the timing of glacials). There is one exception, that doesn't fall rapidly, that that is the last 10 thousand years.
It is a natural supposition that the rise in CO2 levels (itself something we would not expect naturally) has counteracted the natural fall in temperatures we would expect from the declining NH summer insolation and greatly reduced the natural decline in temperatures.
-
chriskoz at 13:08 PM on 15 January 2015The Antarctic ice sheet is a sleeping giant, beginning to stir
michael sweet,
Your question about gravitational rebound (+centrifugal forces of Earth rotation) on regional SLR from Greenland IS was answered by Jerry Mitrovica here. In the embeded video, from 16:00 on, Jerry explains the results of his simulation of 1m SLRe instantanous GIS melt.
As you can see on the picture, SL would fall (effect negative) in Scotland, Scandinavia and Labrador while SL would be up to 1.2m (120%) around SAtlantic (SAmerica) and Equatorial-Northern Pacific.
In US (your particular interest) the effect ranges widely on E coast (from ~50% in NY to some 80% in Miami. On the W coast the effect seems to be uniform 100%.
-
scaddenp at 12:45 PM on 15 January 2015CO2 lags temperature
Well anything from climate4you is likely.misinformation. This is discussed here and here.
You might like to put "humlum" into the search box to see other stuff.
-
dvaytw at 12:38 PM on 15 January 2015Examining Dr. John Christy's Global Warming Skepticism
Thanks for understanding my mangled sentence there, guys. Glad to have the jump on the talking point for a change.
-
dvaytw at 12:30 PM on 15 January 2015CO2 lags temperature
This one is isn't specifically related to "lags temperature", but it's another "CO2 / temperature - no correlation" graph, ostensibly from Doctor Richard Alley, showing the past 11,000 years from Greenhouse ice core data.
My knowledge-free guess" effects from the sun are in the driver's seat here... am I somewhat right on that? The "discussion" as it were is happening here:
How to Talk to a Climate Change Denier
Moderator Response:[RH] shortened link.
-
Jim Eager at 11:49 AM on 15 January 2015Climate Deniers Employ Predatory Tactics in Fight Against Facts: Scientist
William, this is way past petty and tiresome. Just suck it up and stay on topic.
-
Mike Hillis at 10:11 AM on 15 January 2015CO2 effect is saturated
I think what Digby fails to realize is that the radiation along the side wings of the CO2 band do come from the troposphere, yet are radiated and/or absorbed by CO2. If you study Toms graph in post 376, you see that along the sides of the CO2 band, around 650/cm and on the other side at around 750/cm., the radiation matches up with 240 K or even 250 K, which correspond with temperatures in the troposphere. Adding CO2 to the atmosphere would push those jagged edges downward on the graph and closer to 220K, which is colder.
Digby is partially correct by saying the bulk of the CO2 band radiates from 220 K which is the lower stratosphere, which does not get colder with altitude, and he is also corect that the bulk of the radiation from the troposhere is well outside the region of the spectrum which is affected by CO2, but he fails to note that the wings of the CO2 band would be pushed slightly downward on the graph, and into colder regions on the graph (because, in the real world outside the graph, radiation of those 650 and 750 wave numbers would have to travel higher up in the atmosphere to get around all the extra CO2 molecules).
-
Tom Curtis at 09:08 AM on 15 January 2015Climate Deniers Employ Predatory Tactics in Fight Against Facts: Scientist
Rob Honeycutt @46, for a very long time before I seriously studied at university, I took "sic" from context to mean roughly "look how superior I am". I think in most usage it still has that implication. In fact, with the exception of pointing out original typos, which as you point out is neither necessary nor desirable, "sic" is entirely redundant for any word within quotation marks - unless, of course, the quoter is pointing out that they are in the habit of misquotation, but this time restrained themselves.
-
Rob Honeycutt at 08:57 AM on 15 January 2015Climate Deniers Employ Predatory Tactics in Fight Against Facts: Scientist
William... One quick nuance of written style that you may not be aware of: The use of "(sic)" normally is not used to correct typos. It's used where confusion might come into play for the reader. It's to indicate that it is reproduced as written. Simple typos (according to the AP style guide, if I remember correctly) can be merely corrected without reference or indication. In fact, it's considered polite to do so.
Prev 626 627 628 629 630 631 632 633 634 635 636 637 638 639 640 641 Next


