


 Arguments


Recent Comments
Prev 638 639 640 641 642 643 644 645 646 647 648 649 650 651 652 653 Next
Comments 32251 to 32300:
-
Common Sense > Brain Washed at 19:05 PM on 18 December 2014Human CO2 is a tiny % of CO2 emissions
This landed in my mailbox a day or so ago. It comes from a gentleman whose speciality is Heliophysics. In addition to what he has to say here, I'd like to add that, the best I can tell, about .006, just over 1/2 of 1% of the atmosphere is made of CO2. And of that, depending on who you believe, the manmade portion of that amount is only 2%-7%. Either way, we're talking about an infinitesimal figure. Using the 7%, that still only comes to .000042 of the atmosphere is affected by manmade CO2 emmissions.
Color me stupid, but I just have a hard time believing that has any impact whatsoever.
Now, I do not claim in any way whatsoever to be a scientist. Those numbers are what I grabbed from a few of what I consider to be reliable internet sources. Please, if you have evidence to prove me wrong, by all means, do so. I'm open minded about science, and willing to listen to anyone who can provide substantive information. I think the main thing, which I've found from many sources, as the guy I'm quoting below points out, is that CO2 levels FOLLOW rising temps, not vice versa. Like I say, I just study as much as I can on something which interests me and try to make a sound conclusion based on what I find. And I am in no way offended by conflicting information. We'll just have to look deeper into the backgrounds of the sources to see if they have anything to gain or lose one way or the other.
"Currently the consensus is that 15% of global climate change is due to the sun. I think that this might be a bit low. for the last 10 years GISS [I assume he's referring to the Goddard Institute for Space Studies at Columbia University] has seen a decreasing, trend of global temperature. I would caution that the decrease is consistent with no change. CO2 continues to increase. Further the glacial record shows that increases in CO2 levels lag global temperature increase."Moderator Response:[JH] On this site, it's considered to be in poor taste to include more than one denier myth in a single comment. It's also in poor taste to try to disguise where you are coming from by quoting someone else.
Please note that posting comments here at SkS is a privilege, not a right. This privilege can be rescinded if the posting individual treats adherence to the Comments Policy as optional, rather than the mandatory condition of participating in this online forum.
Please take the time to review the policy and ensure future comments are in full compliance with it. Thanks for your understanding and compliance in this matter.
-
Rob Honeycutt at 15:04 PM on 18 December 20142014 will be the hottest year on record
devobrun... Dr. Abraham is at the AGU conference in SF now, right after returning from Africa where he's been doing humanitarian work. You might be waiting a while for a response.
-
devobrun at 14:35 PM on 18 December 20142014 will be the hottest year on record
Thank you Tom, but I would like John to address the statement that 0.024 degrees is a "big margin in terms of global temperatures".
Assuming that your data is correct, Tom......what is John's reasoning for his statement?
-
One Planet Only Forever at 14:31 PM on 18 December 20142014 will be the hottest year on record
John,
I refreshed my NOAA ONI webpage and see that it already shows the most recent 3-month average SON 2014 to be 0.5 C. So the El Nino ONI condition has initially reappeared for the first time since the two consecutive values in 2012 (0.5C in ASO and 0.6C in SON).
-
One Planet Only Forever at 14:18 PM on 18 December 20142014 will be the hottest year on record
John,
Some minor clarification of the references to the potential El Nino may be in order.
The NOAA ONI records that are used to evaluate El Nino/La Nina (see here), do indeed Red Highlight sets of 5 or more consecutive 3 month averages being 0.5 C above the baseline 30 year average. They are noteable warm events. Until the 5 consecutive values have occured there is no highlighting. So what is imminent is the first value of 0.5 C or warmer. That is indeed the threshhold for an El Nino, but to be on the record as an El Nino there will need to be 4 more consecutive 0.5 C or warmer values.
The earlier reference in the article to El NIno is consistent with the above, but the later comment
"Interestingly, we are currently close to an El Niño, and if current patterns continue for a few weeks, an official El Niño will be announced."
should be clarified to be the start of the potential 5 consecutive values that would constitute a significant warm ONI event or noteable El Nino event.
-
Tom Curtis at 13:23 PM on 18 December 20142014 will be the hottest year on record
RH, thanks!
-
Tom Curtis at 11:36 AM on 18 December 20142014 will be the hottest year on record
I apologize for the blank space above the table in my prior post. I have no idea why it is there, or how to fix it as it does not show in the html code.
Moderator Response:[RH] All fixed! :-)
-
Tom Curtis at 11:30 AM on 18 December 20142014 will be the hottest year on record
devobrun @5, NOAA lists the error margin for their global temperature series as being 0.1 C, so I do not think Abraham's claim is justified.
Interestingly, poking around with the data I find that 9 other years are statistical ties with Abraham's projected temperature. They are blolded in the list below. You will also notice from taht list that 16 of the last 17 years (including 2014) are ranked in the top 17 hottest years out of 135, and all are in the top 20.

NOAA temperatures since 1998. 2014 temperature projected. Bolded values are a "statistical tie with the projected value for 2014. Rankings are for the full 135 year record.
Moderator Response:[RH] Converted html to image.
-
devobrun at 10:15 AM on 18 December 20142014 will be the hottest year on record
"I predict the annual temperature anomaly will be 0.674°C. This beats the prior record by 0.024°C. That is a big margin in terms of global temperatures."
Have you got the standard deviation associated with each mean? That might back up your last statement.
-
jimlj at 09:08 AM on 18 December 20142014 will be the hottest year on record
Michael sweet, that's easy. The first year that the temperature is less than the latest record will be the start of a 'return to normal' or 'end of warming' or whatever their current catch-phrase will be.
Just look at the artic. After a record-breaking 2007 in 2008 they started talking about the 'recovery' ditto 2013 after the record 2012 mel5. There's nothing too ridiculous for them to use to downplay global warming.
-
michael sweet at 08:06 AM on 18 December 20142014 will be the hottest year on record
John,
Excellent post. Would it be possible for you to update your daily average once or twice more before the official records are released for the year (perhaps on this thread)?
As I understand it, the strongest effect of El Nino on global temperatures is about 6 months after the El Nino starts. That will be a couple of months from now. If that holds for this El Nino, next year will also be a new, hotter, record. How long will we have to go to get a negative slope for the escalator graph after two record years in a row?
-
cosmicomics at 04:56 AM on 18 December 20142014 will be the hottest year on record
“These climate science deniers have had a bad year.”
Not really. They would have if their arguments were based on reality, but they aren't. They're based on ideological expediency.
-
PhilippeChantreau at 02:21 AM on 18 December 2014Hansen's 1988 prediction was wrong
The moderation policy at SkS and the overall tone is far better than most other internet forums on the subject. I have read through this thread and I could not find an ad hominem argument against you TallDave. Can you quote or link the specific post that contained that particular logical fallacy?
Moderator Response:[JH] Phillipe, TallDave's most recent post constituted argumentative sloganeering and was therefore deleted. He/she seems bent on relinquishing his/her privelege of posting on SkS.
-
John Hartz at 01:21 AM on 18 December 2014Hansen's 1988 prediction was wrong
CBDunkerson: You may find the answer to your question in:
The 7 psychological reasons that are stopping us from acting on climate change by Chris Mooney, The Wonkblog, The Washington Post, Dec 11, 2014
-
CBDunkerson at 23:00 PM on 17 December 2014Hansen's 1988 prediction was wrong
This is a bit off topic, but TallDave's assault on 'cutting edge 1980s science' helps illuminate a pattern I've seen before. Essentially, there seems to be a mindset amongst many deniers which reasons that belief in scientific principles derives from faith in individuals... so the goal becomes an effort to discredit individuals they see as the 'preachers' (?) of science rather than the actual facts.
For example, even if Hansen got some things wrong in the 80s (and he did, ironically just not the things TallDave is harping on) that would do nothing to invalidate modern global warming science. Over the past 30 years we've accumulated vastly more confirmation than Hansen had in the 80s... yet the mindset remains that if you can bring down someone viewed as the 'original actor' then all the facts just go away.
We saw the same thing with Beck's assault on Callendar's atmospheric CO2 level analysis... decades after Callendar had died and Keeling had proven him correct. Ditto the endless assaults on Michael Mann despite dozens of subsequent studies having confirmed the findings of the 'hockey stick'. Similarly, whenever I've discussed evolution with creationists they have been endlessly fixated on supposed errors by/flaws of Darwin... as if there hadn't been two hundred years of additional confirmation since then.
I don't know what this pattern of fixation on individuals / 'originators' means, but it shows up reliably enough that I suspect there must be some underlying reason. Does any of the 'psychology of denial' type research shed any light?
-
michael sweet at 21:06 PM on 17 December 2014Hansen's 1988 prediction was wrong
Talldave would have us accept Lindzen's model that the temperature would stay the same, rather than Hansen's model that temperature would rise. He ignores that record high temperatures have been set every five years since 1988, including 2014. 2014 will be the highest ever recorded and the hottest the Earth has been in thousands of years.
Talldave wants to wish away the temperature data and claim that the temperature is not rising. If Hansen cannot predict in advance when people would reduce pollution than the temperatures canot be rising.
-
JanLundberg at 20:40 PM on 17 December 2014Even climate change experts and activists might be in denial
Mostly on target. But attachment to this position can become a black & white approach. After all, can't I save the world with some green app for cool shopping?! Rilly now, we gotta differentiate who should go to a climate conference and who's a waster. And, defensively I say, sail transport — even with auxiliary engines possible for a while longer — may be technically a "splitting" but is also essential for preparing for the fuckin' -(snip)- future. See http://www.SailTransportNetwork.org
Moderator Response:[RH] Watch the tone, please.
-
Stephen Baines at 16:32 PM on 17 December 2014Hansen's 1988 prediction was wrong
"Concentrations are not emissions. If Hansen's explicitly described emissions scenarios didn't result in the concentrations he expected them to, that's a failure of his model. Pretending otherwise is the just the kind of three card monte that is causing the public to justifiably lose faith in climate science as an objective enterprise." (my emphasis)
And "scenarios" are not "models," as has been described ad nauseum. This is the kind of double speak that makes people use the word phrase "climate denier" instead of "climate skeptic."
People run scenarios all the time, with finances, with their shopping, with personal life choices. They choose among scenarios using "models" that can allow them to determine which scenario produces the most favorable or viable outcome.
If I choose to save more money and my bank account increases as a result, it does not invalidate the same accounting model that has me go broke if I spent way above my income. The scenario (what I chose to do with my money) is different from the accounting model that turns that choice into a result. The same is true of Hansens study — he tried to capture a range of possible scenarios so people could understand the consequences of different actions.
-
Composer99 at 15:38 PM on 17 December 2014Hansen's 1988 prediction was wrong
TallDave:
It is incumbent upon you to translate the EPA emissions data (shown as Tg of CO2 emitted over time) into radiative forcing over time. Otherwise, you have no ground on which to claim that the EPA data supports you.
When even the work of a self-styled "climate skeptic" refutes your claim, IMO you should probably look at your own position for error instead of repeating it ad nauseum without any modification - a behaviour which, by the way, is prohibited by the Skeptical Science comments policy.
I might add that characterising the work of tens of thousands of researchers across the world as a common con game is, at best, dancing on the line of an enormous accusation of deception.
The fact of the matter is that climate science is based first and foremost on rather basic thermodynamics (net radiative energy in vs. net radiative energy out), the radiative properties of the greenhouse gases, and the thermal properties of the atmosphere and ocean. Speaking bluntly, you're setting yourself up for a hopeless task if you think that your attempt at refuting Hansen's 1988 work will unravel the physics establishing the reality of global warming.
Also speaking bluntly, arguing against climate science in 2014 by reference to Hansen's work in the 1980s is equivalent to, say, arguing against oncology in 2014 by reference to where the knowledge base of that discipline stood in the 1980s. Such a line of argument says little to nothing about the science but much about the person who resorts to it.
-
TallDave at 14:50 PM on 17 December 2014Hansen's 1988 prediction was wrong
The EPA is not lying.
http://www.epa.gov/climatechange/images/ghgemissions/TrendsGlobalEmissions.pngConcentrations are not emissions. If Hansen's explicitly described emissions scenarios didn't result in the concentrations he expected them to, that's a failure of his model. Pretending otherwise is the just the kind of three card monte that is causing the public to justifiably lose faith in climate science as an objective enterprise.
"Contrary to TallDave's missinformed epistemology, there is no logical difference between forecasting and hindcasting."
I'm just going leave that there to speak for itself.Moderator Response:[Rob P] - Sloganeering struck through.
-
slowtojump at 11:22 AM on 17 December 2014Tree-rings diverge from temperature after 1960
That was thoughtful of you to protect your blog from my post. Surely most of the reader already know that CO2 has a shielding limit once the critical concentration is reached that completely blocks the IR the narrow band areas not overlapped by water vapor. But this post only makes sense if you allow my prior post back.
Moderator Response:[PS] Offtopic. If you want to comment here, you must abide the comments policy. If you do not, then posting rights will be forfeited. The right place to comment (after you have read the science and can back your comment) is "CO2 effect is saturated". Use the search function on top left to find appropriate place. Repetition of long-debunked myths without new data is simply sloganneering.
-
scaddenp at 11:07 AM on 17 December 2014Antarctica is gaining ice
Just thought that I would note that there is very nice review article on Antarctic sea ice increase and theories about why this happening by Eric Steig here. In short, it is the winds, but it is also rather complicated. Also, the transient response (what we see here) is likely different from the equilibrium response. It also points an interesting paper by here where a model driven by all the observed changes in winds pretty much reproduces the pattern in sea ice seen. h/t to Realclimate but thought this was an interesting addition to this thread.
-
slowtojump at 10:49 AM on 17 December 2014Tree-rings diverge from temperature after 1960
To summarize, supporters of Michael Mann are annoyed at the dust up about him splicing direct NOAA data on the end of 960 years of proxy data when we know now that many climate scientists knew about this, called it "the divergence problem," and were OK with Mann not clearly labeling what he was doing for the world policy makers. The big story about 2009 is need for better email security and need to catch science hackers. Because the "data trick" to "hide the decline" got miscontrued by many due to bad non-scientists like Sarah Palin. All real scientists know that the Briffa data set was perfectly valid until 1960 when modern interferences caused it to be invalid from there on. And, we all know that warming must be occuring becuase atmosheric CO2 in known to cause rapid warming (not gradual or minimal) because we see in the ice core record that warming is always associated with higher CO2, even though the "lag problem." The CO2 increased always after the warming but this is an even more alarming observation because it means that warming can be triggered by a small amount of CO2 that then causes a run-away spiral of more and more CO2. And we don't know how the warming stopped, the CO2 declined and the oceans and land recovered. Conclusion: we need to take action to freeze industrialization or better, reverse it along with population but currently lack necessary political structure to do so.
Moderator Response:[PS] Welcome to Skeptical Science. Please take time to review the comments policy. Comments that do not conform will be deleted. In particular, please note the "No sloganeering" and "No Accusations" section. You are very welcome to discuss the science and article content, supporting your arguments with appropriate data and references. However, it would pay to first read the articles.
-
scaddenp at 09:34 AM on 17 December 20142014 SkS News Bulletin #6: LIMA COP20 / CMP10
To me, that is essentially the same as 3 but you providing detail of mechanism for carbon trading and for development. The essentials are the same: the rich emissions go down a little, the poor rise a little; poor get money for development. I think the objections are largely the same: how to ensure money flow from rich to poor (which restores some historical equity) goes to where you want it without interfering in governance of receiving state.
-
Tom Curtis at 08:09 AM on 17 December 20142014 SkS News Bulletin #6: LIMA COP20 / CMP10
scaddenp @3, you forgot:
4/ Everybody agrees now to an equal per capita limit and staged reduction of that limit, with the limit set based on populations at a fixed date so that countries that allow their population to increase cannot evade capping CO2.
This is a guaranteed equitable approach, although not perfectly equitable as it allows western nations a greater cumulative emissions. This approach comes in two versions:
4a/ The initial cap is set at a level achievable by the most polluting nations, and emissions trading is not permitted; and
4b/ The initial cap is set at current global average per capita emissions, and trading of emissions permits between nations is permitted on the provisio that capital recieved in the trading is used to:
i) invest in renewable energy and associated energy infrastructure;
ii) climate adaption programs; or in countries with most need
iii) programs addressing current structural causes of poverty or ill health.
4b permits an immediate cessation of increases in net global emissions, while providing a larger incentive for rapid reduction of emissions in Western nations.
-
scaddenp at 07:14 AM on 17 December 20142014 SkS News Bulletin #6: LIMA COP20 / CMP10
In my highly personal and not necessarily brilliantly informed opinion, there are basically 3 ways to make a deal:
1/ Everyone caps their emissions now. This a no-equity solution where the rich countries stay rich (they got wealthy burning the fossil fuels and responsible for 70-80% of the extra CO2 in the atmosphere) and poor stay poor, but hey, if you dont stop emitting, then poor countries would cop the worst of effects.
2/ The rich countries cut emissions to near zero quite quickly and let poor increase emissions. This is equitable and doesnt involve wealth redistribution (at tax level) but good luck selling that to powerful rich countries where the required rate of emission drop would cause economic pain.
3/ Rich countries take more modest drops (but still quite quick) and poor make very modest increases, but get assistance in developing clean energy and development. Sounds reasonably equitable but runs into screams from rich countries about "my tax dollars getting siphoned by some rich dictator" and poor countries complaining of rich countries trying to run their affairs.
All three options sound extremely difficult to sell to me. For rich countries the option of Screw-the-planet-because-I-wont-be-bearing-much-of-the-cost is all too appealing especially to their voters and most are democracies.
-
MA Rodger at 07:02 AM on 17 December 2014Two degrees: The history of climate change’s ‘speed limit’
Joel_Huberman @5.
-
wili at 03:13 AM on 17 December 20142014 SkS News Bulletin #6: LIMA COP20 / CMP10
Is there any chance that the good folks who run this sight, whom we have come to trust and cherish, would consider weighing in with their own assessment of the outcome of the Lima talks?
Moderator Response:[JH] Thanks for the positive feedback and suggestion. I'll pass it on to the all-volunteer SkS author team.
-
michael sweet at 02:34 AM on 17 December 2014How much will sea levels rise in the 21st Century?
Knaugle:
From Jevrejeva 2014:
"There is a good agreement between the rate of sea level rise (3.2 ± 0.4 mm·yr− 1) calculated from satellite altimetry and the rate of 3.1 ± 0.6 mm·yr− 1 from tide gauge based reconstruction for the overlapping time period (1993–2009). The new reconstruction suggests a linear trend of 1.9 ± 0.3 mm·yr− 1 during the 20th century, with 1.8 ± 0.5 mm·yr− 1 since 1970."
It appears the skeptics are quoting the sea level rise over the 20th century. Since the sea level rise is accelerating, using this longer time period lowers the reported rate. If you measure the most recent 30 years Jevrejeva agree with the oft reported 3.2 mm/yr from satellites. Skeptics appear to claim deceleration from the 1970 to present rate.
That seems ok if you don't mind overlooking the fact that sea level rise is accelerating. If we average over the past 1000 years the rate will be almost zero! No problem!
-
knaugle at 02:09 AM on 17 December 2014How much will sea levels rise in the 21st Century?
I'm noticing some people are quoting Jevrejeva et al 2014 as proof that mean sea level rise is nowhere near the often quoted 3 mm/year, and in fact is more like 1.8 mm/yr and decelerating.. Curious what is the story of this recent study?
-
Joel_Huberman at 00:37 AM on 17 December 2014Two degrees: The history of climate change’s ‘speed limit’
That's a great graph, newairly. Where did it come from?
-
Joel_Huberman at 00:22 AM on 17 December 20142014 SkS News Bulletin #6: LIMA COP20 / CMP10
Thanks, John Hartz, for a valuable summary of the range of opinions about the Lima talks. Let us hope that the more optimistic of these opinions will prove to be correct and that a treaty capable of rapidly reducing world-wide greenhouse gas emissions will be negotiated next year in Paris.
Moderator Response:[JH] You're welcome. I'll be including more articles/commentary about what transpired in Lima and what lies ahead in future issues of the Weekly News Roundup.
-
newairly at 20:24 PM on 16 December 2014Two degrees: The history of climate change’s ‘speed limit’
I meant 1C not 11C
-
newairly at 20:20 PM on 16 December 2014Two degrees: The history of climate change’s ‘speed limit’
TThis graph sems to shaw what I was trying to point out. It shows that for a 66% chance of staying below 2C there is a 10% chance of exceeding 3C and a 90% chance of exceeding 11C The question still is, what probability is being talked about whenthe phrase "limit of 2C" is used.
 Moderator Response:
[RH] Resized image.
-
MartinG at 17:06 PM on 16 December 2014Two degrees: The history of climate change’s ‘speed limit’
The 2 degrees is rather like the donkey chasing after the carrot hanging in front of him on a pole that he himself carries. It’s a great trick to get him to move forward because he is not intelligent enough to see he himself is the reason he will never make the target. 2 degrees is a great signal – good to use in propaganda, but for me it deflects from the much broader mainstream issue that our whole materialistic livestyle, and economic system based on growth measured in money, is exploiting and polluting the earths resources at a rate which is unsustainable. Politicians and some scientists can focus on 2 degrees – fine – but if they tell their voters that they need to accept a downturn in their material wealth they wont be in office for long. We need to raise our sights from the narrow focus of 2 degrees and accept that the problem will not change or go away until we look much deeper at how we run our society.
-
newairly at 13:12 PM on 16 December 2014Two degrees: The history of climate change’s ‘speed limit’
What is actually meant by a two degree limit?
Is it a 50/50 chance of staying below, a 90% chance or an absolute limit which can not be exceeded. Given that the predictions can not be perfect, there has to be some uncertainty and we have probably long ago pased the point where it can be said with certainty that two degrees will never be exceeded.
-
tonyabalone at 12:19 PM on 16 December 20142014 SkS Weekly Digest #50
In reply to scaddenp here in Australia we certainly wouldn't welcome an El Nino as it means severe dry weather and droughts. While "ever cloud has a silver lining" it is the lack of silver lined clouds that worry us!
-
Tom Curtis at 12:17 PM on 16 December 2014Is Earth’s temperature about to soar?
As an addendum to my comment @16, having looked at the NCEP v2 data available to me (1871-2010). Over the period of overlap (1948-2010), the v2 data is typically cooler than the NCEPv1 data (mean 0.023, St Dev 0.1). Over the last six years of overlap, it is consistently cooler (mean 0.14, st dev 0.017). If that difference is maintained for this year, that would indicate a temperature anomaly of 0.188 C for the v2 data. Why Ryan Maue's figure is 0.08 C below that I do not know. According to his figure, we are heading for the coolest year since 2011, even though there is no difference in temperature adjustment over the period and hence it is not a consequence of the homogeneity adjustment.
-
Tom Curtis at 11:45 AM on 16 December 2014Is Earth’s temperature about to soar?
Sorry, I forgot to include the link to the NCEP data source. DB, Icecap and the image are loading for me just fine. If it does not for you, the only relevant information is the baseline period, and the anomaly for Jan 1 to Dec 4th of 0.108 C. The data is listed as NCEP CFSv2, and the graph was prepared by Ryan Maue of Weatherbell (ie, Barstardi and D'Aleo's company).
-
Tom Curtis at 10:16 AM on 16 December 2014Is Earth’s temperature about to soar?
michael sweet @14, D'Aleo's claim is based on this plot from NCEP, which indicates a 1981-2010 baseline:
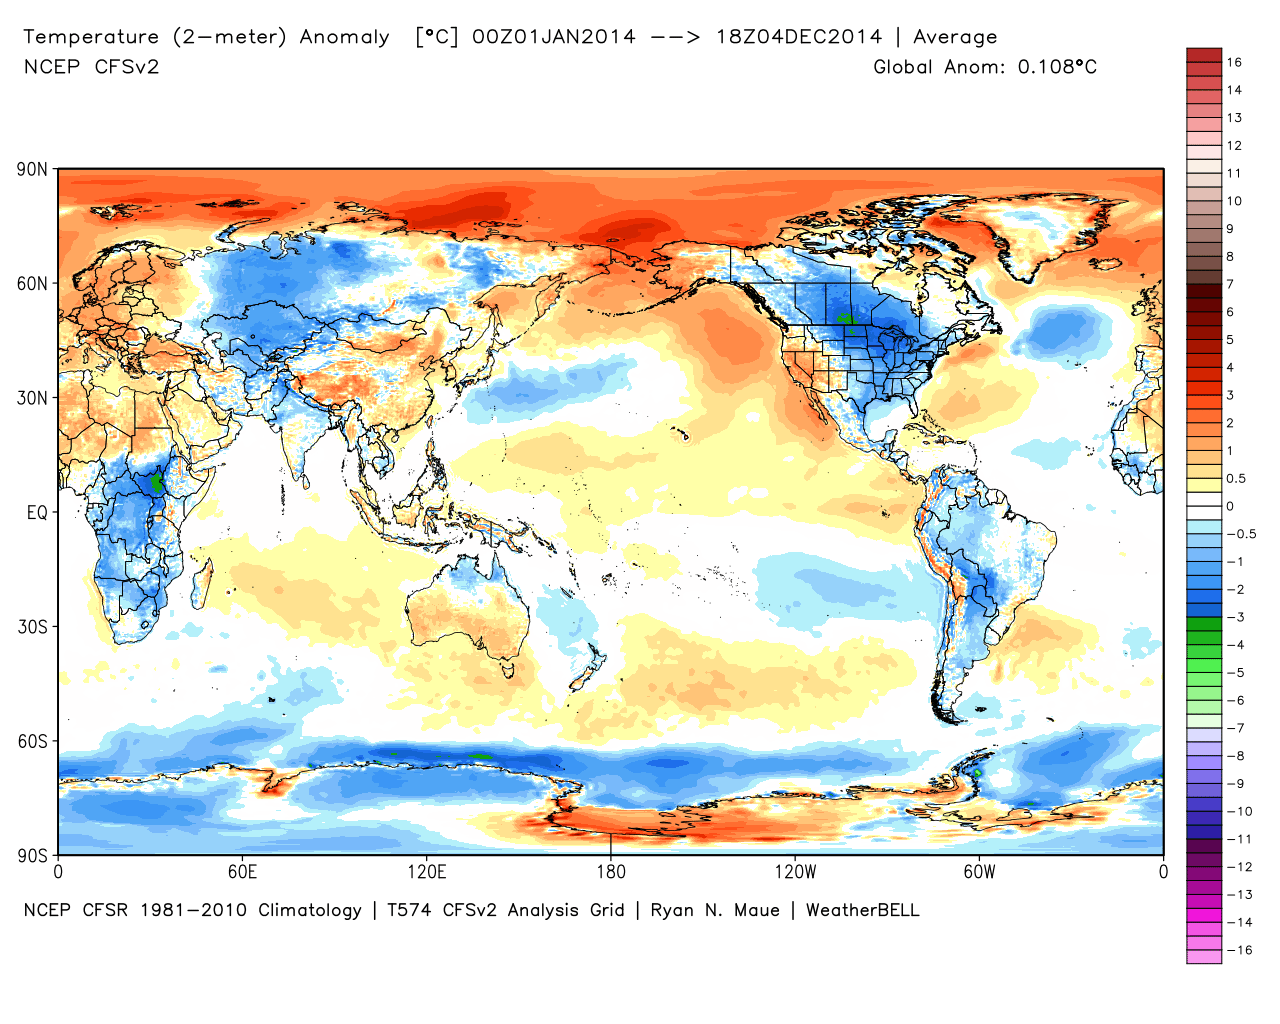
The NOAA 2014 eleven month mean (Jan-Dec) is 0.263 C using a 1981-2010 baseline. That is 0.414 C less than the value using their standard baseline, so the difference in baseline accounts for most, but not all of the difference.
I downloaded the NCEP montly reanalysis to Nov 2014 from here (timeseries). Converting to anomaly data I found that 2014 to the end of Nov (0.328 C) is currently ranked 3rd warmest compared to other full years, behind 2005 (0.355 C) and 2010 (0.343 C). For Jan to Nov temperatures, 2014 is also ranked 3rd, behind 2010 and 2005. This is the NCEP reanalysis, not the version 2 reanalysis used in the graph by D'Aleo, for which I could not find the raw data past 2012.
One key difference between the NCEP product and the global temperature products is that the NCEP data is the 2 meter air temperature, whereas the global temperatures products show the 2 meter air temperature* over land, and the surface water temperature at sea. That will result in a lower global temperature anomaly for the NCEP product because the air is, on average cooler than the ocean (as fake skeptics never tire of telling us). That, by itself may account for the remaining discrepancy between the NOAA global temperature anomaly and the NCEP reanalysis. What does not account for it is the input data, which should be essentially the same between the NCEP reanalysis and the v2 (where the difference in rankings in negligible, and may be entirely accounted for by their not measuring the same things).
Finally, a question. Am I alone in being struck by the irony of a fake skeptic preferring the product of a computer model (the NCEP reanalysis) over the observations?
(* The observations are for two meters above the actual land surface. The reanalysis may give the temperature that the air would be for 2 meters above sea level regardless of topography. This difference, if it exists, should not make any appreciable difference to the rankings.)
Moderator Response:[DB] ICECAP's website does not appear to be working, as the image will not load nor does the main site load.
[DB] Working now, it seems.
-
Stephen Baines at 09:17 AM on 16 December 2014There is no consensus
In short, the consensus is not about blind acceptance. The consensus has power precisely because scientists are challenging or have continually challenged it in various ways, and yet it has stood. The idea that there is a dichotomy between consensus and skeptical inquiry fails to appreciate how the process works..
-
Rob Honeycutt at 09:17 AM on 16 December 2014There is no consensus
The consensus on stomach ulsers story you present is one that has little basis in fact. Here is what Dr Marshall said of their work:
Even after your self-experiment, the medical community remained sceptical that H. pylori was connected to stomach ulcers. How did you finally convince them?
We were keen to present our data and announce that we had discovered the cause of ulcers, so we submitted our paper to the Australian Gastroenterology meeting in 1983. It was rejected. Fortunately, my boss at the time had some experience with Campylobacter, which was becoming a popular explanation for infectious colitis, or inflammation of the colon. Helicobacter looked similar, so I spoke to a Campylobacter expert in Britain and we sent him some cultures. He grew them and became excited about it, too. Then, in 1984, we went to a meeting of microbiologists, who are always interested in any new microbe, and things really took off after that. It took a few more years to gain support from gastroenterologists.
[added emphasis]
As you can see, this was an idea that did not take long for the scientific community to accept.
-
Stephen Baines at 09:11 AM on 16 December 2014There is no consensus
"Concensus is always being proved wrong and science doesn't work and never has worked on the basis of concensus as I hope all the participants on this site well know."
This argument makes no sense. There is now a consensus that H. pylori is important in most ulcer cases. Your argument suggests should we ignore that consensus because it could be wrong. But that is the case with any proposition open to scientific questioning.
You are getting "faith" mixed up with "consensus." Consensus is about the current state of understanding given the information in front of us. It is critical to progress in science since it provides the methods, assumptions and questions needed to direct futher study. Without consensus, science would slow to a stand still because there would be no agreement about assumed knowledge to direct future research. In the case of H pylori, the question now becomes why 2/3s of people are infected, but relative few show any syptoms.
What consensus is not is unshakeable belief in a proposition. Consensus can be overturned because it is based on evidence. If evidence suggests the consensus should be overturned, a new consensus usually forms around a new proposition that is better supported by the evidence. Such paradigm shifts are extremely important in science, and come in all shapes and sizes. Much research can be seen as interesting because it challenges assumptions. But large scale revolutions, where a well established point of consensus that is central to many lines of research is overturned in favor of a new idea, is not the rule. That is why Kuhn referred to normal science in opposition to revolutionary science.
Climate science has settled on a consensus about current warming because the evidence points in a particular direction. At present there is no alternative hypothesis that fits the observations in front of us. Could there be an H. pylori we haven't seen in the climate that causes recent warming? Given that climate is governed by well established (by consensus) laws on transfer and conservation of energy, and we can measure most of the key flows and modifying factors, it seems unlikely. You would have to challenge the consensus on thermodynamics, or radiative transfer, or physical chemistry, because those agreed principles underlie this more specific consensus.
-
Rob Honeycutt at 09:08 AM on 16 December 2014There is no consensus
Peter Lloyd @638...
My first question for you would be: Have you read the Cook et al paper yet? I ask this because you seem to be operating under a number of assumptions that in error.
Firstly, the basis of the study was to evaluate whether research papers endorsed or rejected the IPCC position that human's are primarily responsible for warming of the past 50 years. The IPCC statement on this matter suggest that there is a >95% confidence level that human's are responsible for more than half of the warming. Part of the position the IPCC states is tha the most likely figure is that human's are responsible for 110% with a high end likelihood of 160%.
Even at >100% contribution no one is going to claim that human's are "solely" responsible for warming. There are always natural warming and cooling factors at work. Thus, your statement would be one that 100% of scientific researchers, and scientific research would reject.
Secondly, you appear to be under the incorrect assumption that Cook et al was attempting to infer whether the science was "correct." That is not the case. If you read the paper, the whole point is that most non-scientists do not understand what the actual level of scientific consensus is. The paper is quantifying the consensus and presenting that in juxaposition to what the general population thinks the consensus is.
-
Peter Lloyd at 08:23 AM on 16 December 2014There is no consensus
If the question in the concensus sudy had been "Is recent climate warming solely due to human influences" then it would be interesting to know what the answers would have been.
Of course concensus doesn't mean right which is the implication of the video. Concensus is always being proved wrong and science doesn't work and never has worked on the basis of concensus as I hope all the participants on this site well know.
Thirty years ago there was an unshakeable concensus in medical science that the main group of stomach ulcers were caused by excess acid secretion. It took a new scientific discovery to prove that the concensus was wrong. The cause of an unpleasant condition that had affected more than 1 billion people and that affects around half the US population over 60 years old is a bacteria Heliobacter Pylori. New drugs were invented that treated it and the previous treatment was dropped.
Of course it is worth knowing that 97% of research papers and / or their authors attribute global warming to humans but as the video says, it's the science behind it that counts, and just because the papers are peer reviewed in itself proves nothing about whether the scientific proposal / theory is necessarily right. Some ability to falsify the theory must exist (as happened in the case of H.pylori) otherwise it's just the latest best estimate - no matter how great the concensus.
The fact that only half the public believes that it is proven that AGW is the sole or main cause of global warming says something to the idea that the proof is not necessarily there and publicising it (there has been a ton of that) can't alter the impression that there is a long way to go before we are remotely close to knowing for certain.
One reason for being confident about there being much more uncertaintly than the 97% concensus suggests is that there is nothing like a concensus, let alone proof, of what caused (and causes) the extreme natural variations in climate throughout geological time.This variation is well documented and almost certainly has a variety of underlying causes which are likely to be very different from C02 or other MM emissions even if higher greenhouse gases levels have often been present. For example we do know that glaciers existed at the poles when C02 levels were a hundred times the current concentrations.
-
Phil at 05:28 AM on 16 December 2014How Increasing Carbon Dioxide Heats The Ocean
At the risk of incurring a "pilling on" Moderator comment, can I just add this for Gac73
The explanations that Michael and CBDunkerson have offers, include a kernel of information that explains why your use of the Laws of Thermodynamics is flawed. The key point is that, since the Ocean is warmed by the Sun (as indeed is the atmosphere to a lesser extent), the Ocean + Atmosphere are not an energetically isolated system. They may be stable, but they are only so with a constant flow of energy through the system, and so are not at equilibrium. If they were energetically isolated, then you would be correct: for the very simple reason that there is nothing to heat the ocean except the atmosphere, and it cannot do so because it is cooler.
Rigourously thermodynamics only applies to energtically isolated systems. We can treat the Earth as a "nearly" thermodynamic system but only if we include the Sun, and outer space as a heat sink
Hope that helps.
-
Rob Honeycutt at 02:13 AM on 16 December 2014Is Earth’s temperature about to soar?
Michael Sweet... "Joe D'Aleo is smart enough to know this."
I wouldn't be too sure about this. He's certainly capable of knowing this, I'm not so sure, once he's found a point that he prefers, that he's capable of moving past it to actually admit an error. -
michael sweet at 02:13 AM on 16 December 2014How Increasing Carbon Dioxide Heats The Ocean
Gac73,
I like CBDunkersons reply. The energy goes: Sun, Ocean, Atmosphere, space. Do you have additional questions?
Be careful when you look up the citations. It is easy to take a quotation from someone like Dr. Trenberth out of context to suggest that his comment is incorrect. Try to find the context and the question being answered.
-
michael sweet at 02:09 AM on 16 December 2014Is Earth’s temperature about to soar?
Sailingfree,
The forecast models undoubtedly use a different baseline than NOAA does. Joe D'Aleo is smart enough to know this. NOAA uses the average of the 20th century. Forecast models probably use the last decade (I could not find their baseline in a quick Google), although they might use a longer time period. Since the difference is so small that suggests they use a recent baseline.
-
sailingfree at 00:32 AM on 16 December 2014Is Earth’s temperature about to soar?
The skeptics are already reacting, by finding another data set.
On his site ICECAP, joe D'Aleo claims: "Using the actual data that goes into the forecast models used for the 7 day forecasts you see on TV and the internet, we find the global anomaly was a mere +0.07C in November and for the year to date a measly +0.11C, far short of the +0.68C warmest ever anomaly that NOAA claimed last month. One modeler told me “It was obvious to me since about April that NOAA had decided that 2014 was going to be the hottest year ever. The White House needed this for their political objectives.”"
Moderator Response:[Rob P] - Resorting to conspiracy theory isn't a cogent argument. Don't worry, if 2014 does in fact end up the warmest year in surface temperature data sets we can expect a lot of lame excuses from the anti-science brigade.
Prev 638 639 640 641 642 643 644 645 646 647 648 649 650 651 652 653 Next


