


 Arguments


Recent Comments
Prev 648 649 650 651 652 653 654 655 656 657 658 659 660 661 662 663 Next
Comments 32751 to 32800:
-
gws at 08:48 AM on 12 November 2014More research confirming large methane leakage from shale boom
Bit too "rough & ready" ...
The atmospheric increase is based on an imbalance between sources and sinks. The historic imbalance was probably ending in the late 80s and it took 2-3 decades, based on methane's atmospheic lifetime, to reach a new equilibrium, about ten years ago. The new imbalance is still being researched, and while it is tempting to prescribe the shale boom as its cause, evidence from atmospheric background stations, shown by Ed Dlugokencky at AGU last December, and available as Nisbet et al. (2014), is mixed. Methane rise in northern mid-latitudes was strong in 2008-09, then again in 2012-13, but not in between.
Even if the 12 Mt/yr CH4 were correct, and that is closer to the current estimate of total US emissions including all sources, that does not necessarily mean that that is the answer just because it matches the global atmospheric increase.
There is a recent review paper here that may be useful to digest for those who want to learn more, and in detail .... Quote:
We show that a rise in natural wetland emissions and fossil fuel emissions probably accounts for the renewed increase in global methane levels after 2006, although the relative contribution of these two sources remains uncertain.
-
Mike3267 at 08:32 AM on 12 November 20142014 SkS Weekly Digest #45
Regarding the cartoon, neither the major oil companies nor most religions deny human caused climate change. We will be much more likely to win over still skeptical Americans if we point this out, rather then promoting stereotypes. Even the World Coal Association supports action to reduce GHG emissions. I am not saying these statements can always be taken at face value, but that they undermine and discredit the deniers.
-
Don9000 at 08:31 AM on 12 November 2014We must manage global warming risks by cutting carbon pollution, top scientists conclude
wili@3
Remember too that yields have been increasing due to modern agricultural practices. In other words, there are negative and positive forces and trends at work when it comes to crop yields.
Re. the old frog story:
There's nothing apocyrphal about it. I used to rescue frogs from a hot tub at my old apartment complex in Florida during rainstorms--at least those I reached in time. They would hop in and quite peacefully hang out as they heated up to the point of no return, which in a 40 degree C hot tub wasn't more than about ten minutes. On several occasions, particularly on warm rainy nights in the spring, if the tub wasn't running, I had to clear an assortment of dead and living frogs from it. The living ones were always acting like climate change deniers--they were oblivious to the threat.
If a frog jumped in when the tub was running (and of course thus rather foamy), anyone who wasn't squeamish joined in the rescue efforts. Those who were squeamish usually exited the tub quite rapidly.
-
MA Rodger at 07:29 AM on 12 November 2014More research confirming large methane leakage from shale boom
tmbtx @1.
A very rough & ready back-of-fag-packet calculation. By 2007, man-made CH4 emissions were 282Mt(CH4) resulting in an increase of 12000ppb. Since 2007, atmospheric CH4 has risen ~50ppb, which would simplistically require an increase in emissions of ~12Mt(CH4) pa. US fracking (2013) produced 10.33 tcf CH4 /48.700 = 212Mt(CH4). So (assuming no decimal point slippage in these calcs) leakage of about 6% production would yield the 12Mt(CH4) pa increase in atmospheric CH4.
-
jja at 05:43 AM on 12 November 2014More research confirming large methane leakage from shale boom
Equally unsurprising is the front group's repeated attack on the seminal publication by Howarth, Santoro and Ingraffea, as if the claimed refutation of its results somehow invalidates all subsequent findings of high methane emissions. The parallels to Global Warming denial are all too obvious.
This technique is called a "dog whistle" where the heavily indoctrinated key into an entire litany of misrepresentative arguments upon hearing key terms like "Mann" or "hockey stick". It is a dog whislte, because only the heavily indoctrinated have the pavlovian response to a signal that is not heard by rational, interested parties.
If they could marshall enough propaganda dissemination outlets to besmirch the name of "Howarth" as they have Michael Mann, they would be very, very happy about that. Because all later analyses would be jumbled into the first (e.g. Marcott). -
tmbtx at 01:48 AM on 12 November 2014More research confirming large methane leakage from shale boom
Just an observation at this point, but the atmospheric methane curves had somewhat flattened until about 2007. What began in 2007 at the same time the curve started up again? The shale boom.
-
Bob Loblaw at 01:43 AM on 12 November 2014IPCC overestimate temperature rise
A word to bcglrofindel, who I hope is still following this thread:
One of the SkS comments policies is "no dog-piling", which is intended to avoid having one poster have to deal with a whole bunch of comments from several people. It can be overwhelming.
In this thread, you've now had several people respond. In your last comment @21, you indicated that you still inidcate a desire for a simple graph, even though there have been several comments saying why this is difficult - some directed to you, some in response to jsmith's earlier graph.
If you still can't see why the graph jsmith provided is misleading, it would help if you told us why you feel that the responses don't explain it well. Please engage in a conversation about these explanations. If the number of responses is too much for the moment, tell us that you wish to discuss one aspect of things, and engage on that aspect. Refrain from introducing new issues until the discussion on that aspect is complete.
Regulars here wil lose patience if they feel that their responses are being ignored. A simple acknowledgement of "OK, I see that now" (as suggested by Tom @ 26), will go a long way in terms of encouraging a productive discussion.
-
One Planet Only Forever at 01:20 AM on 12 November 2014We must manage global warming risks by cutting carbon pollution, top scientists conclude
wili,
Unfortunately what is going on is likely far more sinister than the simple frog in warming water scenario. The regions expected to momentarily improve the ability to grow food are mainly in the already well developed and wealthy nations that must make the biggest reduction of their per-capita impacts.
So what is going on is that the leaders who try to appease popular opinion in those wealthy powerful developed nations are essentially putting the less developed regions of the planet into a pot and keeping the burner going, while the people in the pot understand exactly what is going on but are unable to stop it. And caring and considerate bystanders outside the pot are equally unable to stop it because of the power of popular opinion driven by profitable damaging ultimately unsustainable pursuits.
It will be interesting to see what the future generations think of leaders who did not vigorously fight to improve the better understanding of what is going on. Made-up unsustainable appearances of success and affluence eventually fall apart.
-
wili at 21:07 PM on 11 November 2014We must manage global warming risks by cutting carbon pollution, top scientists conclude
So if not CO2 fertilization, is it just the added heat and moisture that helps increase yeilds?
It all reminds me again of the (apocryphal?) anecdote about the frog in slowly warming water--at first it just seems like its just getting nicer and nicer as it warms, so why jumpt out? But by the time it starts to boil, all ability to react adequately (jump out) has been lost.
-
wili at 20:34 PM on 11 November 20142014 SkS Weekly News Roundup #45C
Here is a link to an article that discusses some of the strategies being employed in Sao Paulo to avert catastrophe. They all seem like great things to have been planned and implemented years ago. Now it feels like too little too late.
Sao Paulo Announces Measures Against Worst Water Crisis in History
-
One Planet Only Forever at 15:32 PM on 11 November 2014We must manage global warming risks by cutting carbon pollution, top scientists conclude
wili,
I'm not sure that CO2 fertilization is expected to be a big booster of food production.
I can't quickly find a specific online reference, you can check the references listed in the IPCC report, but I recall reading several articles on the issue that implied that the expected near-term climate changes may marginally improve growing conditions in already established farming regions. However, the continued changes after those near term changes would make many of those regions less reliable for food production.
An unfortunate twist could be that areas not currently cleared and usable for growing food with appropriate infrastructure will rapidly shift to having more favorable conditions then shift to not being so favourable. The changes to regional climate could be too quick and difficult for those trying to adapt to predict and effectively adapt to. The result could be a fruitless chase after regions with better growing conditions that are hoped to last.
The 'good news' is that such a wild-goose-chase would only be for as long as the rapid changes occur. Eventually the ones who make it through the tough decades (or centuries) would have a decent chance to figure out the better places to grow food and live using the hopefully dramatically improved ability to understand what is going on and the ability to keep the less concerned people, those who only care about a better present day existence for themselves, from creating more future problems.
-
Tom Curtis at 14:40 PM on 11 November 2014IPCC overestimate temperature rise
KR @25, I have not assumed bcglrofindel does not have valid concerns. I have addressed his concerns by showing why a direct comparison is simply misleading (on numerous grounds). He is quite welcome to respond by showing that he now gets why it is inappropriate.
-
IPCC overestimate temperature rise
Tom Curtis - Note that bcglrofindel didn't insist that modeling was invalidated by differences between past projections of climate versus emission expectations, but presented a query as to why a simple comparison might look off. While there are a lot of climate trollers who pass by, I would prefer to treat everyone as sincerely interested in a discussion unless/until proven otherwise.
-
wili at 12:45 PM on 11 November 20142014 SkS Weekly News Roundup #45C
Thanks, OPOF.
On the Sao Paulo situation, a poster on another site says local sources there are talking about major projects to start cycling used sewage water back into the system to be filtered and reused, as is done to varying degrees in a number of cities around the world. I'm not sure if or how they can get that kind of a system up and running in time to avert major catastrophes in the mean time.
-
wili at 12:40 PM on 11 November 2014We must manage global warming risks by cutting carbon pollution, top scientists conclude
So it looks like the proverbial stuff hits the fan starting about 2030 for crop yields? I'm surprised there isn't more of a negative effect till then.
I had heard something about a ten percent loss in global yield for every degree C of GW, and that made it sound like a rather steady, lock-step relation. But as with much else, there seems to be a lag between the basic change and the full negative consequences of the change.
Kind of unfortunate, since we will not get a clear signal from this vital sector of the economy till we have already commited ourselves to truly catastrophic levels of GW. And we seem to need many very stron signals to even begin to get our attention.
So is CO2 fertilization really that strong of an effect in the short run? If not, what exactly accounts for this lag till 2030 for something like the full negative effects of GW to start hitting the ag sector?
-
Tom Curtis at 11:44 AM on 11 November 2014IPCC overestimate temperature rise
bcglrofindel:
1) In the estimates made using the energy balance diffusive model, the IPCC assumed a radiative forcing for doubled CO2 of 4 W/m^2 rather than the actual 3.7 W/m^2. The more accurate value was determined by Myhre et al (1998), and included in IPCC reports since the Third Assessment Report (2001).
2) The radiative forcing for the BAU scenario in 2015 for the energy balance diffusive model of IPCC FAR was 4 W/m^2 (Figure 6, Policy Makers Summary, IPCC FAR). For comparison, the current radiative forcing is 3 W/m^2 (IPCC AR4 Technical Summary, Table TS.7), 25% less. To properly test the actual model used in making the predictions, you would need to run the model with accurate forcings. An approximation of the prediction can be made by simply scaling the values, so that the IPCC 2030 predictions would be 0.83 C (0.53-1.13 C).
3) The reasons for the high value of the projected BAU forcings are:
a) The high estimate of radiative forcing for a doubled CO2 concentration already mentioned;
b) The fact that the model did not project future temperature changes; but the effect on future temperature changes based on changes in GHGs alone; and
c) A failure to predict the break up of the former Soviet Union, and the consequent massive reduction in emissions growth.
Factors (a) and (c) explain the discrepancy between the projected BAU forcing for GHG alone (4 W/m^2 for 2015) and the current observed forcing for GHG alone (3.03 W/m^2). From that, it is easy to calculate that there is a 16.75% reduction in expected (BAU) forcing due to reduced industry in the former Soviet Block (plus unexpectedly rapid reduction in HFC's due to the Montreal Protocol).
Thus insisting on a comparison of the actual temperature trend to the actual BAU projections in order to determine the accuracy of the model used by IPCC FAR amounts to the assumption that:
A) The IPCC intended the projections as projections of actual temperature changes rather than projections of the expected influence of greenhouse gases, contrary to the explicity statement of the IPCC FAR;
B) The IPCC should be criticized based on their use of the best current science rather than the scientific knowledge gained 8 years after publication, and 16 years prior to the current criticism (Myhre et al, 98); and
C) The failure of the IPCC to project the break up of the Soviet Union invalidates its global climate models.
The last leaves me laughing. I look forward to your produceing quotes from the critics of the IPCC dated 1990 or earlier predicting both the break up of the Soviet Union and a huge reduction in CO2 emissions as a result to show that they were wise before the event. Better yet would be their statements to that effect in peer reviewed literature so that the IPCC can be shown to be negligent in not noting their opinion. I expect confidently zero evidence of either (due to their not existing).
I am also looking forward to your defence of those three assumptions, as you seem to consider the direct comparison (rather than a comparison with the forcings of the model adjusted to observed values) to be significant. Failing that defence, or your acknowledgement that the assumptions are not only invalid but unreasonable, I will consider you to be deliberately raising a strawman.
4) Despite those issues, the 30 year trend to 2013 of the GISS temperature series is 0.171 C per decade, just shy of the 0.175 C per decade for the lower value. That it is just shy is entirely due to short term variation due to ENSO. The 30 year trend to 2007, for example is 0.184 C per decade, just above the lower limit. Further, that is a misleading comparison in that it treats the trend as linear, wheras it the projection in fact accelerates (ie, we expect a lower than 0.175 C trend in the first half of the period). Ergo, not withstanding all the points raised above, the IPCC FAR projections have not in fact been falsified - even without adjustments to use historical forcing data, and even ignoring the fact that it was not intended as a projection of future temperatures (but only of the GHG impact on future temperatures).
-
scaddenp at 09:22 AM on 11 November 2014IPCC overestimate temperature rise
" Isn't it trivial to plot actual temperature against the 3 projections the IPCC gave in Fig 6.11?"
But doing that comparison would be falling for a straw man fallacy. The IPCC does NOT predict that actual measured temperatures will follow those lines. However, it would expect 30-year trends to follow those lines. It is interesting that skeptic make dance that actual temperature is below ensemble mean (its natural variation), but werent worried when in earlier decades suface temps were running hotter (also natural variation). Trends in surface temp shorter than 30 year are weather not climate.
-
IPCC overestimate temperature rise
bcglrofindel - I would have to agree that the chart is quite difficult to parse. But that's not uncommon when overlaying so much data, and frankly the TAR/SAR/FAR models and projections, while interesting as historical documents, are far from state of the art in resolution, in incorporated components of the climate, and perhaps most importantly in the more recent forcing histories.
Hence, while I personally would have preferred to have just the overlaid ranges and not individual model runs plotted there, I'm not surprised that AR5 spent very little time and graph space on the previous reports.
-
bcglrofindel at 07:31 AM on 11 November 2014IPCC overestimate temperature rise
Thanks KR, my trouble is still actually seeing what the FAR range actually is on that graph. I've hunted around for the actual underlying data for the graph but can't find it anywhere. Regrettably, the shading of all 4 AR onto the same graph leaves the FAR virtually completely hidden for the entire time the instrumental record is plotted :(.
-
IPCC overestimate temperature rise
bcglrofindel - You certainly can find such a plot. I would suggest looking at the AR5 Technical Summary, in particular Fig. TFE.3:


JSmith's graph suffers from selecting a single timepoint offset, rather than a multi-year average that cancels out short-term variations, and hence is a misleading presentation.
-
bcglrofindel at 06:57 AM on 11 November 2014IPCC overestimate temperature rise
Maybe more simply, I want to add the red line below where the red line is actual instrumental temperature record:

-
bcglrofindel at 06:53 AM on 11 November 2014IPCC overestimate temperature rise
I wa referring to the temperature projections from the IPCC first assessment report, Chapter 6. In Figure 6.11 they have 3 graphs for three different temperature sensitivities. It's also notably the ONLY temperature predictions posted in the first assessment report, isn't it? I'll post the image a second time below. What I am told is that actual instrumental temperatures are colder than all of the predictions in Fig 6.11 from the IPCC F(irst)AR. Can someone not simply graph instrumental temperatures against the IPCC projections below and demonstrate the truth? Shouldn't it be a simple enough task? Unfortunately the only examples I can find are like JSmith's that are declared inaccurate.

-
Bob Loblaw at 06:40 AM on 11 November 2014IPCC overestimate temperature rise
bcglrofindel:
I can't sort through just exactly what your issue is with the IPCC projections. To begin with, exactly which projection are you selecting, why are you selecting that one, and what data are you using to compare?
Each IPCC projection has some assumptions in it, with respect to the growth of atmospheric CO2 (emissions scenario) and the temperature response to that change in CO2 (climate sensitivity).
With four emissions scenarios and three climate sensitivty values, that gives 12 projections "on display". Note that these projections are not "predictions", because the IPCC is not claiming that one (or any) of these is "the one". When comparing to observations (i.e., testing the projections as if they were predictions), you have to do the following:
- if one of the 12 scenarios is a good match choose it
- if none match well, adjust the results from the projections to take into account the difference in assumptions - i.e., interpolate or extrapolate from the published scenario results.
Note that the choice of an approriate scenario is based on the closeness of the assumptions, not the closeness of the temperature trend.
Let's take a trivial model as an example. Let's assume that we have a linear model that states:
T = A + B*CO2(t)
where T is temperature at time t, as a function of the concentration of CO2 at time t (CO2(t)), and A and B are parameters. If I want to make a projection (not a prediction) of temperature into the future, I need three things:
- I need a scenario to tell me the value of CO2(t).
- I need the sensitivity parameter B (the slope, in linear-equation-speak)
- I need the inital value A (the intercept, in linear-equation-speak)
I will have uncertainties in my CO2(t) values, and in my sensitivity B. As a good scientist, I will try several values of each, based on my understanding of what is reasonable or possible, and I will publish results of those several projections. This is what the IPCC did (with models a little more complex than the linear example here!).
Now, after several years, I want to compare the actual observed T to my model results. I need to determine:
- did one of my CO2(t) assumptions fit reality?
- do I have any better information to tell me what value of B is best?
...and, most importantly...
- what is an appropriate value of A to use to start things off?
Once I have all that, I can start to compare the model to observations. I may need a new CO2(t) time series, and I may need to use different values of A and B from my earlier projections. Note that this does not mean that I'm changing my model: I'm just changing input parameters.
jsmith's graph has the mistake of choosing an inappropriate value for A. The observations contain a lot of "noise", which causes annual variation that is not a function of CO2 concentration. If jsmith's graph were repeated using 1992 as a starting point, the results would be very different. This lack of a robust result ("robust" means that the analysis is not highly dependent on a particular assumption) is an indication that the result is unreliable. This is what Dikran points out in comment #10.
By contrast, if you averaged observations over several years and matched that to the average of the model over the same years, and used that to determine the value of A, you would likely discover that the value of A did not change much if you chose different periods (near the start of the comparison). This would be a robust result, because you could say "I chose this period, but the results are pretty much the same if I choose another period".
-
bcglrofindel at 05:46 AM on 11 November 2014IPCC overestimate temperature rise
KR,
You still aren't giving a simple apples to apples comparison. The claim I see people making is that the published IPCC trends from 1990 are too high compared to actual measured temperature. Isn't it trivial to plot actual temperature against the 3 projections the IPCC gave in Fig 6.11? That would easily do away with all the hedging and confusion and end the matter, no? Why can't I find such a simple plot anywhere? All the places I find such a plot, like JSmith's in thread, it's called out as inaccurate. Can't 3 simple plots done on excel in about a half hour clear this up and silence skeptics?
-
IPCC overestimate temperature rise
bcglrofindel - In short, short term variability. GCMs are intended to project (not predict) average climate over the long term, and there has never been a claim that they could accurately predict short term variations that cancel out over several decades.
See this post examining how recent short term variations have affected longer term projections. Or this thread comparing various projections (including 'skeptic' ones) against actual temperatures, although that only goes to 2011.

Quite frankly, even the earliest IPCC projections are quite good. Certainly when compared to those from people in denial of climate science...
-
scaddenp at 05:06 AM on 11 November 20142014 SkS Weekly News Roundup #45B
"groupthink takes hold and dissident voices are treated with contempt"
Deliberate distortions of the truth are treated with contempt. Published analysis and new data are not. "Blog science" type analyses that somehow dont get published are generally because they are rubbish that playing to a gallery that uncritically accepts anything that conforms to their desire. I would love AGW to be proven false but I am not so stupid as to my wishes ignore data.
-
Ashton at 02:57 AM on 11 November 20142014 SkS Weekly News Roundup #45B
Thanks for that Tristan (and JH too) I had no idea what piling in meant. I would hope no one would refuse to acknowledge information but as they say information is not knowledge, knowledge is not understanding and understanding is not wisdom. I'm probably somewhere between knowledge and understanding on climate change.
I hope this doesn't get axed as I'd like to thank SkS for giving me a very fair go on this post
Moderator Response:[JH] As long as your posts conform to the SkS Comments Policy, they will not be deleted.
My sense is that English may not be your first language. Is that the case?
-
bcglrofindel at 02:54 AM on 11 November 2014IPCC overestimate temperature rise
If JSmith's methods were wrong can you not at least address his core concern? Your article doesn't show the actual IPCC first assessment predictions for temperature, but adjusts them prior to comparison to observed temperature. The IPCC first assessment summary states in Chapter 6 that for 2030 they see "a predicted rise trom 1990 of 0.7-1.5°C with a best estimate of 1.1C". If I'm not mistaken, we currently are very much on track to be under 1.1C warmer than 1990 in the next 15 years?
If JSmith made mistakes or inaccuracies in matching the observed temperatures to the 1990 IPCC predictions as they were published below, don't just settle for saying he did it wrong. Graph the actual observed temperatures against the actual published predictions of the IPCC from 1990 as shown below. I'm afraid all my efforts to match recorded observations to them only seem close to matching the very coldest 1990 predictions and I'd love to see a graph that can more clearly show me where I'm going wrong.
-
One Planet Only Forever at 01:49 AM on 11 November 2014New study questions the accuracy of satellite atmospheric temperature estimates
WRyan,
I understand that when you referred to the 21 year averages in the satellite data up to 2004 you meant the mid-point of the latest 21 year period ending in 2014. However, it may be clearer to refer to it as the average of 21 years ending in 2014, especially if you speculate about trend over the 'past decade'. You really are speculating about the trend that will be seen in the data through the 'coming decade' And looking at the trend of averages of shorter durations in the more recent data, as some may be tempted to do to see what is happening ion the 'recent past decade' does not indicate what the longer term averages will be. The data sets are filled with rather random rapid short-term changes.
Even the 21 year average you used to get a reasonable length for the trend in the satellite data may be a short duration. A more rigorous evaluation of the 30 year averages in the satellite data would probably alos indicate a rate cloase to 0.15 C per decade. I tried to make my simple assessment deliberately conservative.
p.s. The preferred standard for establishing regional climate expectations by the WMO member organisations has been the evaluation of the most recent 30 years of observations. However, they have been learning that rapid climate change requires different evaluations. What happened over the past 30 years in any region is no longer as reliable as it used to be for determining what to expect in the near future.
-
New study questions the accuracy of satellite atmospheric temperature estimates
CBDunkerson - The paper you mention is by Cowtan and Way (not Wray). The sheer variety of misspellings of the author names here and there has been amusing, but it's important to give proper credit.
-
Tristan at 00:46 AM on 11 November 20142014 SkS Weekly News Roundup #45B
Ashton, you weren't piling on (there's only one of you). It was a reminder to those responding to you that 'one at a time' tends to make for better conversation :)
Groupthink tends to occur in groups that share some ideological base. SkS is a 'broad church'. Some confuse the fact that most commenters here agree on the basics of the science (not necessarily the finer details) with the notion that we're a bunch of anti-market socialists. John Cook was not motivated by liberalism to create this website, but by his Christian ethos and feelings of personal responsibility towards his daughter.
Dissidence is not treated with contempt in science, it's celebrated. What is not celebrated is one-sided skepticism and refusal to acknowledge information contrary to one's position. -
Ashton at 23:50 PM on 10 November 20142014 SkS Weekly News Roundup #45B
Thanks scaddenp for your very civil reply at 46. It was much appreciated. I didn't think answering your question was "piling on" but perhaps I gave too much detail . I wonder if the moderators at Skeptical Science are in favour of epistemological homogeneity? I hope not as institutions are diminished when the conventional wisdom becomes entrenched, groupthink takes hold and dissident voices are treated with contempt. (quote is from Nick Cater in today's Australian).
Moderator Response:[JH] My friendly reminder about the prohibition against piling on was directed at the commenters who are responding to your posts.
-
CBDunkerson at 23:09 PM on 10 November 2014New study questions the accuracy of satellite atmospheric temperature estimates
Tristan, I was thinking of that Cowtan and Wray paper you link to also. I suspect you were referring to the fact that Cowtan & Wray used a kriging method (similar to what BEST did over land) to fill in the gaps between measured temperatures and that found that past SST records were biased low.
However, they also attempted to use satellite data to help fill in the gaps from surface measurements. What is interesting in relation to the new paper is that Cowtan & Wray found that combining the satellite and thermometer records worked well over land and ice... but not the oceans. When they tried it with the oceans they got significant mismatches. It would be interesting to see if the adjusted satellite calculations from Weng & co prove a better match if/when run through Cowtan & Wray's methodology... and/or how closely they line up with the results Cowtan & Wray got using kriging on surface readings.
-
Tristan at 21:27 PM on 10 November 2014New study questions the accuracy of satellite atmospheric temperature estimates
WRyan - I agree that the majority of the disparity in trends disappears once ENSO is accounted for, which, if the paper is correct, would lead to a rather scary conclusion. The SST records are biased low.
This is not a new idea I might add.
-
WRyan at 20:23 PM on 10 November 2014New study questions the accuracy of satellite atmospheric temperature estimates
The long term trends of the RSS and UAH global temperature records for the TLT altitude is basically the same as the long-term trend in the NOAA and GISS surface temperature records since the mid-1970s.
The 21-year running averages of all 4 data sets give pretty much identical warming trends of 0.14-0.15 C degrees per decade up until 2004. If that trend has continued over the past decade, then all 4 data sets are showing that the 2014 global temperature value will be pretty much on the trend line, which is what you would expect for an ENSO-neutral year.
The only real difference in the data sets is that the satellite monthly temperature data shows an exaggerated escalator effect. This results from the satellite measurements have a much larger (by about a factor of 2) response to El Nino and La Nina variations than the surface temperature data sets.
-
One Planet Only Forever at 12:54 PM on 10 November 20142014 SkS Weekly News Roundup #45C
wili @1,
The recent rapid rise of the global average surface temperature is likely to have made 'historical climate system patterns' less relevant ways of anticipating what is coming in the near future. That is one of the more unnerving aspects of the rapid changes being created by human activity. Historical pattern based information processing, like short term forecasting, may indeed struggle to accurately predict what will happen in the near future. Of course, climate models are built to reasonably predict the larger time scale trends, not what will happen next year. A significantly more complex model with far more detailed starting point data would be required to reasonably predict next year's regional climate system behaviours, and a lot more would need to be understood about the details of how the ocean circulation patterns change.
So, as for next year's El Nino, I would say it is 'wait and see'. As for a generally warmer global average surface temperature a few decades from now with even less certainty about the regional climate conditions to expect, that unfortunately seems to be a far more certain thing even though there will be increased understanding of the total integrated planetary climate system.
-
scaddenp at 11:51 AM on 10 November 20142014 SkS Weekly News Roundup #45B
Ashton - it looks like your response to me got deleted for offtopic. However, you can think of AGW much like Dr. You suspect the diagnosis, so run a huge battery of tests (eg does the outgoing LW have right signature for amount of CO2. You measure increased LW radiation at surface and does it match the spectrum and amplitude for CO2-induced radiation. Does the ocean warm at rate you would expect? You performs test against other possible causes - is incoming solar changing; is aerosols decreasing maybe; could it come from oceans (which would result in OHC loss) etc. Does it have the fingerprints of GHG warming?)
Like in medicine, you get the conformation from your tests but also like in medicine, you get those who dont like the answers (HIV deniers), want to make money (quack providers).
And in medicine, you get treatments offered which most certainly are not "beyond reasonable doubt" but for which the potential benefits outweigh the risks. In the current Ebola epidemic, you are seeing things tried which are not even shown to be safe, let alone effective.
-
Tristan at 05:01 AM on 10 November 20142014 SkS Weekly News Roundup #45C
Billion = 10^9 all over AFAIK.
In Australia and the UK at least, we changed from 10^12 to 10^9 in the 90s. -
ubrew12 at 02:41 AM on 10 November 20142014 SkS Weekly News Roundup #45C
I think the purpose of fossil-fuel bought elections is to give the American people a Congress that 'cares' about Global Warming, as the people do, but regrettably can't do anything about it, for a variety of reasons ('Terrorism' always works, 'Jobs and the Economy', 'China', 'Space Aliens', whatever works).
People like Inhofe are now instructed to keep their climate denial on the 'down low', hence the ubiquitous 'I am not a Scientist' when asked the inevitable question. The proper follow up to that response is 'Why do you need to be a Scientist to do policy? The Science has already spoken, its time for policy, and you're a policy-maker'.
-
ajki at 01:24 AM on 10 November 20142014 SkS Weekly News Roundup #45C
@Tristan, 4: "world GDP is 70 trillion"
I don't think that Lord Stern used Euro conversions at all. He spoke of Dollars in US-metrics. It was presumably phys.org that added a Euro conversion - but still in US-metrics (1 trillion = 1012).
A Central-european would use another metric when counting his or her Euros. So the actual GDP 2013 in Euro would be something around 60 billion Euro (1 billion = 1012). 60 trillion Euro (1 trillion = 1018) would actually mean something completely different. There is a slight difference between 1012 and 1018 ;-)
-
John Hartz at 00:40 AM on 10 November 20142014 SkS Weekly News Roundup #45B
[JH] Moderator's Comment
A friendly reminder: The SkS Commets Policy prohibits "piling on."
-
Firgoose at 21:48 PM on 9 November 20142014 SkS Weekly News Roundup #45B
Ashton: But I don't think the AGW proponents have proved their case beyond reasonable doubt.
Tom Curtis: "Beyond reasonable doubt" is a legal standard, not a scientific standard. It is certainly not in general a policy relevant standard. [.. Applied to] driving, it means we would not slow if we saw a vague, child like shape in the fog ahead of us.
Tom provides an interesting and compelling image. In this viewpoint, the reasonable doubt about the truth of "It is a child" provides justification for not taking action.
But if we change the statement to "It is not a child" then there's reasonable doubt about that and therefore cause to take avoiding action.
AGW is similar. For some it's not actually that vague, for others there's no fog, but surely nobody can say that it's not at least a vague, child-like shape in the fog ahead.
It's therefore not enough to claim that AGW proponents have not proved their case beyond reasonable doubt. As a doubter, you need to prove beyond reasonable doubt that AGW is not a collision in the fog ahead.
Ashton, do you accept that your reasonable doubt argument cuts both ways? Assuming that you are fair enough to say yes, do you then have sufficient scientific evidence to declare that the road ahead is clear - beyond reasonable doubt?
-
Tristan at 21:18 PM on 9 November 20142014 SkS Weekly News Roundup #45B
It's hard to tell the difference between willful and genuine ignorance, and hard to tell the level with which someone experiences cognitive dissonance. In any given debate, passionate proponents may knowingly disseminate dubious information, because they believe their opposition is doing the same thing.
It's not really possible to access a person's level of intellectual honesty, and not usually relelvant either. Misinformation is misinformation, regardless of intent. Accusations of dishonesty are, by-and-large unproductive.
I prefer to give people benefit of the doubt, and believe Upton Sinclair hit the nail when he said:
"It is difficult to get a man to understand something, when his salary depends upon his not understanding it!"
-
Tristan at 20:47 PM on 9 November 20142014 SkS Weekly News Roundup #45C
World investment in infrastructure over 15 years would indeed constitute a real awful amount of money. Consider that world GDP is 70 trillion right now, over the next 15 years we're talking over a quadrillion dollars of economic activity worldwide, with the expectation that 7% or so is spent on infrastructure.
-
ajki at 18:03 PM on 9 November 20142014 SkS Weekly News Roundup #45C
re.: "Climate economics expert urges "critical" investment shift", Phys.org, Nov 6, 2014
In the linked article:
"Stern estimated .... amount to some $90 trillion (73 trillion euros),..."
I think this should in fact be: "... $90 trillion (73 billion euros), ...". Otherwise it would be a real awful lot of money.
-
scaddenp at 16:19 PM on 9 November 20142014 SkS Weekly News Roundup #45B
Ashton, I do not claim that everything posted at WUWT may be nonsense but I would bet everything is a distortion of the truth. It obviously works since apparently you believe things that are not true ("it based on computer programming") and appear base your skepticism on it. The low integrity at WUWT to me would be a reason to avoid on principle. (How do feel about cyber-stalking of scientists blogging under pseudonyms while allow your own authors to post under pseudonyms?). Reading Jo Nova and Bishop Hill as well? Have you no respect for truth at all?
Troy Masters is example a true skeptic in my opinion, and I dont think Roy Spencer would make claims he knew we false even if I disagree with him. Jeff Id and Lucia's Blackboard are also passable in my opinion. Do yourself a favour and it might make the debate better informed.
I would be interested to know whether you only take actions suggested by your Dr if proved "beyond reasonable doubt". (Though I frankly think AGW is even if the precise climate sensitivity remains annoyingly hard to pin down).
-
Tom Curtis at 16:10 PM on 9 November 20142014 SkS Weekly News Roundup #45B
Two corrections for my post @43. First, when looking up the temperature difference between 1950 and 2010, I accidentally clicked on HadCRUT3 rather than HadCRUT4. The temperature difference should be 0.73 C for individual years, compared to the 0.6 C trend difference used by the IPCC. Second, when checking the trend difference in the SOI, I found it to have a very slight positive influence on temperature (0.7 Standard Deviations of the inverted 6 month lagged SOI index), which is approximately equivalent to a temperature differential of 0.07 C. Overall, temperature influences of major ocean oscillations are still demonstrably negligible so it makes not difference to the overall argument.
-
Tom Curtis at 10:29 AM on 9 November 20142014 SkS Weekly News Roundup #45B
Ashton @37:
1)
"But I don't think the AGW proponents have proved their case beyond reasonable doubt."
"Beyond reasonable doubt" is a legal standard, not a scientific standard. It is certainly not in general a policy relevant standard. "Beyond reasonable doubt" applied to tobacco smoke means we would still allow smoking in bars and restaurants. To driving, it means we would not slow if we saw a vague, child like shape in the fog ahead of us. It means the captains of ships would not attempt to evade icebergs until it was beyond reasonable doubt that they would hit it if they did not, and hence almost certain that they would hit it regardless if they did.
For policy decisions, governments act on balance of probability (when they do not act based on ideological blinkers). That is, in IPCC parlance, they act on evidence which is more likely than not. Nearly all IPCC conclusions are proved far more rigorously than that standard.
Having said that, the critics of the IPCC have had the hardest time coming up with reasonable doubts.
"A reasonable doubt is not an imaginary or frivolous doubt. It must not be based upon sympathy or prejudice. Rather, it is based on reason and common sense. It is logically derived from the evidence or absence of evidence have raised doubts by ignoring"
But the doubts raised by the pseudo-skeptics have been based on cherry picking data, ignoring the evidence and in general making every use of shyster tricks they can imagine to raise unreasonable doubts among those who find the thought of global warming to much to allow into their conception of the world.
An example of this is Ashton, who raises an unreasonable standard, and then applies it to all aspects of the theory of AGW without distinction.
2)
"This suggests natural forces do have an impact on global temperature. Who is right? Sci Am or SkS?"
And here Ashton gives an example of "unreasonable doubts". The Scientific American article did not say that natural forces have no impact on global temperatures. Only that those impacts summed to zero (or were indistinguishable from zero) for the period 1950-2010. In that they follow the IPCC exactly, who state (WG1 Chapter 10, Executive summary):
"GHGs contributed a global mean surface warming likely to be
between 0.5°C and 1.3°C over the period 1951–2010, with the
contributions from other anthropogenic forcings likely to be
between –0.6°C and 0.1°C, from natural forcings likely to be
between –0.1°C and 0.1°C, and from internal variability likely
to be between –0.1°C and 0.1°C."Note, "likely" (ie, 66% or greater probability), not "beyond reasonable doubt". The IPCC also states:
"It is extremely likely [95% or greater] that human activities caused more than half of the observed increase in GMST from 1951 to 2010."
And here is the actual Probability Density Function of that attribution based on Fig 10.5:

The reason this can be seen in an indicator of the major source of internal variability in temperature, the inverted SOI:
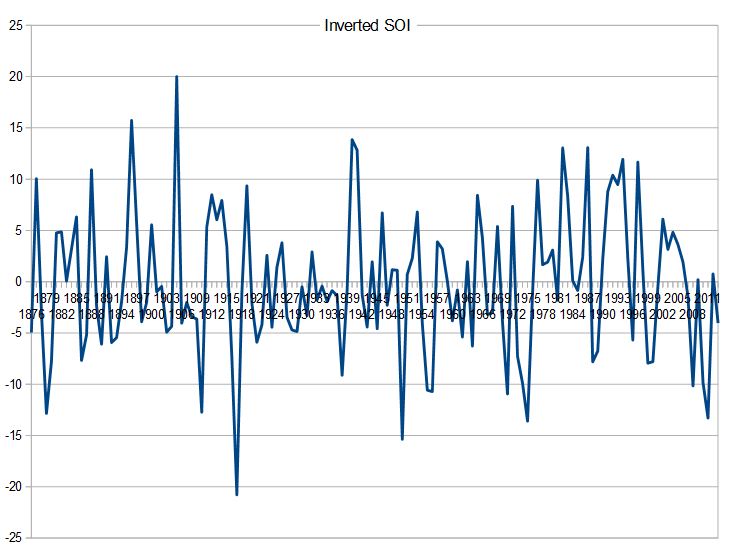
It must be born in that the IPCC is comparing differences in multi year averages of temperatures, not individual years. That is why they take the difference between 1950 and 2010 to be 0.6 C, not the actual (according to HadCRUT4) 1.01 C. And with that in mind, it is clear that the net ENSO effect on temperature differences between the two periods has been negative.
At the same time, the effects of the Atlantic Multidecadal Oscillation and Pacific Decadal Oscillation have been neutral between 1950-2010:
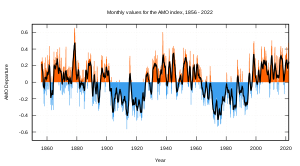

So, the Scientific American article, and the IPCC findings on which it is based do not assume that internal variability has no effect on temperature. Only that that effect between 1950 to 2010 (trend figures) are neglibly different from neutral.
-
michael sweet at 09:39 AM on 9 November 20142014 SkS Weekly News Roundup #45B
Ashton,
2014 was (perhaps?) the 15th warmest in England. For the entire Globe (we call it Global Warming) it was the warmest summer ever. See the August report of the Naitonal Climate Data Center. They say:
"The combined average global land and ocean surface temperature for the June–August period was also record high for this period, at 0.71°C (1.28°F) above the 20th century average of 16.4°C (61.5°F), beating the previous record set in 1998." (August was also the hottest ever recorded)
Since you did not qualify your claim it appeared you were claiming the Globe was 15th warmest. That claim is completely false.
WUWT is not an accurate source of information. I did not look to see what the temperature was in England.
We are also concerned with world grain harvests, not England alone. Yields will obviously be more negatively affected in warmer areas than in areas that are currently cold.
Comments like this indicate that you are very selective with the data you present. You are earning a reputation here. If you want to convince people your position is correct you need to get better citations.
-
billthefrog at 08:45 AM on 9 November 20142014 SkS Weekly News Roundup #45B
DSL @39 "He's got a message for you in the first sentence."
Tamino has also got an equally short and pithy message in the closing sentence of the article to which you refer!
Prev 648 649 650 651 652 653 654 655 656 657 658 659 660 661 662 663 Next


