


 Arguments


Recent Comments
Prev 649 650 651 652 653 654 655 656 657 658 659 660 661 662 663 664 Next
Comments 32801 to 32850:
-
One Planet Only Forever at 03:00 AM on 17 February 2015Climate Intervention Is Not a Replacement for Reducing Carbon Emissions
Pursuit of "Climate Intervention" is a misdirection of human intelligence and ingenuity. Investigating and reporting the consequences of such pursuits is a necessary activity, but is also a 'misdirection of effort' from the sustainable advancement of humanity, or any of its societies and civilizations.
The current social-economic-political systems places 'pursuit of profit and popularity' well above the 'meaningful advancement of understanding toward the development of a sustainable better future for all'. That misplaced prioritization is a fundamental fatal flaw. It can easily lead to 'profitable and popular' damaging and unsustainable actions by a sub-set of a given generation of humanity on this amazing planet, to the detriment of all others.
Humanity could have a 'brilliant sustainable constantly improving future for all life on this amazing planet'. It just needs the chance to effectively focus efforts on the pursuit of that type of development, without anyone getting away with hindering the progress. That will require diligent monitoring and actions to thwart the many unacceptable attempts at personal gain to the detriment of others that will be made by people who only care about themselves.
The solution to that challenge deserves significant attention. Until that issue is effectively dealt with any developed better understandings of what is going, and efforts to try to better understand what is going on, will be less effective than they need to be.
-
DSL at 02:43 AM on 17 February 2015Human CO2 is a tiny % of CO2 emissions
And Rickaroo, scientists aren't arguing from the correlation between the CO2 and temp graphs. Why would you? The physical mechanism of the greenhouse effect is extremely well-established--to the point of being instrumentally measured from the surface. If you want to make the argument you've claimed, you'll need to remove the greenhouse effect.
Temp does drive CO2, of course, because the warming oceans absorb less atmospheric C. The process is a feedback to initial and ongoing warming, though.
-
Rob Honeycutt at 02:13 AM on 17 February 2015Human CO2 is a tiny % of CO2 emissions
Rickeroo... A "cursory look" is not going to "clearly show" anything.
Another "cursory look" actually contradicts exactly what you're saying. If temperature were driving CO2 then why hasn't the atmospheric concentration of CO2 also "flatlined" over the past 15 years?
-
greg_laden at 01:41 AM on 17 February 2015Why the Miocene Matters (and doesn’t) Today
"There is a lot of time in deep time, so it is important to remember that a mismatch between 16.9 Ma and 16.8 Ma is roughly the amount of time that Homo sapiens has been a species."
This is a constanlty chaning number, but the minimal date for something we might call *Homo sapiens" is in the hundreds of thousands of years, not under 100,000. Fully modern (amHS) is close to 200K, but many would argue that "archaic" and amHS are all valid H. sapiens, and the dats for that are approaching 500K.
This may not seem relevant to the present discussion but it is simply the case that your statement needs to be changed to something like "There is a lot of time in deep time, so it is important to remember that a mismatch between 16.9 Ma and 16.8 Ma is roughly ofe third to one fifth of the amount of time that Homo sapiens has been a species."
-
Rickeroo at 00:48 AM on 17 February 2015Human CO2 is a tiny % of CO2 emissions
Tom Curits @265
30% of the current atmospheric concentration would not have been in the atmosphere without anthropogenic emissions.
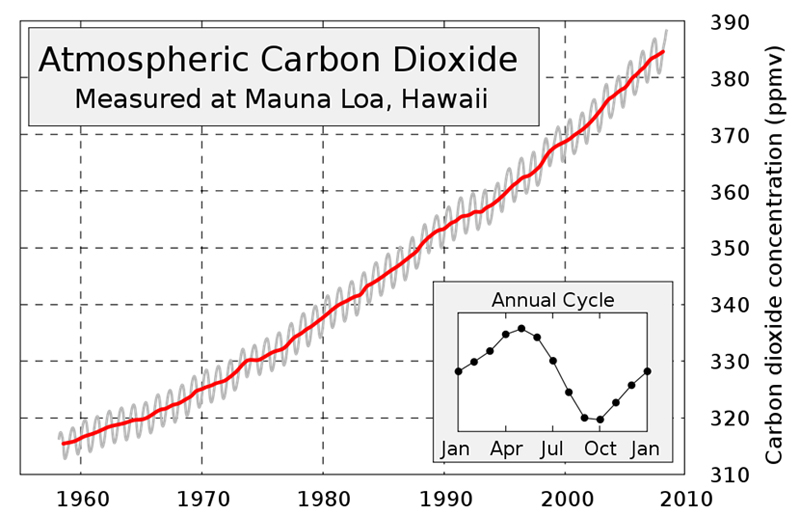
Any cursory look at two readily available data sets, Mauna Loa CO2 and global temperature by year, clearly shows that temperature is a strong driver in how much CO2 ends up in the atmosphere on a yearly basis. Note especially the 600% difference in 1992's and 1998's CO2, clearly based on temperature.
Also look at CO2 increase by year from 2000-2015, hardly changed at 2ppm per year despite a 68% increase in global emmisions over the same time period. Why isn't the rate of CO2 increase responding to human emissions? Because CO2 reponds far more to temperature, which has flatlined for 15 years.
Moderator Response:[Rob P] - Surface warming still continues.....

And the last 16 years has seen a 50.3% increase in heat taken up by the Earth's climate system than the previous 16 years. Which means there's a lot more warming in the pipeline. The following image is from the IPCC AR5 WG1 on the oceans.

-
Tom Curtis at 22:08 PM on 16 February 2015Newcomers, Start Here
cagwskeptic @245, was the medieval warm period as warm as, or warmer than temperature post 1998?
Moderator Response:[PS] This is an inappropriate thread for such a discussion. Till the poster can demonstrate something other than unsubstantiated sloganeering, then please do not engage.
-
cagwsceptic at 19:56 PM on 16 February 2015Newcomers, Start Here
There is no correlation between CO2 emissions and global warming. The two are not linked closely together as inferred by Mann's hockey stick graph. Co2 is driven into and out of the environment by global temperature rises and falls.
Moderator Response:[JH] You are skating on the thin ice of sloganeering which is prohibited by the SkS Commets Policy. In addition, you have provided no references to substantiate your assertions. Future posts of this nature will be summarily deleted.
-
Trevor_S at 19:54 PM on 16 February 2015Climate Intervention Is Not a Replacement for Reducing Carbon Emissions
There is no substitute for dramatic reductions in greenhouse gas emissions to mitigate the negative consequences of climate change
I hope you guys are all leading by example ? I know I have been keeping my emisons as low as I can: no flying for holidays, no driving, cut back on eating meat, no meat eating pets, use only renewable energy and only voting for politicans with effetive mitigation strategies ie The Greens... the low hanging fruit on the the emissions reduction tree. I do more than that but that's the minimum everyone needs to do to ensure we start mitigating effectively.
Moderator Response:[Rob P] - Not being a hypocrite is important but, apart from a feeling of superiority or smugness, your own personal measures aren't even remotely enough to stem the problem. Unless there is a worldwide mobilization to rapidly decarbonize the global economy all you're achieving is shuffling deck chairs on the Titanic. Having some perspective is important too.
-
jyyh at 16:19 PM on 16 February 2015Marotzke & Forster Respond to Nic Lewis
just checking the password still works. ok.
-
Tom Curtis at 10:34 AM on 16 February 2015The oceans are warming so fast, they keep breaking scientists' charts
Michael Sweet @54:
"The argument seems to me to be semantical. I am sure that if we discussed it we would agree."
I'm sure we would. I think, however, I was making a significant point. Two actually. First, that unsupported rubbish is easilly dismissed by any reasonable person. If they do not provide the nitty-gritty of their argument the correct assumption is that there is no nitty-gritty there, and that the argument is therefore baseless until they prove otherwise. It is one of the marks of rational discourse that when making claims, you back them with argument and evidence - not just assume they are right if the people with whom you broach the idea are inexpert enough (or properly dismissive enough, or just otherwise occupied) to not actually pick it apart in front of you. Only fools assume that the failure of others to disprove some vague idea means the idea is sound, let alone true.
With regard to your "skeptical" responses to my "killer arguments", I am sure that many "skeptics" would argue just as you suggest. In doing so they merely demonstrate that they are in fact "deniers", ie, that their objection to AGW is not rational, is not evidence based, and is really a flim-flam show. We can hope that onlookers will be rational enough to recognize that. There is no hope of the "skeptics" such as bindrdunit recognizing it, no matter how copious your evidence or meticulous your argument.
"You obviously read a lot of papers and have a terrific filing system."
I do. It is called Google ;)
-
michael sweet at 10:15 AM on 16 February 2015The oceans are warming so fast, they keep breaking scientists' charts
Tom,
The argument seems to me to be semantical. I am sure that if we discussed it we would agree.
As far as your three points, for point two the deniers argue that scientists have to provide evidence to prove any wild suggestion they can think of is incorrect. Deniers do not have to provide evidence.
For point three all deniers know that peer review is pal review so blog posts are the equivalent (or better) of peer reviewed articles. Why listen to experts when you can read a blog?
For point one Zeke Hausfather's graph you posted on another thread proves that scientists are conspiring to raise the land temperatures with their right hand while, at the same time, conspiring with their left hands to lower the ocean temperatures. It is obviously a very deep conspiracy or they could not keep the secret from their right hands!
It seems to me that Zeke's graph completely puts to bed any claims of tampering with the data by the adjustments made.
One of my main points is how time consuming and difficult it is to cite exactly the correct graph or paper to make your point. You obviously read a lot of papers and have a terrific filing system. It still takes a lot of time to make the detailed posts you provide. Thank you for all your effort, I have learned a lot from your posts. Both scientific information and how to frame a scientific argument. I read a lot here but rarely post because your posts are so good.
-
One Planet Only Forever at 05:11 AM on 16 February 2015Climate Intervention Is Not a Replacement for Reducing Carbon Emissions
"Climate Intervention" should not be deployed at any time.
Even at some future date it will be abused to excuse a lack of rapidly reducing the impacts of burning fossil fuels, particularly to excuse further delays by the most fortunate who refuse to give up any of the clearly illigitmate unsustainable and damaging ways of living they are addicted to getting away with.
"Attitude Intervention" to force the most callous pursuers of personal benefit to behave decently, or fail quickly and repeatedly, is the required intervention and adaptation.
The future of humanity is clearly at stake here. The threat is clear. And the interests of people who pose the greatest threat are also clear. Wasteful damaging unsustainable mass-consumerism must be curtailed, particularly by the most fortunate, if there is to be any chance of 'sustainable economic growth' and a future for humanity and advancing any of its civilizations.
People who are wealthy and powerful have no excuse. They canot calim to not be aware of this. All that is left is for such a person to admit they care and will change, including forcing change on the undeserving unwilling trouble-makers. And that is where the curret socio-economic-political system fails clearly fails. Many fully aware leaders deliberately mislead and can be popular because of their deliberate damaging deceptions.
That may seem harsh, but the irrational damaging global trade systems created in the past few decades are clearly causing a major part of the problem. In the current world of trade national sovereingty is limited by laws when 'free trade is impacted'. Yet the same people who will abuse those laws to their advantage will demand that national sovereignty must be respected when it comes to 'reluctance to act responsibly to reduce global human impacts'. Those unacceptable people will try to profit from 'climate intervention'. And there is little doubt that what they will push for will be as unsustainable and damaging as the global trade actions they try to profit from. They are clearly in need of "Attitude Intervention".
-
MA Rodger at 20:41 PM on 15 February 2015The oceans are warming so fast, they keep breaking scientists' charts
I would have thought the main derision to aim at bindrdunit @49 would be at his claim that " The greatest energy transfer component in oceans is not from GHGs, but from evaporation."
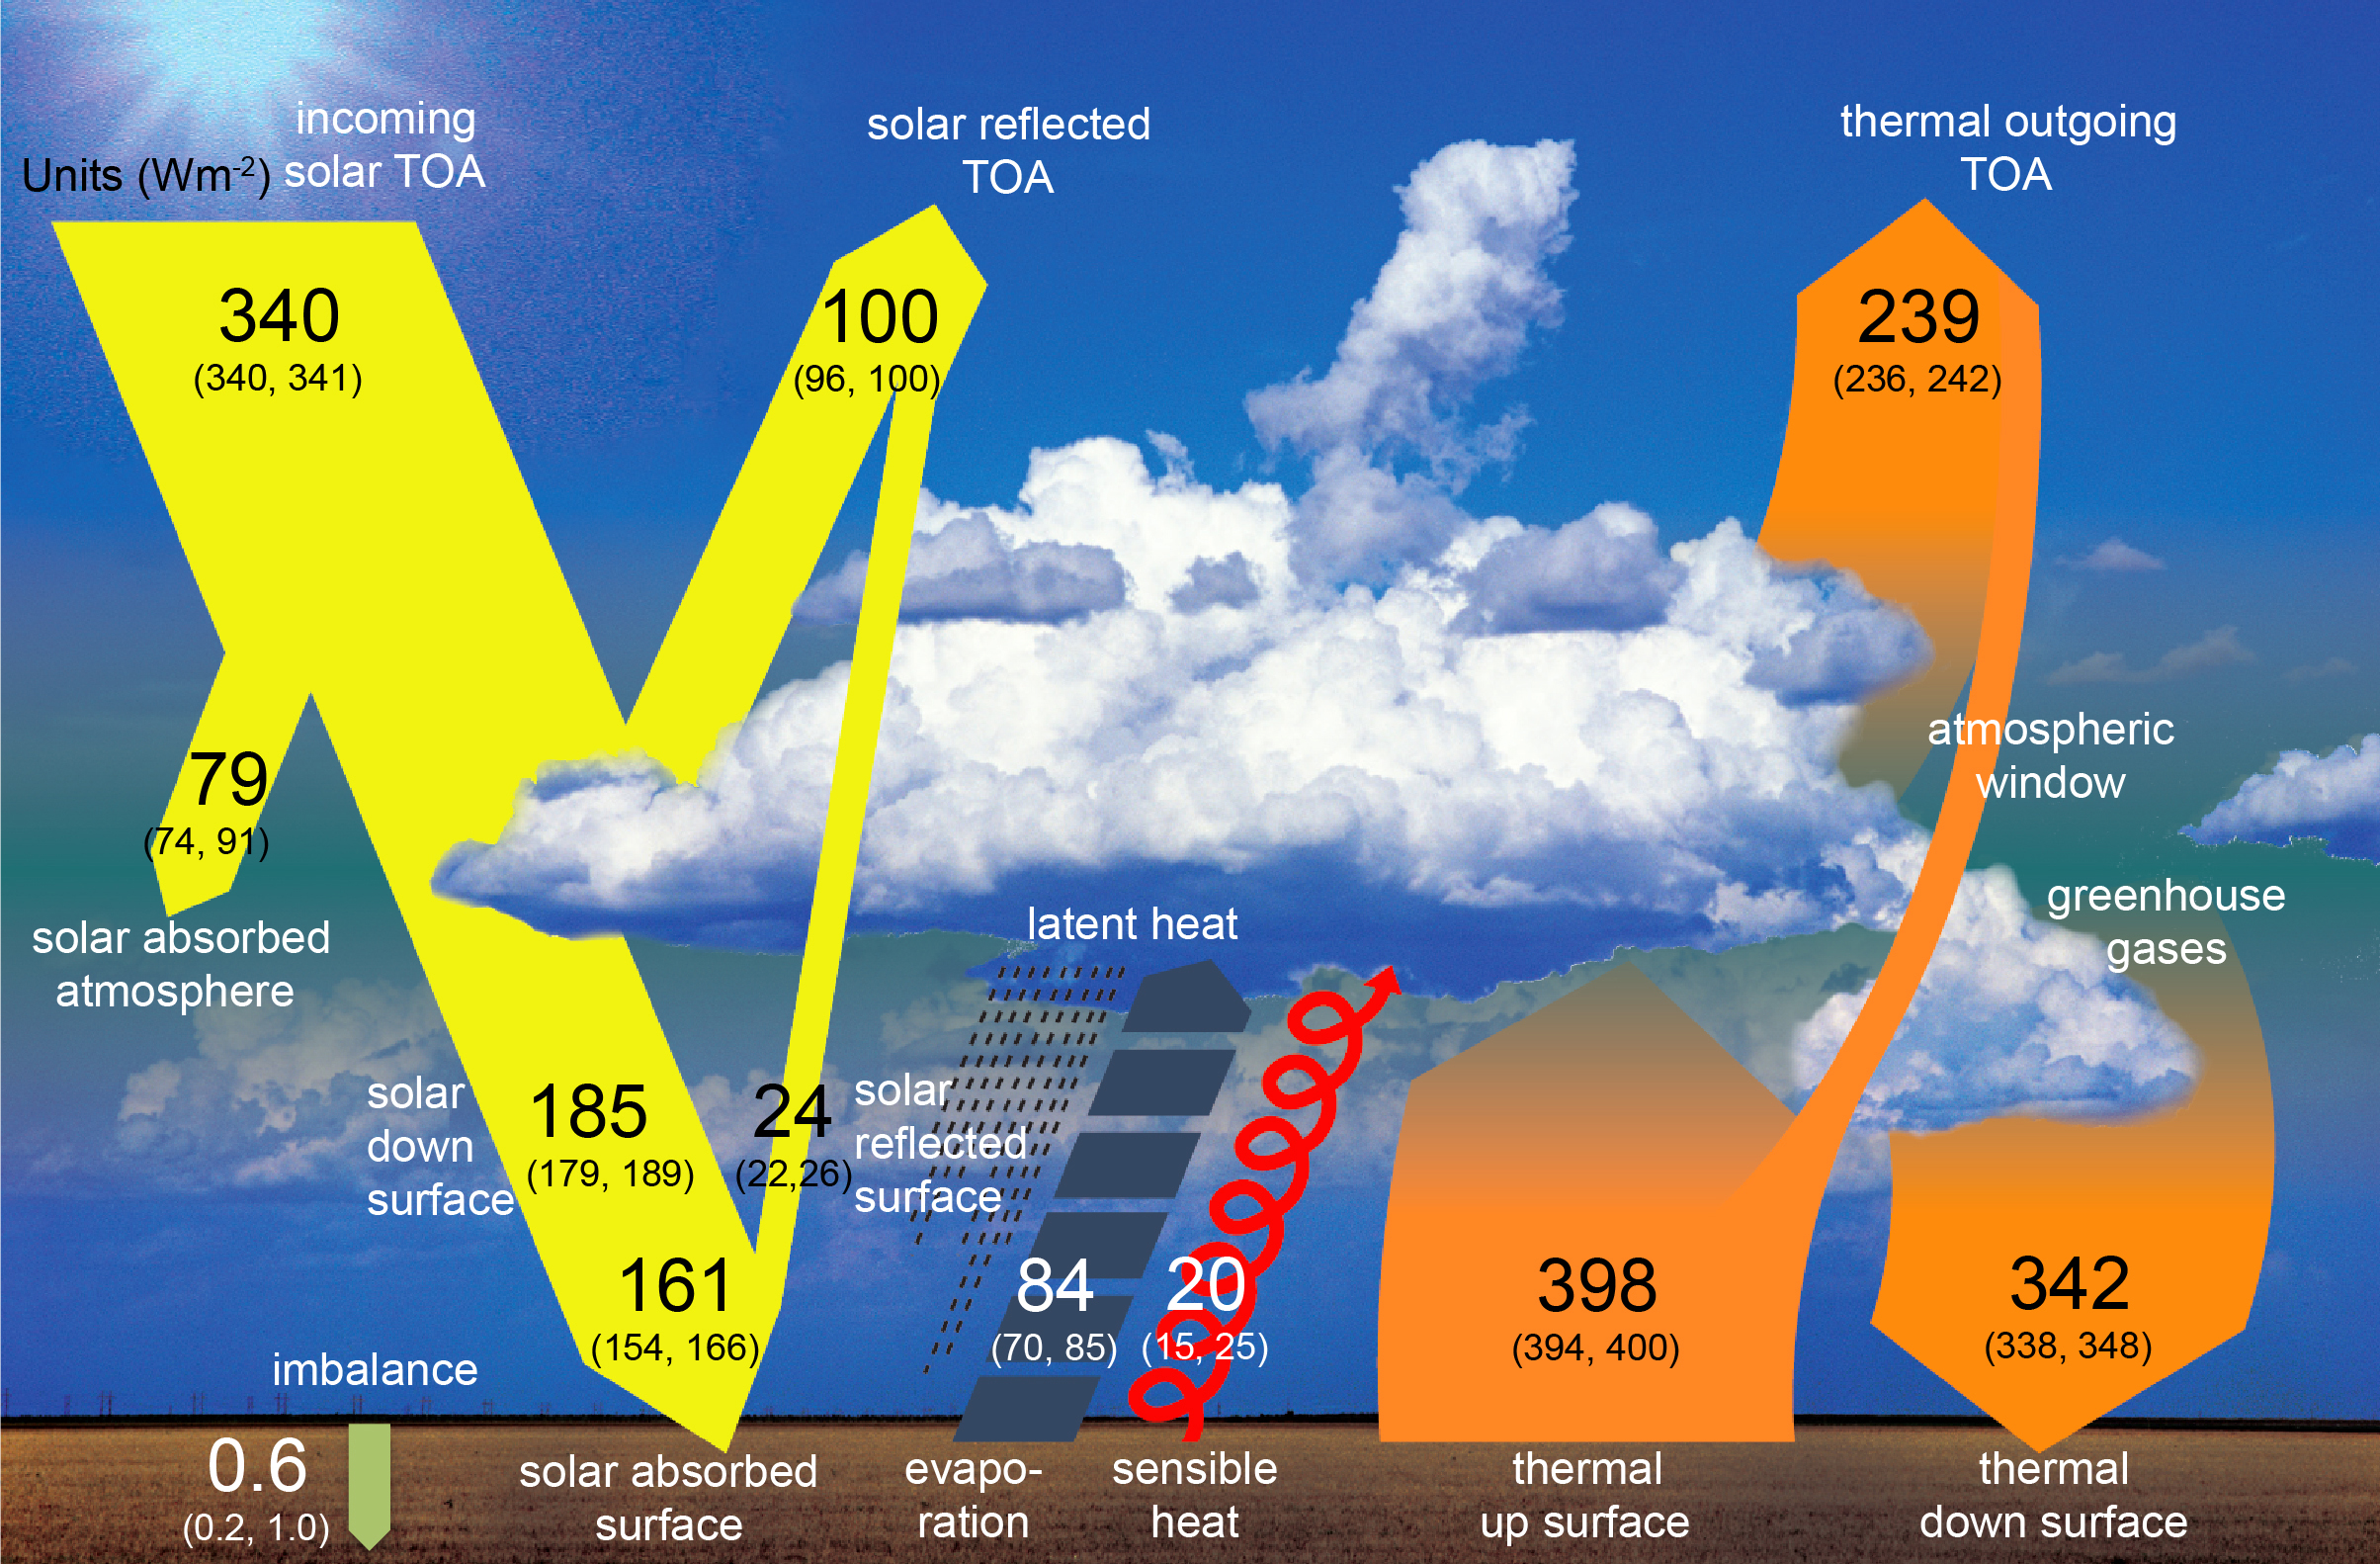
Evaporation can be measured quite reliably globally as the atmsosphere has a small capacity for accumulating water vapour and so the resulting rainfall, something easily and often measured, provides a global total, most of which will be evaporated from ocean sources. So (according to AR5 Figure 2.11) we are talking 84 / 0.71 = 118Wm-2(ocean). Back radiation over oceans is probably not greatly different from the global figure of 342Wm-2 which can be taken as a ballpark figure. Again this global average level for back radiationt is not difficult to estabish.
So what bindrdunit @49 is telling us that 118 > 342 which patently untrue.
Of course, bindrdunit @49 might have meant his words to be interpreted in a different fashion but if that is so, he should consider using different words, indeed those words whose meaning coincide with the meaning he wishes to convey. After all, that is what the rest of the human race generally manage to achieve.
Moderator Response:[JH] Please keep it civil.
-
Tom Curtis at 15:37 PM on 15 February 2015The oceans are warming so fast, they keep breaking scientists' charts
michael sweet @51, actually its fairly easy to argue against Bindrunit. The top, killer argument against his position is that science is not a conspiracy. As his theory requires global conspiracy by climate scientists, it therefore refutes itself. We can then move on to the second killer argument, that which is proposed without evidence can be dismissed without evidence. He provides no evidence so it is rightly dismissed. The third killer argument is, let's see it in peer review. The simple fact is that peer review is a process of testing your arguments against those who are best able to shoot them down. A person who will only advance their views on blogs, or in books or articles for the public therefore shows that they do not expect their arguments to survive criticisms from the well informed. We should therefore take their implicit confidence in their theory seriously, and assume as they implicitly do that their position would indeed fail a proper test.
We could also, of course, expand on the implications of his theory, eg, land should warm slower than the ocean as his mechanism only applies to the ocean, and implies a reduced energy transfer to the atmosphere, and show that they are simply contrary to the facts. Or the implication that the maximum warming in the ocean will be along shipping lanes rather than in the Arctic. (That one is a little trickier. I think the evidence is against him, but would need to do analysis to confirm it.)
Finally, we could simply refute his claim that all the forcings are simply made up. But I see no reason to put more effort into refuting his claim than he has in advancint it, so I will stick with the first thee killer arguments.
-
DSL at 07:45 AM on 15 February 20152015 SkS Weekly News Roundup #7B
GISS L-OTI is out for January: 0.75C — the second warmest January on record.
-
michael sweet at 22:08 PM on 14 February 2015The oceans are warming so fast, they keep breaking scientists' charts
Willi,
Bindrunit has provided us a stellar example of why cites are required for scientific discusssion. How could you discuss ocean warming with Bindrunit without using citations to show he/she is mistaken in their basic argument?
-
Tom Curtis at 16:33 PM on 14 February 2015A 23-year experiment finds surprising global warming impacts already underway
willi @15, here is one proposal. Treat it with caution as it has not been peer reviewed. They estimate a cost of 10 Euros per tonne of CO2 sequestered, but because they are trying to sell the idea, I would definitely treat that as an underestimate, but it is likely to be cheaper than carbon capture and storage. (It is, however, possible to use a variant of this technique to make CCS cheaper, and that may be a cheaper approach again.)
-
wili at 14:32 PM on 14 February 2015A 23-year experiment finds surprising global warming impacts already underway
"the most efficient way to remove CO2 from the atmosphere will likely involve accelerated chemical weathering by quarrying, crushing, then dumping suitable rocks in the ocean surface, so that we draw down atmospheric CO2 indirectly by drawing down oceanic CO2."
That's actually rather interesting. I hadn't thought about sequestration of ocean CO2 (basically of carbonic acid). Are there any proposals that have been made in that direction that you have links to? -
DSL at 13:30 PM on 14 February 2015The oceans are warming so fast, they keep breaking scientists' charts
Hey, bindrdunit, ya know, whatever you say. I know you have the research to back it up, so I'm not even going to call you on it.
Oh wait — yeah, yeah I am. Show your sources.
-
bindrdunit at 13:24 PM on 14 February 2015The oceans are warming so fast, they keep breaking scientists' charts
The strongest 'forcings' here are to make the hypothetical mechanisms fit the model which had already been decided upon. The greatest energy transfer component in oceans is not from GHGs, but from evaporation. The greatest impact from man's activities is the discharge of oil to the ocean's surface. Even a mono-molecular layer greatly inhibits evaporation. Keep the same solar energy input while reducing the major component of ocean heat loss, and water temperature increases, just like has been observed.
Moderator Response:[DB] Extraordinary claims require an extraordinary burden of proof for support. Please provide links to your source citations.
-
Bob Loblaw at 12:37 PM on 14 February 2015Fiddling with global warming conspiracy theories while Rome burns
Yes, Rob, I had noticed you missed muzz's little trick with the annual rates and was going to point it out, but Tom beat me to it. The division by 114 is why I had divided even further to get an hourly rate. Think of how insignificant the value would be if we converted to femtoseconds.
Anyway, I can't stay long. The winds are howling at over 30,000 furlongs per fortnight right now, and with all the snow blowing around I only have 3 or 4 kiloseconds to shovel snow before I go to bed. Almost no time at all! Gotta run!
[Ain't unit conversion fun?]
-
Rob Honeycutt at 11:49 AM on 14 February 2015Fiddling with global warming conspiracy theories while Rome burns
Tom... You're correct. I missed that he slipped from the total change over 114 years to an annual rate. Definitely too much time spent on Muzz's silliness.
-
scaddenp at 11:09 AM on 14 February 2015Why the Miocene Matters (and doesn’t) Today
I think you can get a understanding of relative storm frequency from appropriate paleo records. A storm surge can leave it's mark in grain size and salinity change in a sedimentary record from back-beach lagoons, esturies or low lying lakes. However, getting accurate dating from such a record gets tough outside the holocene.
Hurricanes are complicated. Warmer SSTs will breed storms but increase upper-level sheer decreases probability of hurricane forming. Which influence dominates?
-
Tom Curtis at 11:05 AM on 14 February 2015A 23-year experiment finds surprising global warming impacts already underway
wili @12, even after atmosphere/ocean quasi equilibrium is reached with regard to pCO2, the ocean will be a net sink for CO2 as the effect of chemical weathering occurs within the ocean. So, even at "equilibrium", oceanic outgassing is not a problem unless we artificially lower CO2 levels by removing CO2 from the atmosphere (at which point we need also to remove the excess from the ocean). Indeed, the most efficient way to remove CO2 from the atmosphere will likely involve accelerated chemical weathering by quarrying, crushing, then dumping suitable rocks in the ocean surface, so that we draw down atmospheric CO2 indirectly by drawing down oceanic CO2.
-
Tom Curtis at 10:35 AM on 14 February 2015Fiddling with global warming conspiracy theories while Rome burns
Rob Honeycutt @18, Muzz specified the growth in temperature per year over the last 114 years (1880-2014), for which he got the maths right. What he did not get right is the significance, or the relevant interval, or the fact that temperature increases will be faster in the future under BAU scenarios (indeed, has been over the recent past). All in all your comparison with body temperature above is the best resonse. After all, who would not go to a doctor with a fever of 41.9 C? Certainly we would not tough it out on the basis that it was only a 1.5% increase in our normal operating temperature.
Or keeping things climate related, since 1910, temperatures have increased by approx 6.7% of the range of temperatures experienced on Earth over the last 500 million years. Further, under BAU (RCP 6.0) we are projected to warm another 9.3 to 20.7% of that range in less than a century. An aggressive BAU policy (such as is currently being effectively pursued) has a significant risk of taking us to the upper limit of that range within a century.
-
sgbotsford at 07:44 AM on 14 February 2015Why the Miocene Matters (and doesn’t) Today
Can the frequency of major storms be deduced from the geologic record?
A surface temperature even a few degrees warmer would greatly enlarge those patches of ocean were T > 87 F, the critical temperature for growth of hurricanes. Larger patches should create more frequent large huricanes, but it's not clear to me if/how this would show up in the geologic record.
-
alby at 07:01 AM on 14 February 2015Why the Miocene Matters (and doesn’t) Today
Howardlee: thanks for the clear and honest reply.
And thanks also to the others for the interesting discussion.
Of course, like in other historical science, we cannot easily bypass the fact that only a fraction of the useful information coming from the past survives. Anyhow the scenario showed here with proper links sounds realistic.
-
mitch at 03:55 AM on 14 February 2015Why the Miocene Matters (and doesn’t) Today
Howardlee: I am not arguing whether the dating of the CRB is precise. It is very good. I am pointing out that the link between the start of the Miocene Climate Optimum and the Columbia River Basalts is a hypothesis, and that the offsets in timing are a major problem. The impact of the CO2 would be felt in 100 years or less, while it appears that the start of the MCO apparently leads the CRB by 200,000 years, which is significantly longer than a CO2 transient should last.
Problems--we may have errors of 100 kyr or more in the marine chronostratigraphy in the early Miocene, and we have to reconcile the K/Ar and stable isotope/paleomagnetic time scales. We should also hold in mind the alternate hypothesis, that the coincidence between CRB and MCO is just a coincidence not a forcing.
-
Rob Honeycutt at 03:12 AM on 14 February 2015Fiddling with global warming conspiracy theories while Rome burns
Not that it really matters, but just for setting the record straight, Muzz also buggers up simple math by two orders of magnitude: 0.8/288=0.0027 which is 0.27%. (Not 0.0024%)
-
ranyl at 02:29 AM on 14 February 2015A 23-year experiment finds surprising global warming impacts already underway
CO2 response to rapid removal Calderia
How much CO2 can oceans take up (Scripps)
Hi Wili,
An Interesting thing the oceans, also looking a Tom's dramatic graph see the scale is 1000's of years (deep oceans will eventually take CO2 out of atmosphere, not they did in the past when it was warmer!), and in the short time periods things are very slow, and as you say as the PCO2 atmosphere drops the oceans will start to off gas as will the terrestial sinks (CO2 fertilzation falls away again). And these models rely on intact ecosystems and plankton species to keep the bio-carbon-pump going yet they are suspectible to high CO2 as well. And warming temeprature do decrease the how much CO2 the ocean can absorb, and warming tends to cause warming shoaling of the sea water keeping the colder water below the surface and booth affects decrease ocean uptake and can make it offgas, the warm tropical waters already off-gas CO2, it is the cold waters the are the sinks, and aren't the polar regions warming quite rapidly.
And like you say permafrost releases, etc, etc, especially if CS higher than 3C and the Miocene blog this week,
" Even allowing for that, the fact that models need a sensitivity of 4°C per CO2 doubling to recreate Mid-Miocene warmth suggests that the modern value is more likely towards the upper end of the IPCC range of 1.5-4.5°C than the lower end."
LINK
And the (MacDougal et al. 2012), when CS was 4.5C despite complete cessation of emissions CO2, atmospheric CO2 rose and it does like CS is going to be on the high side as the evidence mounts up, and everyone just seems to be ignorign this paper where Pliocene average was ~275ppm;
"We reconstruct atmospheric pCO2 for the Pliocene (3.3 to 2.8 Ma) of ~270 ±40 ppm (2σ) similar to Pleistocene interglacials. We record little or no variability suggesting pCO2 was persistently at about Pleistocene interglacial values. Only at the outer bounds of our uncertainty envelope would we record Pleistocene glacial levels of pCO2. Uncertainty in our assumptions for productivity, SST and cell size all result in a broad uncertainty envelope around our preferred parameterization, with our best 396 estimate suggesting pCO2 was between ~ 230 and 300 ppm."
Badger M. et al (2013), High resolution alkenone palaeobarometry indicates relatively stable pCO2 during the Pliocene (3.3 to 2.8 Ma), Philosophical Transactions A,
WHat does that mean for CS, and having CO2e of 460ppm!!!!
Bottom line is the lags in the system mean we are going warm another ~0.7C whatever happens (remember the removal of the sulphur dioxide cooling umbrella if all fossil fuels stop being used, so there is definitive warming to come).
In all the geological records when planet warms CO2 is released and we are warming, so that is very likely to happen again, and a lot of release is from the oceans.
Also keep in mind if the CS is 4C, then all these policy maker advisorsory carbon budget papers, that use the raft of models where ~50% have a CS less lower than 3C, are ridiculously over optimistic, for all those models with a CS
It seems to me the everything is pointing to a CS of ~4-5C and that CO2 levels will rise even if all emissions are stopped today, and from the Calderia paper above, the only way to lower the CO2 in a time frame needed (80% heating in 100years according to Hansen), is not only to stop all emissions but alos actviely remove CO2 from th eatmosphere. Soberingly in the Calderia paper even taking put all of man's historic emissions and stopping all emissions (CO2 fell to 275ppm innediately), the equilibrium CO2 still rose to 360ppm, and that took 5000 years, and last CO2was 350ppm wsas the early Pliocene, a different world, totally different weather patterns, higher ocenas, much warmer Arctic and a warmer tropical warm pool (that will relase CO2 of course)...and could go on but how much prrof do people need to see that unless CO2 emissions are stopped immediately almost and the biosphere enhanced massively to help bring CO2 out of the atmopshere, then 2C and more is inevtiable and that means a totally new world (no human has ever experienced before) for those who surive.
And in the mean time flying is much more important!
-
wili at 01:38 AM on 14 February 2015A 23-year experiment finds surprising global warming impacts already underway
One more clarification (I hope) for now. It strikes me that the scenario that Tom's excellent source presents involves a sudden massive pulse of carbon. That will obviously give you a different value for how long it takes to get to atmosphere-ocean CO2 equilibrium than a scenario where all CO2 emissions stop immediately.
I would think that in the latter scenario, equilibrium would be reached much sooner than in the former, but sometimes these things behave in counterintuitive ways.
I would also think with ranyl, that increased water temperatures would also hasten the time it takes to reach equilibrium, but I imagine these models are taking that into account.
It all points up to me how even things as seemingly straight forward as determining when CO2 gets into equilibrium between water and air can end up being much more complex than one might think (similar to how complicated it is to determine something as seemingly simple as the melt rate of ice to figure when Arctic sea ice will (mostly) melt out).
Sorry if these ruminations are too rambling, and thanks again for the great links, especially the Tom's piece by Archer et alia.
-
wili at 23:22 PM on 13 February 2015A 23-year experiment finds surprising global warming impacts already underway
Thanks, michael and Tom.
Tom, you claimed: "if we were to cease all anthropogenic CO2 emissions, then the ocean would absorb more CO2 for about 300 years, reducing the atmospheric CO2."
The first part of this statement is exactly what I meant by "once equilibrium is reached." It is interesting to know that this point would be reached, in an artificial model with no other carbon input, in about 300 years.
But we aren't living in an artificial model. Permafrost carbon, at least, will continue to be released for a long time (MacDougal et al. 2012), and other carbon feedbacks are likely to kick in as well. I guess the 'good' news of that is that this will mean that the oceans would absorb atmospheric carbon for even longer, presumably.
I confess that I was thinking of the equally artificial scenario that michael's citation discusses, particularly in light of the NRC report on 'Climate Intervention' (on which see here ). As we develop ways to extract CO2 from the atmosphere, even if we figured how to do it all in one fell swoop, we would then have to continue to deal with the CO2 the oceans would then offgas.
One thing I did definitely overlook was the effect that a more acidic ocean would have on disolving which will allow the oceans to disolve more CO2, though at a terrible price.
"Second, the more acidic water is, the better it dissolves calcium carbonate. In the long run, this reaction will allow the ocean to soak up excess carbon dioxide because more acidic water will dissolve more rock, release more carbonate ions, and increase the ocean’s capacity to absorb carbon dioxide. In the meantime, though, more acidic water will dissolve the carbonate shells of marine organisms, making them pitted and weak."
-
Tom Curtis at 22:41 PM on 13 February 2015A 23-year experiment finds surprising global warming impacts already underway
Willi @8, your original claim is ambiguous, and on its most natural interpretation, is wrong. Specifically, if we were to cease all anthropogenic CO2 emissions, then the ocean would absorb more CO2 for about 300 years, reducing the atmospheric CO2. Rather than outgassing, it would be ingassing. After that, slower processes of will continue to reduce CO2 levels, but at a much slower rate. Overall, it will take tens to hundreds of thousands of years to reduce the CO2 level back to preindustrial levels. Here is a graph from 2008 showing the major processes, and approximate timescales:

This process is shown be essentially all carbon models, although they vary slightly as to rate.
Note, the models introduce the full anthropogenic load of CO2 in single pulse (ie, over one year), resulting in initial values of atmospheric concentration higher than have in fact been seen. An earlier study (referenced here) used an earlier version of the Berner model to calculate the rate of reduction. Integrating that rate with known fossil emissions showed a rate of CO2 rise comparable to the observed. The initial take down that has already occured is inconsequential, however, for the long draw down.
One point that does need to be noted is that these models also assume zero further emissions. Emissions as low as 5-10% of current values will prevent the reduction of the CO2 concentration in the short term, and will lead to a gradual rise in CO2 in the long term.
Finally, Michael Sweet's citation discusses the case in which all excess CO2 is removed from the atmosphere. If, with CO2 raised to 500 ppmv, we reduce CO2 back to 280 ppmv (by a wave our our wand), then outgassing will occur, restoring CO2 levels back to about a quarter of the peak excess (ie, to about 340 ppmv).
-
Miriam O'Brien (Sou) at 22:03 PM on 13 February 2015Upcoming MOOC makes sense of climate science denial
SteveS - enrol is the accepted spelling probably everywhere outside of the USA.
This course looks like it will be very useful.
-
michael sweet at 21:00 PM on 13 February 2015A 23-year experiment finds surprising global warming impacts already underway
Wili,
Here is a cite that supports your claim about ocean outgassing. It was easy to Google. It is expected in scientific discussion to produce cites to support your argument. The moderator would be biased if he only asked skeptics to support their position. It is very time consuming to find cites for all your claims. The long posts that Tom and a few others make, with lots of cites, take a lot of work.
-
ryland at 18:45 PM on 13 February 2015Fiddling with global warming conspiracy theories while Rome burns
Sincere apologies for this. My opening line in the comment above should read "might give Muzz further perspective on global average temperature".
-
ryland at 18:41 PM on 13 February 2015Fiddling with global warming conspiracy theories while Rome burns
This precis on The Modern Temperature from the American Institute of Physics (http://www.aip.org/history/climate/20ctrend.htm) might give Muzz further perspective onf global warming.
"Tracking the world's average temperature from the late 19th century, people in the 1930s realized there had been a pronounced warming trend. During the 1960s, weather experts found that over the past couple of decades the trend had shifted to cooling. With a new awareness that climate could change in serious ways, in the early 1970s some scientists predicted a continued gradual cooling, perhaps a phase of a long natural cycle or perhaps caused by human pollution of the atmosphere with smog and dust. Others insisted that the effects of such pollution were temporary, and humanity's emission of greenhouse gases would bring warming over the long run. All of them agreed that their knowledge was primitive and any prediction was guesswork. But understanding of the climate system was advancing swiftly. The view that warming must dominate won out in the late 1970s as it became clear that the cooling spell (mainly a Northern Hemisphere effect) had indeed been a temporary distraction. When the rise continued into the 21st century, penetrating even into the ocean depths, scientists recognized that it signaled a profound change in the climate system. Nothing like it had been seen for centuries, and probably not for millennia. The specific pattern of changes, revealed in objects ranging from ship logs to ice caps to tree rings, closely matched the predicted effects of greenhouse gas emissions.
-
ryland at 18:24 PM on 13 February 2015Fiddling with global warming conspiracy theories while Rome burns
[PS] I'm not sure what you mean by "One assumes this stunt from misinformation site" in the context of your reply. I don't know where Muzz actually did get his data from but the site I referred to appears to be a genuine NASA site and I assumed that the information was correct. Are you saying it isn't? Of course if it is correct and at the moment I can't see why it isn't, then the first sentence from Muzz @ 8 is also correct. My post, with the caveat that the site is genuine, also gave what appears to be an answer to moderator JH also at 8.
Moderator Response:[JH] Huh?
[PS] We are mis-communicating. [JH] asked Muzz to cite the bizarre calculation of 0.0024% which clearly was not NASA. I have no doubts about the actual NASA data, only the spin being used to try and sweep the problem under the carpet.
-
wili at 16:53 PM on 13 February 2015A 23-year experiment finds surprising global warming impacts already underway
I wrote: "Once equilibrium is reached, offgassing from the oceans will keep atmopsheric CO2 levels high for thousands of years, at least."
To which the Moderator Response was:"[JH] Please provide a citation for your concluding statement. Thank you."
OK, I guess you got me. I guess I picked up this impression from lots of different places, but I'd be happy to be corrected. I kind of assumed that it would take a very long time for the ocean to 'let go' of its extra carbon content back into the atmosphere. Especially since the only major 'sink' will be rock weathering, that takes a very, very long time. I'm thinking, for one, about the time scale graph just posted here.
But then I seem to have a knack for totally misunderstanding the most stunningly obvious of graphs, charts and elementary science. So please do illucidate if I am straying far from the fold, here.
-
ryland at 16:51 PM on 13 February 2015Fiddling with global warming conspiracy theories while Rome burns
Muzz may have got his information from GISS
"The average temperature in 2013 was 14.6 °C (58.3 °F), which is 0.6 °C (1.1 °F) warmer than the mid-20th century baseline. The average global temperature has risen about 0.8 °C (1.4 °F) since 1880, according to the latest (January 2014) analysis from NASA's Goddard Institute for Space Studies (GISS). Exact rankings for individual years are sensitive to data inputs and analysis methods. (http://climate.nasa.gov/climate_resources/28/)
Moderator Response:[PS] Expressing temperature change as percentage change against absolute temperature is pure sloganeering. The stunt is to make it seem so small that "must be insignificant". One assumes this stunt from misinformation site. Like claiming that 400ppm is too insignificant to worry about neglecting that that concentration of say HCN would be far from insignificant to life. To make sense of the number you have to look at what the effects of the change would actually be. Plenty of real science of that.
-
chriskoz at 14:50 PM on 13 February 2015Why the Miocene Matters (and doesn’t) Today
Howard@10,
Thawnks, that makes sense now. With Isthmus of Panama wide open at the time of Miocene, ocean circulation was quite different in E Pacific, so we could see such T departure in this region.
BTW, very interesting article, and Zhang et 2013 is a must read for anyone interested in paleo & climate models. It confirms that ECS derived from paleo data, especially from Miocene, is much higher than from today's observed warming. Thanks for describing it to us from behind the paywall.
-
howardlee at 14:16 PM on 13 February 2015Why the Miocene Matters (and doesn’t) Today
Sidd - there's been much written on equable climates - Bill Ruddiman has covered the subject in his books also. Kidder & Worsley's 2012 paper: A human-induced hothouse climate? is another one I recommend. What is new is the ability of models to simulate the equable climate sucessfully now, because of increased sensitivity and much better cloud handling.
-
Tom Curtis at 14:02 PM on 13 February 2015Fiddling with global warming conspiracy theories while Rome burns
PS inline at 12, everytime we see a moderator saying "DNFTT", what we should be seeing is the moderator deleting the post in which the troll trolled. In this instance, Muzz has clearly violated the rule against no sloganeering. He's also going for broke on excessive repetition as well.
Moderator Response:[PS] I had deleted a post which was more trolling and I put my comment on an earlier one.
-
howardlee at 14:00 PM on 13 February 2015Why the Miocene Matters (and doesn’t) Today
Chriskoz: from the Zhang et al paper: "For example, subtropical east Pacific (ODP 1010) and northeast Pacific (ODP 1021) have been found to be at least 12◦C warmer at 12Ma relative to today, and 5◦C warmer relative to the Early Pliocene." So that is from 2 locations in the eastern Pacific, at a time after the MMCO but still in the Miocene. The "3 degree warmer" refers to the Pliocene, 7 million years later, a cooler time with lower CO2 levels.
-
Rob Honeycutt at 11:06 AM on 13 February 2015Fiddling with global warming conspiracy theories while Rome burns
Muzz... did you know if your body temp rises by 1.6% K... You're dead.
You're making a very silly argument.
Moderator Response:[PS] I would suggest DNFTT given Muzz's past disinterest in actual science.
-
Muzz at 10:25 AM on 13 February 2015Fiddling with global warming conspiracy theories while Rome burns
In reply to JH moderator response to 8. 0.85C from 1880 to 2012 IPCC 2013 is a source.
-
Muzz at 09:53 AM on 13 February 2015Fiddling with global warming conspiracy theories while Rome burns
To JH moderator response to 8. I cannot readily recall where I read 0.8C over 114 years but I do note that the temp escalator graph on this site shows an increase of 0.16C per decade which gives a result of 0.0056%. Yes, that is significantly greater than 0.0024% but is still miniscule.
Moderator Response:[JH] You're skating on the thin ice of concern trolling. Please cease and desist.
-
Bob Loblaw at 09:34 AM on 13 February 2015Fiddling with global warming conspiracy theories while Rome burns
Muzz: if you want to distort things, you are much better off doing it graphically. I suggest reading the following excellent blog source to learn how to do it. Dr. Inferno provides some excellent posts you would do well to emulate.
...but if you are going to stick exclusively to a mathematical calculation why stop at an annual rate? If you turn it into an hourly rate, it's only 0.00000028%!
Or, if you are actually interested in learning something, you could try:
Human CO2 is a tiny % of CO2 emissions
to see how using arguments based on such percentages is not good science.
-
Muzz at 09:02 AM on 13 February 2015Fiddling with global warming conspiracy theories while Rome burns
I have read that earths temp has increased by 0.8C over the last 114 yrs. Assuming earth ave temp of 288K I calculate the annual rate of temp increase to be about 0.0024%. I must be wrong because 0.0024% is miniscule, nothing to be alarmed about
Moderator Response:[JH] Please docment the sources of your data. Thank you.
-
chriskoz at 07:29 AM on 13 February 2015Why the Miocene Matters (and doesn’t) Today
Going further back into the Miocene, tropical sea surface temperatures were as much as 12°C warmer at 12 million years ago, with CO2 levels similar to today
I don't understand the feasibility of that assessment. The abstract of Zhang et 2013 you link to, explains the MMCO event, but does not say anything about such extremely high temperature in tropical waters.If the average temperature were some 3degree higher globally and higher in arctic due to the amplificaton, how could it be "12°C warmer" in the tropical ocean? That does not make sense, unless such warmth be confined to a small, local site only.
Prev 649 650 651 652 653 654 655 656 657 658 659 660 661 662 663 664 Next


