


 Arguments


Recent Comments
Prev 650 651 652 653 654 655 656 657 658 659 660 661 662 663 664 665 Next
Comments 32851 to 32900:
-
sidd at 07:16 AM on 13 February 2015Why the Miocene Matters (and doesn’t) Today
Thanx for the reference to the Bond and Wignall paper. I was rather surprised to see that no mention was made of the Kidder and Worsley papers on equable climates. -
howardlee at 06:30 AM on 13 February 2015Why the Miocene Matters (and doesn’t) Today
Mitch - there is a distinct pattern of environmental effects generated by these Large Igneous Provinces that is repeated across geological time. Very precise dating has been achieved for the Permian, Triassic and Cretaceous LIP events, and more are added all the time (eg the mid-Cambrian). Bond and Wignall have a very good review of the evidence.
The dating precision for the Columbia River Basalts is pretty good from a geological point of view but it could be better for the initial phase of the eruptions for comparing to the marine record. Most of the precise dating in other provinces has come from high resolution U-Pb zircon dating but I haven't seen that for the Columbia River province yet. Some of the uncertainty is also in the marine record dating. I agree - again - that more research is needed, but the temporal link is very close given the span of deep time.
-
howardlee at 06:05 AM on 13 February 2015Why the Miocene Matters (and doesn’t) Today
Wili - I was caught out the same way by that graph initially! For modern emissions I just took the IPCC figures - roughly - from the graph I linked to. Yes, to allow for the mass of the oxygen in CO2 vs C you multiply by 3.67 as you say.
-
howardlee at 05:53 AM on 13 February 2015Why the Miocene Matters (and doesn’t) Today
Alby - the short and honest answer is: it's not clear. Those data come from Zhang et al 2013, who attribute part of the CO2 spike at that time (~ 30 million years ago) to the fact that the drill site was at the equator, so experienced a: "convergence of trade winds drives upwelling of CO2-rich deep waters" - but they point out that can't be the whole answer. In other words, part of that spike is just a local effect, but not all.
The radiative forcing increase from 700 to 900 ppm would be roughly 1.3Wm-2 - around the same as for the Miocene, but since some of the apparent CO2 signal is local, the real value would have be less. The main eruptive phase of the Afro-Arabian LIP was around 30 million years ago followed by protracted eruptions for around another 5 years, so it's possible that it didn't have as large an effect on CO2 as the graph above implies. The temperature data do show strong Oligocene warming but that is somewhat after the CO2 spike in the graph. I will say that there doesn't seem to be anything like the literature on the ~30 million year time period compared to earlier - the Eocene-Olicocene transition, or later - the Miocene. More research is needed!
-
wili at 04:57 AM on 13 February 2015Why the Miocene Matters (and doesn’t) Today
Oops, nevermind. I see that in the linked graph the CO2 emissions are measured (slightly counterintuitively, I might say) in Gt carbon!
So we have so far emitted about 1835 Gt of CO2 so far!? (=500 x 3.67)
-
wili at 04:51 AM on 13 February 2015Why the Miocene Matters (and doesn’t) Today
In the second paragraph after the map, you have: "range of possibilities from 230 to 6,200 Gt of carbon (compared to about 500 Gt emitted by humans to date, projected to be 1,500 to over 2,000 Gt by the end of the century)."
The linked graph suggests that the parenthetic (current and end-of century) amounts should be Gt CO2, not Gt carbon. That leaves me wondering if the Miocene values were also supposed to be CO2 rather than carbon. Or perhaps I'm missing something?
-
mitch at 03:45 AM on 13 February 2015Why the Miocene Matters (and doesn’t) Today
The potential link is very interesting but there needs to be significantly more research about the Miocene climate optimum and Columbia River Basalts. There is a lot of time in deep time, so it is important to remember that a mismatch between 16.9 Ma and 16.8 Ma is roughly the amount of time that Homo sapiens has been a species.
-
John Hartz at 02:37 AM on 13 February 2015Fiddling with global warming conspiracy theories while Rome burns
Recommended supplemental reading:
Evil Nazi-communist world-government climatologists have manipulated data to REDUCE global warming by Victor Venema, Variable Variability, Feb 10, 2015
Moderator Response:[GT] Typo corrected - Victor's surname is Venema
[JH] Thank you, GT.
-
alby at 02:10 AM on 13 February 2015Why the Miocene Matters (and doesn’t) Today
Why, looking at the fist graph, it seems quite clear that at time of Afro-Arba Lip the spike on CO2 levels (from roughly 700 ppm up to 900 and then again to 700 or less) had a significantly smaller effect on the temperature trend comparing to the bump on MMCO?
-
shoyemore at 17:40 PM on 12 February 2015Fiddling with global warming conspiracy theories while Rome burns
Journalist George Monbiot on Christopher Booker:
"The Wikipedia of Gibberish, the patron saint of charlatans"
-
chriskoz at 11:55 AM on 12 February 20152015 SkS Weekly News Roundup #7A
Indeed, news are coming very fast this week, e.g.:
US Congress approves Keystone XL pipeline, defies Obama
Just couple hours ago. Self explanatory title.
-
Bob Loblaw at 11:37 AM on 12 February 2015Fiddling with global warming conspiracy theories while Rome burns
I agree with dana and Phillippe: focus on the argument, not the person. Amateurs can and do contribute to science, but the worth of their contribution is a property of their contribution, not their background.
Bob Grumbine has a recent blog post about Amateurs on Climate that is worth a read.
-
Tom Dayton at 11:27 AM on 12 February 2015Fiddling with global warming conspiracy theories while Rome burns
RealClimate's new post uses actual data to show Homewood/Booker claims in The Telegraph are...
-
PhilippeChantreau at 09:28 AM on 12 February 2015Fiddling with global warming conspiracy theories while Rome burns
Attacking one's credibility would come close to a logical fallacy. How learned one is in the science is an indicator of how likely it is that their opinion may be interesting/relevant/on point etc. It also gives a likelihood on how valid a specific argument is, but the particular argument considered must nonetheless be considered on its own merit, or lack thereof in this case.
-
dana1981 at 07:41 AM on 12 February 2015Fiddling with global warming conspiracy theories while Rome burns
I don't see any need to attack Homewood's credibility when the arguments themselves are transparently wrong. The fault is Booker's for swallowing the horse manure that Homewood fed to him.
-
Lloyd Flack at 06:51 AM on 12 February 2015Kevin Cowtan Debunks Christopher Booker's Temperature Conspiracy Theory
I can show him up. There are others there that want to beleve the denialists are rightb but who will reluctantly accept facts. He is a lost case.
-
McMeatFace53 at 04:26 AM on 12 February 2015Fiddling with global warming conspiracy theories while Rome burns
Great post dana1981. Extremely informative.
Just to comment about the Christopher Booker article, he references a person by the name of Paul Homewood. I believe this is the same Paul Homewood who is a retired accountant and has no formalized training in the climate change realm. My question is why has nobody attacked this person's credibility in providing key stats to Christopher Booker's article? Paul Homewood has no advanced degrees, no formalized training, has no peer reviewed articles (that we know of), but the deniers take these findings as gospel. It is the equivalent of someone who is a stock broker, but reads articles on Web MD. Does that make the stock broker an expert in the medical field versus someone who has been in medical school for an extensive amount of time? Should that person be allowed to prescribe medication? This source would be crucified if this was under circumstances.
-
witsendnj at 00:37 AM on 12 February 2015A 23-year experiment finds surprising global warming impacts already underway
"We were actually very surprised to see such dramatic changes in the control plots." It's very well known that tropospheric ozone is highly toxic to vegetation and that as background levels rise, there will be a species shift in the ecosystem because some plants are more sensitive than others. That is what is occurring everywhere on earth. It shouldn't be a surprise. The reason the EPA has been (unsuccessfuly so far) trying to enact stricter legislation to lower acceptable levels of ozone is to protect the biosphere, because they have determined after reviewing the scientific literature that damage to trees is cumulative. This is a massive amplifying feedback for climate change, as a major carbon sink is being lost, as well as other knock-off effects such as changes in precipitation and of course, habitat and food for dependent species. See links at http://scienceblogs.com/gregladen/2013/01/29/whispers-from-the-ghosting-trees/
-
wili at 23:02 PM on 11 February 20152015 SkS Weekly News Roundup #7A
Oh, and Climate Central, too: Geoengineering ... Solutions Not Ready
Moderator Response:[JH] Please note the sixth article listed in the OP.
-
wili at 22:55 PM on 11 February 20152015 SkS Weekly News Roundup #7A
Thanks for these, but I still think you're missing a big story by not covering the National Academy of Science's two-part report on geo-engineering. Lots of other venues are covering it:
US scientists say 'climate intervention' strategies are unlikely to work
Report: Don’t Try to Block the Sun to Fix Climate Change
Anti-‘Geoengineering’ National Academy Report Opposes ‘Climate-Altering Deployment’
Moderator Response:[JH] Patience is a virtue. This story will be covered in the next edition of the News Roundup. By design, I have limited the number of articles covered in a single edition to 15. There's a lot of news popping up this week and they all cannot be covered unless I were to produce a daily news roundup. Doing so would require me to devote 8-12 hours per day on SkS related activites and I simply cannot do that.
-
Robert Murphy at 21:22 PM on 11 February 2015Kevin Cowtan Debunks Christopher Booker's Temperature Conspiracy Theory
Lloyd, do you really think midnight is going to see his error (I've been following the posts at DC). He thinks that temp series are adjusted to predetermined GCM output, that the greenhouse effect is negated because Boyle's Law, and that LR radiation can't warm the oceans. He's completely convinced of his superior knownledge (about everything) and will never, ever admit a mistake. He's in complete denial. He isn't interested in undestanding how adjustments are made. He already "knows".
-
Klapper at 20:01 PM on 11 February 2015Claims that climate models overestimate warming are 'unfounded', study shows
"...The authors don't rule out a minor contribution from some models underestimating cooling from volcanic eruptions..."
That's either incorrect, or highly misleading, or a typo (he meant overestimating not underestimating). Look at the model to observation trend difference for the 15 year trends starting in 1992 in the above trend comparison graph (1992 is the approximate maximum cooling effect of Pinatubo). Those trends are much warmer in the models than the observations.
In the models there is an all time peak in the warming rate for trends starting approximately 1992. This would indicate the models (or most of them anyway) have overcooled the late 1991 to 1994 or 1995 period, either by the breadth of the cooling or the depth.
Perhaps some models don't cool enough, but that does not appear to be the case for most models.
-
Lloyd Flack at 14:27 PM on 11 February 2015Kevin Cowtan Debunks Christopher Booker's Temperature Conspiracy Theory
No need, found what I needed.
-
Glenn Tamblyn at 13:31 PM on 11 February 2015Increasing CO2 has little to no effect
Quick
"did you people know that the AGW cult claims that when a molecule of carbon dioxide "absorbs" and "re-emits" a photon of IR (actually Stokes-Raman scattering) that it re-emits a photon of the "exact" same wavelengthas the one "absorbed"
Simple answer. No 'it' doesn't. No scientist knowledgeable about the processes involved in the GH efect says that. It is along the lines I described previously.
Absorption of a photon by a CO2 molecule is decoupled from emission of photons by other CO2 molecules. They absorb across a wavelength ban and equally they emit across that band, with differing probabilities of occurring at each wavelength.
Maybe your interlocutor read commentary on blogs from laymen that said this, but an Atmospheric Physicist for example wouldn't. He seems to be an example of someone who thinks that commentary in the media and public forums constitutes an accurate description of the science. It isn't, it's just commentary.
And all the science behind AGW is based on accurate spectroscopy as for example the HiTran database.
As for his last sentence, there are several ways in which atoms and molecules can absorb/emit photons. The two that matter here are:
- Atoms can absorb a photon and one of the electrons within the atom will be raised to a higher energy state. This mainly occurs around visible and ultra-violet wavelengths. This is purely an electrical process inside an atom.
- The atoms of a molecule are a bit like balls bouncing on strings - they 'jiggle around'. A molecule can absord energy from a photon that causes this vibration ('jiggling') to increase. This mainly occurs in the near Infrared which we are dealing with here. This is an electro-mechanical process encompassing the whole molecule - electro because the molecule is able to 'reveal' electric charges to the outside world because it has a 'charge separation' across the molecule, and mechnical because it involves the physical movement of the atoms within the molecule. One of the pre-requisites for a molecule to possibly be a GH gas is that it must be able to produce a charge separation. Symmetrical molecules such as Oxygen and Nitrogen can't do this, thus they can't act as GH gases. There is also a form of this absorption/emmission that occurs for some GH gases, water particularly, where the rotation of the molecule allows absorption, increasing the rotation.
-
wili at 13:13 PM on 11 February 20152015 SkS Weekly News Roundup #6B
Another item for the next roundup: phys.org/news/2015-02-purposely-cooling-planet-idea.html
>>Panel chairwoman Marcia McNutt, editor of the journal Science and former director of the U.S. Geological Survey, said in an interview that the public should read this report "and say,
'This is downright scary.'
And they should say,
'If this is our Hail Mary, what a scary, scary place we are in.'"<<
-
Increasing CO2 has little to no effect
To expand slightly on my previous comment:
The forcing change from doubling CO2 is on the order of 3.7W/m2. To calculate how the the climate must warm in response, consider the effective emissivity of the Earth to space, and the Stephan-Boltzmann law.
Power = Area * emissivity * SB constant * TK4
The Earths surface receives an average of 240 W/m2 of energy from the sun, and with a surface temperature averaging 15C emits 240 W/m2 back in balance (solve for original emissivity). If that drops by 3.7 W/m2, reducing effective IR to space (solve for changed emissivity), the surface of the Earth has to warm by 1.1C to come back into balance and again emit 240 W/m2 (use new emissivity and solve for temperature).
-
Increasing CO2 has little to no effect
Quick - The 1.1C from direct forcing from doubling CO2 comes most directly from Myhre et al 1998, computed using the HITRAN spectral database and numeric radiative codes to estimate reduction of IR to space with increasing CO2, not to mention other GHGs. This spectral change has been experimentally verified with satellite readings at GHG frequencies (Harries et al 2001 and later papers).
The 2.0-4.5C warming from a doubling of CO2, with a mode of ~3.0C (including feedbacks) comes from a broad range of studies (discussion here), including paleoclimate, GCMs, recent observations, etc. While uncertainties are present, the changes of warming outside that range are very low, apply to both the high as well as low extrema, and even 2.0C warming per doubling is likely to give us significant impacts based on our current economic path.
-
Tom Curtis at 12:21 PM on 11 February 2015Increasing CO2 has little to no effect
"[Impossible] with vibrational transition"? I think not:
-
Lloyd Flack at 12:12 PM on 11 February 2015Kevin Cowtan Debunks Christopher Booker's Temperature Conspiracy Theory
Can anyone provide an exampe of a graph showing a negative adjustment in the trend at an individual station. I need an exmple to reply to a comment on another site.
The sheer recklessness of the denialists acusations here can be used against them. They do not appear to have even tried to understand the adjustment process before attacking. This is something that they can be pinned down on.
-
Quick at 11:50 AM on 11 February 2015Increasing CO2 has little to no effect
Glenn, this is helpful. However, here is how he explained absorption and emission: "Speaking of science, did you people know that the AGW cult claims that when a molecule of carbon dioxide "absorbs" and "re-emits" a photon of IR (actually Stokes-Raman scattering) that it re-emits a photon of the "exact" same wavelength as the one "absorbed"?
This is the claim to got me interested in researching their pseudo-science. Reason being, I already knew this was impossible. There is only one process that can absorb and re-emit a photon of the exact same wavelength and that process is called resonance fluorescence and it involves an electronic transition (electron jump). It's IMPOSSIBLE with a vibrational transition."
Can you please clarify the last sentence here?
Moderator Response:[JH] For future reference, it would be extremely helpful to everyone if you were to put all quotes from you blogging adversary(ies) in italics. Thank you.
-
TonyW at 11:50 AM on 11 February 2015A 23-year experiment finds surprising global warming impacts already underway
Hmm, interesting. A few thoughts occurred to me, though. (I can't see the paper itself, even if I could access it, as there seem to be some problems with the site, at the time I tried).
This experiment, presumably, measured 23 years of a constant surface warming, above the variation already happening. But didn't/couldn't simulate a higher atmospheric concentration of CO2, over an extended time. Also, I'm not quite sure of the usefulness of measuring just the soil carbon. What about the carbon in the woody shrubs, also? That is, what was the total carbon sequestered by the plots (I realise that the soil carbon would come from the plants growing in the plots)?
I also wonder if this result has implications for one of Hansen's hopes; that reforestation would help bring CO2 levels down.
Lastly, presumably the shift from flowering plants to woody plants is due to those plots being in naturally woody areas, since the same occurred on the control plots. What would be the difference from natural prarie ecologies?
-
Quick at 11:28 AM on 11 February 2015Increasing CO2 has little to no effect
scaddenp@190, Thanks again for the input, but my last physics class was early 80s, so bear with me please. What equations yield the 1.1C and 2.0-4.5C?
-
Glenn Tamblyn at 10:57 AM on 11 February 2015Increasing CO2 has little to no effect
Quick, for starters his fixation on 9.4 and 10.4 is way off. there are two minor peaks there but the main one is closer to 15 micron. He wants a graph, show him this:
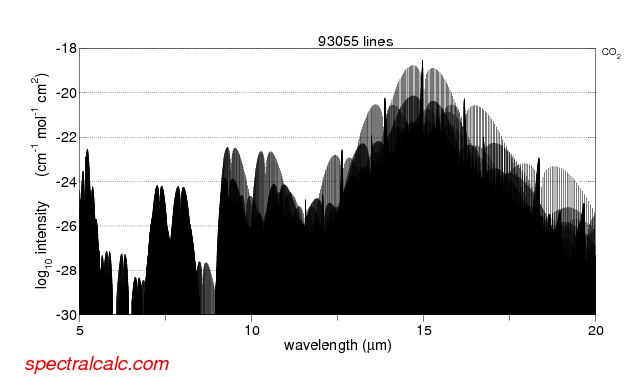
you can get a copy here: http://www.skepticalscience.com//pics/CO2IntensityWavelength.png. Notice that the vertical scale is logarithmic. So the peak at around 15 micron is nearly 10,000 times stronger than those peaks he is referring to. And this is the actual measured spectral intensity for CO2, from HiTran. Spectral Intensities 1000,s of times higher than his numbers means that is distance of kilometers becomes meters.
Next he clearly doesn't get that absorption and emission are mirror image processes. Gases that absorb at certain wavelengths also emit at those wavelengths.
He is right that when a single CO2 molecule absorbs a photon then virtually all the time this extra energy is passed off to other molecules in the air, typically within less than a microsecond of the absorption. But he is missing the fact that collision between molecules are continually raising molecules to higher energy states and dropping them back down again.
At any instant half of all the molecules in the air will be in an energy state higher than the average. And a proportion of those will be CO2 molecules. So a small proportion of those CO2 molecules will be able to spontaneously emit, de-energising by emission rather than by collision. And since there are millions of CO2 molecules in just the first meter of travel for each photon, even a small number of spontaneous emissions is enough to emit as much as is absorbed.
And most of the emitted photons are in turn absorbed by another greenhouse molecule and the energy redistributed via collisions, then another emission by another molecule ... and so on. When a gaseous medium is 'optically thick' - meaning most EM radiation passing through it is absorbed, then energy transport via radiation through the medium is extremely slow. This process is called Radiative Diffusion.A similar process occurs inside the Sun. In the inner part of the Sun there is no convection, so all energy flow is via radiation so it is extremely slow at transferring generated heat from the core outwards. It is only when one reaches the outer layers of the Sun and convection starts occurring that the rate of heat transport increases dramatically. The estimates are that it takes over 100,000 years for energy generated in the core to reach the surface and escape to space.
And it is similar here on earth except that convection is able to transport heat upwards right from the surface. It is only when the air is thin enough that some of the emtted radiation is able to escape to space. For the very peak of the CO2 absorption band this is up at 30-40 km up. However for much of the wavelengths around that between roughly 13-17 microns, the altitude is much lower, even down to around 2-3000 meters. There is a smilar behaviour for the other GH gases, depending on the profile of their spectral intensity.
Thus, athough the altitude at which the atmosphere becomes 'optically thin' varies significantly from wavelength to wave length, the average altitude at which it becomes optically thin, averaged for all GH gases, is around 5 km.
Hope this helps, and is clear.
-
Riduna at 10:52 AM on 11 February 2015A 23-year experiment finds surprising global warming impacts already underway
Interesting but neither the article or its referenced source – a précis – indicate the effect of infra-red heated plots in terms of what is to be expected from global warming this century. Nor does it appear to show likely effects on food crop yields which, after all, must be the primary concern of farmers, governments and a burgeoning hungry population.
-
scaddenp at 09:38 AM on 11 February 2015Increasing CO2 has little to no effect
Rob, conversation is here.
Quick. He has the equation wrong (note not explaining it). The correct answer is around 1.1C. However this is temp change from radiative forcing alone. Feedbacks (water vapour, albedo primarily) lift this higher to something in range 2-4.5C.
Jim needs to realise that just because he doesnt understand something doesnt make it wrong, especially on basis of a cock-eyed semantic argument. Secondly, if your understanding of something doesnt agree with actual measurements (eg the increase in DLR) and textbook calculations do, then guess who is wrong.
-
Rob Honeycutt at 09:29 AM on 11 February 2015Increasing CO2 has little to no effect
Ah! Just figured out where "Jim in CA" is getting his information.
Nasif Nahle Sabag.
The equation is a direct cut and paste.
-
Richard Treadgold at 09:20 AM on 11 February 2015Arctic sea ice extent was lower in the past
Thank you, gentlemen. Let me absorb this.
-
Rob Honeycutt at 09:14 AM on 11 February 2015Increasing CO2 has little to no effect
Where is this conversation going on, Quick?
-
Quick at 08:56 AM on 11 February 2015Increasing CO2 has little to no effect
Then same guy, (Jim in CA) added this:
"And yes, GHG theory is wrong. Here's an equation that shows the temperature increase moving from 280ppm to 560ppm:
ΔT = (0.443 W/m^2) ln[(560 ppmv/280 ppmv)] / 4 (5.6697x 10^-8 W/m^2*K^4) (300.15 K)^3 = 0.307 W/m^2 / 6.13 W/m^2*K = 0.05 K = 0.05 C = 0.09 F
That's it, just 0.09 F. Wow and double wow!! We're all going to die from heat exposure. LMAO Additionally, that value is most likely high as it's based merely on atmospheric partial pressure of CO2 and emissivity. It isn't taking into account the likelihood of energy transfer to other molecules with higher specific heats that can absorb the energy without changing temperature....molecules like water vapor.
And that brings me to another point. You morons are constantly saying that CO2 "traps" heat. Don't know about you, but to me if something is "trapped", then it's removed from the environment. "Trapping" heat would COOL things down, not warm them up. Additionally, the CO2 molecule at our atmospheric pressures and temps simply has TOO low of a specific heat to carry much thermal energy anyway. It doesn't have the thermal headroom. Sorry about your bad luck on that one.
CO2 is quite simply an energy conduit. Nothing more. It quickly transfers energy from one source to another without storing it."
-
villabolo at 08:18 AM on 11 February 2015Global warming is causing more extreme storms
@ the Griss:
Steven Goddard should be made aware of skeptic Roy Spencer's UAH temperature chart which is on model 5.6. Talk about changes.
-
Quick at 08:18 AM on 11 February 2015Increasing CO2 has little to no effect
Oh, and I have asked repeatedly for ANY any reference, but he deflects. My BS meter redlined when I first saw his original post, but I lack the bandwidth and advanced acumen to effectively debunk this. I also laid down the gauntlet for him to join here and engage. So far it's been met with more deflection.
Moderator Response:[JH] The use of "all caps" is akin to shouting and is prohibited by the SkS Comments Policy.
-
Quick at 08:13 AM on 11 February 2015Increasing CO2 has little to no effect
Glenn, I posted #182 and 183 almost verbatim. Here was his response:
When viewed under high resolution, EVERY gas has numerous small transitions along the entire EM spectrum. That has never been under dispute. I guess you can't distinguish between that and an absorption peak. And by the way, that also shows that EVERY gas is a "greenhouse gas."
Additionally, I'm well aware of the various factors that will influence absorption. Factors such as natural, temperature (also called Doppler) and pressure broadening. These same factors will also affect emissions to varying degrees.
But now you've shifted gears and are talking about ABSORPTION. As I recall, your beloved Greenhouse Gas Theory claims that CO2 absorbs and then "re-emits" a photon of IR. But that's not absorption since absorbed energy isn't re-emitted...at least below 85km in altitude. Below that altitude, absorbed energy is passed on to other molecules as KE during a collision. So I guess it looks like you've disproven your own beloved theory. Nice going.
As for my reference to Wien's displacement law, you have things backwards...which is normal for an AGW cultist. I reference it to show surface temperatures that will produce specific [peak] wavelengths that are emitted by a surface at that specific temperature, NOT to show what is being absorbed. Were you a breech baby as well?
But since you've deflected to absorption instead of scattering, I notice you left out the absorption coefficients of the TWO and ONLY two absorption peaks that are within the atmospheric window. Just so you don't have to waste time scrambling to try and find out what they are, they're 9.4 microns and 10.4 microns. Maybe you should post the absorption coefficients for all to see. You think?
-
Jim Eager at 06:47 AM on 11 February 2015Global warming is causing more extreme storms
JoeT, the northern shore of the Mediterranean basin is supposedly warming and drying in similar fashion as well. See this 2007 guest post at RealClimate by Figen Mekik: Sweatin’ the Mediterranean Heat.
-
Tom Curtis at 06:46 AM on 11 February 2015Kevin Cowtan Debunks Christopher Booker's Temperature Conspiracy Theory
Further to @54, here are the relevant figures for the test of the algorithm for GHCN v3 from Menne and Williams (2009):


As you can see, the algorithm reproduces the correct, zero trend regardless of whether the original data was distorted by upwards or downwards shifts. In otherwords, it shows no bias with regard to trends. The shift in the mean is because the algorithm always makes adjustments with reference to the final year (ie, effectively assumes the most recent measurement is accurate). It is inconsequential.
-
Tom Curtis at 06:28 AM on 11 February 2015Kevin Cowtan Debunks Christopher Booker's Temperature Conspiracy Theory
JH inline @49, and algorithm is just a proceedure that can (in principle) be automated. The algorithms used for quality control and homogeneity adjustment for GHCN v3 are described in Lawrimore et al (2011). (Off course, sometimes the description consists of a reference to an earlier paper.) Essentially, for homogeneity adjustments, they come down to comparing the temperature series to a set of nearby stations with a high correlation with that station. If there is a sudden, large shift in temperature in a particular station that is not found in its neighbours, it is assumed that there has been some change in circumstances at that station and an adjustment is made. The essential point is that there is a hard rule as to when, and by how much the adjustment is made based on the number of nearby stations, and the level of divergence. The algorithm does not look up the date, and nor does it look up the geographical region in making the adjustment. The detailed description of the method can be found in Menne and Williams (2009), along with a description of a test of the method using artificial data with random change points.
-
FrancisMcN at 05:37 AM on 11 February 2015Kevin Cowtan Debunks Christopher Booker's Temperature Conspiracy Theory
MA Rodger and Tom Curtis many thanks for your recent posts which have given me the real meat I was after to be able to just maybe change a potential UKIP voter's mind or at the very least make him change the subject! However much it is true that Brooker is unworthy of his prominence, the trouble is that a lot of local decision makers in my neck of the woods take his output as the truth until something more convincing is offered instead.
-
JoeT at 04:26 AM on 11 February 2015Global warming is causing more extreme storms
Figure 2 in the Abraham et al paper shows localized regions of increased drying in the Southwest, as one might expect due to the poleward expansion of the Hadley circulation. Is it possible to say with some degree of confidence that the Hadley circulation is the responsible culprit for this drying? If so, are there other places in the world where the drying can clearly be attributed to the expansion of the circulation, or places where this explanation doesn't hold. I'm asking this in part because of Richard Seager's 2007 paper which models and predicts this increased drying and the recent NOAA report on drought in California (Seager was the lead author) which claimed that the drought was not due to long-term climate change.
-
wili at 03:57 AM on 11 February 2015A 23-year experiment finds surprising global warming impacts already underway
Good points. I in no way meant to imply that the oceans would
"provide CO2 salvation." Only that they are important in understanding the short term dynamics of CO2 exchange going forward.Once equilibrium is reached, offgassing from the oceans will keep atmopsheric CO2 levels high for thousands of years, at least.
Moderator Response:[JH] Please provide a citation for your concluding statement. Thank you.
-
Tom Curtis at 03:43 AM on 11 February 2015Kevin Cowtan Debunks Christopher Booker's Temperature Conspiracy Theory
MA Rodger @50, I'm waiting for them to turn their attention to all the adjustments nature has been making to sea ice extent in the Arctic. All those natural thermometers must be in on the conspiracy along with NASA and NOAA and the former temperature record skeptics at BEST.
-
MA Rodger at 03:38 AM on 11 February 2015Kevin Cowtan Debunks Christopher Booker's Temperature Conspiracy Theory
Link to NOAA directory @50 goes elsewhere. Here is where it should go.
Prev 650 651 652 653 654 655 656 657 658 659 660 661 662 663 664 665 Next


