


 Arguments


Recent Comments
Prev 657 658 659 660 661 662 663 664 665 666 667 668 669 670 671 672 Next
Comments 33201 to 33250:
-
Rob Honeycutt at 10:40 AM on 26 October 20142014 SkS Weekly News Roundup #43B
Donny... Think of it this way. You're assembling a puzzle. You have a large number of the pieces in place and they fit together well. You have a strong understanding of the overall image but not all the pieces are in place. You've been trying to fill in a certain area and then you come upon a key piece that explains one area of the image.
The image didn't change, you just understand it much better.
-
Tom Curtis at 10:11 AM on 26 October 20142014 SkS Weekly News Roundup #43B
Donny @1, can you explain exactly which physical law relevant to global warming has been refuted or ammended by this discovery in biology? (Or are you just making an empty rhetorical point?)
-
Donny at 09:25 AM on 26 October 20142014 SkS Weekly News Roundup #43B
How can a key player in climate change be recently discovered? I thought the science was settled? Except for all the aspects that aren't settled I guess. Maybe it's a case of you don't know what you don't know.
Moderator Response:[PS] Please drop the rhetoric.
-
Tom Curtis at 09:05 AM on 26 October 2014Models are unreliable
Tom Dayton @778, your explanation is a good one except for the claim that "Using as your baseline an average of several consecutive years ... intersects the datasets and trend curves at the midpoint of that timespan". That will only occur if the various datasets only differ in slope. As the datasets also differ in the shape of the curves (due to differences in annual variation) they will not all intersect in the same year using a multi-year baseline, and different curves will likely intersect multiple times across the baseline period (and probably outside it as well). The average difference across the baseline period (specifically the Root Mean Squared Difference) will be minimized.
In reponse to BojanD, I would like to draw attention to two comments I made (in particular) in the discussion of the AR5 Fig 1.4. First:
"Use of a single year baseline means offsets can vary by 0.25 C over just a few years (CMIP3 comparison), while with the five year mean it can vary by 0.15 C (CMIP5 comparison). That is, choice of baselining interval with short baselines can make a difference equal to or greater than the projected decadal warming in the relative positions of observations to model ensemble. When you are only comparing trends or envelope over a decade or two, that is a large difference. It means the conclusion as to whether a model is falsified or not comes down largely to your choice of baseline, ie, a matter of convention."
Note the range of potential offsets here were calculated specifically for the model temperature comparison. For some data sets, with low annual variability choice of a single year baseline makes no practical difference.
"...On the contrary, a 1990 baseline makes the observations look warm. The emphasis on that point is so that my allies pick up on the fact. Intuitively, we would expect a 1990 baseline to cause the observations to look cool, for 1990 is a local high point in the observations. However, that is not the case, for though the observations are warm, the ensemble mean is warmer still relative to adjacent years. Thus, if anything, a 1990 baseline is favourable to a defence of the validity of models.
But it is still wrong.
It is wrong, basically, because you have to analyze the data as you motivated me to do to know whether it is favourable, unfavourable or neutral with regard to any position. The only way to avoid that necessity is to use a long (thirty year) baseline so that the baseline is robust with respect to time period used. Ideally, we should use the long baseline that minimizes the Root Mean Squared Error (RMSE) between the observation and the ensemble mean. By doing so, we ensure that any discrepancy between observations and ensemble are real, ie, are not artifacts of an ill chosen baseline."
I will note the comments in the thread on IPCC AR5 Fig 1.4 are well worth reading in general (particularly those from SkS authors and regulars) for those who want to understand the issues relating to baselining better.
-
Tom Dayton at 04:35 AM on 26 October 2014Models are unreliable
BojanD: An example of incorrect baselining by using the single year 1990 was an IPCC AR5 report preliminary draft's plot of model projections versus observations. That error was pointed out by Tamino and explained by Dana here on SkepticalScience.
That particular error has a problem in addition to what I explained in my previous comment: Each model curve is a different run of a model, with different parameters; think of each curve as being from an alternate Earth. The mean curve of those curves inherently averages out the noise and so is representative of the population of all those curves--the Average Earth. But there is only one observed dataset--only one of the many alternate Earths. We can't create an average across all the alternate Earths' observed temperatures, because we've got only one Earth. We have a really sparse sample of the population of alternate Earths' observed temperatures, that we are comparing to a much larger sample of the population of alternate Earths' modeled temperatures.
We can't get more alternate Earths' observed temperatures. But at least we can get a better estimate of the population of observed temperature at that year (1990) by averaging across the 30 years centered on 1990, and using that average as our baseline.
-
Tom Dayton at 04:16 AM on 26 October 2014Another global warming contrarian paper found to be unrealistic and inaccurate
BojanD, I replied to you on the Models Are Unreliable thread.
-
Tom Dayton at 04:14 AM on 26 October 2014Models are unreliable
BojanD asked on another thread: "Since some of you know a thing or two about models, I would like to ask you a question that I just can't find an answer to. I'm looking for some credible explanation why 1990 is a baseline year to align model projections with measurements. Since misaligning them is one of the favorite contrarian tactics, I would like to have technical description why it is wrong. Thanks you!"
(Somebody more knowledgeable than me--and there are lots of you--please correct any errors in my below explanation to BojanD.)
BojanD, choosing any baseline does not change the slopes of the trend curves. That's the first thing to note in a discussion of a fake skeptic's manipulation of baselines. Up is still up. Scary is still scary.
Choosing a baseline affects only the position of the curve on the y (temperature) axis. That is irrelevant if you are looking at only one curve. It is relevant only if you are comparing trend curves, and even then only if those curves are not identical. Real temperature data's trend curves never are identical, of course. Computing all the data using the same, single, baseline year in effect moves all the data up and down the y axis to make all those datasets and therefore trend curves intersect at that baseline year. Using as your baseline an average of several consecutive years does the same thing, but intersects the datasets and trend curves at the midpoint of that timespan.
Choosing a baseline period has the effect of choosing the time period in which the curves intersect. That has the effect of choosing which portions of the curves intersect.
The differences among the trend curves are minimized at the midpoint of the baseline period. The differences manifest most before and after that baseline period.
Imagine trend curves Observed and Model both have positive slopes, but Observed's slope is shallower than Model's. If you move the curves up and down the y axis (temperature) so they intersect at the far left of the x axis (years), then Observed will diverge below Model toward the right of the plot; Observed will be cooler than Model the closer to Now that you get. If instead you make them intersect at the far right end of the x axis, Observed will diverge above Model toward the left of the plot; Observed will be warmer than Model in the past, but approach and then match Model at Now.
How do you choose a fair timepoint at which the curves intersect? That depends on the exact question you want to ask. But almost regardless of the exact question you want to ask, it is inappropriate to choose any single year as the baseline period, because that year almost certainly will not be representative of the underlying, "true," population temperature even at that one-year moment in time. If your single chosen year lies above or below the true population temperature at that year, then you will be making the trend curves' intersection unrepresentative of the population data. You can't use even just a few years, because the true population temperature is obscured by short-term noise. You really should baseline on the temperature averaged across 30 years or so. That's why the definition of "climate" is based on 30 years.
HotWhopper showed how Roy Spencer used a short and cherry-picked baseline period to produce his infamous plot of models over-projecting temperature in recent years, here and then with a different flavor here.
-
Dikran Marsupial at 04:06 AM on 26 October 2014Another global warming contrarian paper found to be unrealistic and inaccurate
BojanD it would help if you gave an example where a baseline of 1990 was used.
A single year baseline is sometimes used for visualisation of warming rates, but it isn't something you would do to compare model output with observations, instead you would use a baseline period of say thirty years. Different baseline periods are used for largely historical reasons, however if the results depend heavily on the exact baseline you have chosen, then the baseline period is likely to be too short (30 years ought to be about right).
-
michael sweet at 03:31 AM on 26 October 2014Models are unreliable
Tom,
I agree "that there are some aspects of model performance which, if cherry picked, indicate they underestimate expected warming. Equally there are some other aspects of model performance which, if cherry picked, indicate they overestimate expected warming. "
My comment was intended to illustrate the cherrypicking you mention for Shadow Dragon. Perhaps Shadow Dragon will come back and clarify what they are interested in. Hopefully their interest will be as even handed as your assessment is.
-
BojanD at 01:05 AM on 26 October 2014Another global warming contrarian paper found to be unrealistic and inaccurate
Since some of you know a thing or two about models, I would like to ask you a question that I just can't find an answer to. I'm looking for some credible explanation why 1990 is a baseline year to align model projections with measurements. Since misaligning them is one of the favorite contrarian tactics, I would like to have technical description why it is wrong. Thanks you!
-
Miller, Bernd at 00:43 AM on 26 October 2014From Pole to Pole - a climate-themed tour through a zoo
Glückwunsch! Ein gut ausgearbeiter Beitrag, der viele Fragen beantwortet. Weiter so.
Moderator Response:[BW] Thanks for the comment! Here is the translation for non-German speakers: "Congratulation! A well-rounded article answering a lot of questions. Keep it up."
-
wili at 22:56 PM on 25 October 20142014 SkS Weekly News Roundup #43A
Got it. I agree.
I guess I had just read 'ISIS' as a kind of short hand for the whole mess that lead up to this particularly nasty recent turn of events.
-
Tom Curtis at 22:32 PM on 25 October 20142014 SkS Weekly News Roundup #43A
wili @6, I am not denying the link from civil war in Syria, although there were a number of other exacerbating factors involved. What I am denying is a link between the drought and the development of ISIS as a faction in that civil war, or its apparent success. Drought will strain the civil capacity of a society, and if that society is already strained, may tip it over into civil disorder (including civil war). It will not determine the form of the civil disorder, or how the different factions identify themselves or act, or how popular or successful they are. Further, once a society has descended into a multifaction civil war with atrocities being committed by several (if not all) factions, the civil capacity of the society is prety much defunct in any event. Drought can't tip the society into civil disorder because it is already well beyond that border.
-
wili at 21:56 PM on 25 October 20142014 SkS Weekly News Roundup #43A
TC, it is of course devilishly hard to prove causation, but if you look at surface temperature and drought maps, Syria stands out as particularly hard hit, iirc. Of course, there are long standing oppressions and grievances in the area. But extreme heat and drought beyond historic norms would seem to be reasonable exacerbating factors at the least for why these long-term problems have been boiling over in the last few years there.
-
Tom Curtis at 21:51 PM on 25 October 20142014 SkS Weekly News Roundup #43A
From Peru @3, I would not look to global warming for a proximate cause of the rise of ISIS. There is sufficient explanation of that in the pre-existing chaotic political state in Syria and Iraq along with the partially sectarian nature of the conflict and a strong, extreme fundamentalist religious strand in Islam at the moment. Once you have a vicious civil war in a country, famine is redundant as a cause of instability.
Further, even if a study was done as to the impacts of global warming on the rise of ISIS, apart from the impacts in starting the initial civil war, there would be too many confounding factors to determine any influence.
Having said that, there are still a number of middle east nations that have borderline stability currently, where a famine could in fact tip the balance. Renewed famine in those nations would reasonably raise concerns about their ability to maintain the stability they have already.
-
Tom Curtis at 21:40 PM on 25 October 2014Models are unreliable
michael sweet @775:
"Many people thing that the models do not accurately include many positive feedbacks like arctic carbon or sea bed methane. This means they systematicly underestimate the expected warming and things are worse than we think."
No! That means that there are some aspects of model performance which, if cherry picked, indicate they underestimate expected warming. Equally there are some other aspects of model performance which, if cherry picked, indicate they overestimate expected warming. In practise they tend to balance out, with the best evidence suggesting they currently overestimate warming by 15%. That evidence remains consistent with their actually underestimating warming (given uncertainties); but not (on a frequentist test) with their overestimateing warming by more than 100% (ie, we can be very confident of at least half of model ensemble mean predicted warming going forward).
I will note that the models are underpredicting (by and large) slow feedbacks more than fast feedbacks. On that basis I suspect the current 15% overestimate of warming figure is misleading in the long term, and that the actual future warming beyond several decades will be closer to the model mean or above it rather than below that 15%.
-
wili at 21:19 PM on 25 October 20142014 SkS Weekly News Roundup #43A
FP, I don't know of any such studies. But one thing to watch going forward is Russian wheat production. Their ban on exports of wheat (after a bad winter harvest and then a devastating drought in '10) greatly exacerbated (at least) the already brutal conditions MENA countries, especially Egypt, which particularly dependent on Russian wheat. Conditions are already looking worse than back then for the prospects of the coming year's winter wheat.
-
michael sweet at 20:49 PM on 25 October 2014Models are unreliable
Shadow Dragon,
It is good that you brought this up. Many people thing that the models do not accurately include many positive feedbacks like arctic carbon or sea bed methane. This means they systematicly underestimate the expected warming and things are worse than we think.
One only has to look at sea level rise, one of the worst long term problems of AGW. Sea level rise runs at the very top of the model results. It is clear that future sea level rise is much more likely to run over the IPCCC projections than under them.
Thank you for pointing out that the models are often too conservative.
-
chriskoz at 20:07 PM on 25 October 2014From Pole to Pole - a climate-themed tour through a zoo
I'm amazed by the wealth of interesting information about climate change impacts on selected fauna species not only herein but also in the links.
I haven't seen such interesting and easy digestion of this subject anywhere yet, and that's the outstanding aspect of it. Thanks
Baerbel.I havn't known for example that walrus is a species as much affected by the diminishing ice cover as flagship polar bears. Maybe media need to pay more attention to species such as walrus. Polar bears became such cliche, that many people deny their problem. But more evidence involving different species would convince more people that we have loss of biodiversity problem.
I've learned about some species that were exotic to me, like Egyptian geese. Interesting to compare these geese with an American species that I know very well: Canadian geese. Here's an account from a hunter on the east coast. It apears Canadian geese also benefits from climate change, while people who depend on their migrations (like hunters/farmers) are distressed by the changes.
-
Wol at 16:51 PM on 25 October 2014Scientists to Explain 'Climate at Your Doorstep' at New Online Hub
A good idea, but one that could easily backfire.
The denial industry is adept at picking the tiniest holes in an argument and exploiting it mercillesly, then moving seamlessly on to another hole.
The arguments are so technical that simplified explanations are always going to have these holes to be picked on. I can see the denialists gaining support from this.
-
From Peru at 14:13 PM on 25 October 20142014 SkS Weekly News Roundup #43A
About the climate change/violence link, I think most of us heard about the possible link between the drought in the Iraq and Syria (between 2008-2010) and the 2011 events then lead to the brutal Syrian Civil War between the Syrian Government and the Syrian Rebels.
Early this year I read about a new drought in this region, perhaps even more severe than the previous one, that created concerns about an humanitarian disaster for the already hit population there. There were even concerns about a repeat of the 2010-2011 food price spikes (that by some people were also a trigger for the unrest wave known as "Arab Spring" that began a few months before the Syrian crisis).
The food price concerns did not materialize, but the conflict in Syria/Iraq worsened with the surge of the so-called ISIS/ISIL.
Is there any study supporting or refuting a link between 2013-2014 drought and the surge of the ISIS/ISIL in 2014, just like was done with the 2011 events?
-
Daniel Bailey at 12:41 PM on 25 October 2014Models are unreliable
"aren't there concerns with climate models as well"
You tell us, it's your contention.
-
wili at 09:31 AM on 25 October 20142014 SkS Weekly News Roundup #43A
Kevin Anderson's response to EU's "2030 Framwork"--emissions reductions should be 80%, not the 40% by 2030 proposed in the document.
Letter to the PM outlining how 2°C demands an 80% cut in EU emissions by 2030
-
mercpl at 09:24 AM on 25 October 20142014 Arctic sea ice extent - 6th lowest in millennia
Can I get a copy of that first animated image as an animated GIF?
There's a few sites I'd like to post it to.
-
xxtheshadowdragonxx at 08:58 AM on 25 October 2014Models are unreliable
aren't there concerns with climate models as well? what are they?
-
wili at 07:34 AM on 25 October 20142014 SkS Weekly News Roundup #43A
Thanks for covering the Amazon and Sao Paulo sitiations here. That Al Jazeira article was particularly good. I have to remember to check their coverage of these issues more often.
Moderator Response:[JH] Your'e welcome.
-
John Hartz at 02:04 AM on 25 October 2014Another global warming contrarian paper found to be unrealistic and inaccurate
The following article contains some very interesting information about one dimension of GCMs, ie. spatial coverage.
Researchers resolve the Karakoram glacier anomaly, a cold case of climate science, Phys.org, Oct 22, 2014
-
Pierre-Normand at 01:12 AM on 25 October 2014Another global warming contrarian paper found to be unrealistic and inaccurate
That was very useful Tom Curtis.
-
Magma at 23:47 PM on 24 October 20142014 Arctic sea ice extent - 6th lowest in millennia
To save interested readers the trouble of clicking through a couple of posts looking for a link, the Kinnard et al. (2011) reference is to the Nature paper 'Reconstructed changes in Arctic sea ice over the past 1,450 years'.
Journal link at http://www.nature.com/nature/journal/v479/n7374/full/nature10581.html
Author's copies can be found online with a search.
Moderator Response:[PS] Fixed link. Thanks for that.
-
wili at 23:03 PM on 24 October 20142014 SkS Weekly News Roundup #42B
ClimateCentral has now picked up the Sao Paulo drought story:
-
Tom Curtis at 18:38 PM on 24 October 2014Another global warming contrarian paper found to be unrealistic and inaccurate
MartinG @26, the problem faced with modelling (still) is the large computer resources needed for any given run. Couple that with the fact that short term fluctuations in climate states (at least) are chaotic and it is currently prohibitive to explore the impact of particular parameters by varying them only over a number of runs however desirable that would be. The IPCC does the next best thing, and the best option available given current computer capabilities and resources. That is, they generate predictions from an ensemble of models which, de facto, explore a range of parameters within the constraints generated by emperical studies. The resulting ensemble mean predictions are not precise, but plausibly they cover the likely range of the actual outcome for a given future forcing history, and give a reasonable indication of the error range of the estimate. I agree it is far from ideal, but it is better than not exploring the issue at all.
Having said that, I believe there have been recent attempts to use models of intermediate complexity to generate larger ensembles of runs for slight variants of parameters, ie, to do as you recommend but with less complex models. Because of the reduced complexity, these studies are not definitive by any means, but they do help explore a greater range of issues in greater depth.
-
scaddenp at 17:54 PM on 24 October 2014Another global warming contrarian paper found to be unrealistic and inaccurate
Those that "debate" climate science (Ie not the ones actually doing it), havent shown much interest in the empirical observations that are part of parameterization of models. These are things like relationship between wind speed and evaporation. There is more on this here.
"My point is that I think models are useful for testing sensitivity to parameter change much more than thier predictive value."
That is not at all clear to me. What is your basis for that thinking?
-
MartinG at 17:36 PM on 24 October 2014Another global warming contrarian paper found to be unrealistic and inaccurate
Tom@24. Thats very interesting, and it surprises me, and I bow to your superior knowledge. But we have seen in the climate debate that "empirical observations" turn out to be different depending on who is doing the observations. There is an uncertainty range for most such observations. My point is that I think models are useful for testing sensitivity to parameter change much more than thier predictive value.
-
Tom Curtis at 17:03 PM on 24 October 2014Another global warming contrarian paper found to be unrealistic and inaccurate
MartinG @24, Global Circulation Models for the most part in CMIP3 (IPCC AR4) and in all cases for CMIP5, do not have "tunable" parameters. They have parameters for such things as the turbulence in surface air flow due to surface type (grassland, forest, mountains etc) where exact expression of the physical laws is impossible at the resolution required. However, these parameters are determined by empirical observations, so they are not "tunable". Further, even for earlier GCMs which did have some tunable parameters, the number of predicted quantities was large relative to the number of parameters so that they constituted a substantial constraint.
I will further note that nobody, least of all the IPCC, makes "absolute" predictions from climate models. The IPCC do make predictions from the ensemble of models, with large and explicit error margins, but predicting a value within a range is not making absolute predictions.
-
MartinG at 16:43 PM on 24 October 2014Another global warming contrarian paper found to be unrealistic and inaccurate
Thank you Tom for a well argued, with accompanying references, article on this subject refreshingly free (almost) from opponent bashing. John Abraham would do well to copy your style. Spencers rebuttal is likewise written, and I am glad to see that the arguments can still be discussed for what they are in a genuine attempt to expose the truth rather that a war between believers and non believers.
I suspect all climate models have tunable parameters, just as models in other sciences. Climate is, to put it mildly, complicated, and we have much to learn. We would therefore do well to use model results from peturbing one tunable parameter at a time to establish and calibrate its effect rather than believing the absolute predictions.
-
Tom Curtis at 14:35 PM on 24 October 2014Another global warming contrarian paper found to be unrealistic and inaccurate
Pierre-Normand @22, much of Roy Spencer's responce depends on asserting the adequacy of 1 dimensional models for assessing climate sensitivity. That, in one respect, is a fair line of defence. Spencer and Braswell (2014) used a one dimensional model, ie, a single vertical profile of the top 2000 meters of the ocean using globally averaged values. Because it uses globally averaged values, it necessarilly treats all points of the global ocean as having the same values, and so much of Abraham's critique amounts to a critique of the adequacy of such models in this application.
Spencer defends the adequacy of his model on the grounds that Hansen has purportedly claimed that, "... in the global average all that really matters for the rate of rise of temperature is (1) forcing, (2) feedback, and (3) ocean mixing." Following the link, however, I find no such claim by Hansen. He does claim that the global energy imbalance determines (in part) the final temperature rise from a forcing, but that is a far cry from asserting that treating only averaged values in a model will adequately determine when that will be (ie, determine the climate sensitivity factor).
Interestingly, Hansen did say, "Ocean heat data prior to 1970 are not sufficient to produce a useful global average, and data for most of the subsequent period are still plagued with instrumental error and poor spatial coverage, especially of the deep ocean and the Southern Hemisphere, as quantified in analyses and error estimates by Domingues et al. (2008) and Lyman and Johnson (2008)." It follows that, according to Hansen, Spencer's one dimensional model must be essentially useless over the period prior to 1970. Indeed, Hansen goes on to write:
"Earth's average energy imbalance is expected to be only about 0.5-1W/m2. Therefore assessment of the imbalance requires measurement accuracy approaching 0.1 W/m2. That target accuracy, for data averaged over several years, is just becoming conceivable with global distribution of Argo profiling floats. Measurements of Earth's energy imbalance will be invaluable for policy and scientific uses, if the observational system is maintained and enhanced."
Based on that, given the monthly data required for the empirical validation of Spencer's model, according to Hansen the model would be useless for all periods prior to 2004 at the earliest. (Note, long term averages are more accurate than monthly variations. It is the later, required by Spencer, that are inadequate prior to 2004; whereas estimates of the former would still be reasonable although with wide error margins.)
This brings us to the second basis on which Spencer claims adequacy, a claimed superior empirical fit to that of GCMs. That superior fit, however, is unimpressive both because it is purely the function of having tunable parameters, and does not take into account that while GCMs produce ENSO like fluctuations, they do not produce them in sync with the observed ENSO fluctuations. In constrast, Spencer imposes the observed ENSO fluctuations onto his model (which is not superior empirically until he does). Thus, the purported superior emperical fit is not an outcome of the model but an input.
All this, however, is beside the point. While nearly all climate scientists would see a use for one dimensional models, very few (other than Spencer) would consider them adequate to determine climate sensitivity with any real accuracy. They give ballpark figures only, and are known to lead to significant inaccuracies in some applications.
Turning to more specific points, one of Abraham's criticisms is the use of an all ocean world, a point Spencer responds to appeal to the adequacy of single dimensional models. However, in using an all ocean world, Spencer assumes that the total heat gain by the Earth's surface equals the ocean heat gain from depths of 0-2000 meters. That is, he underestimates total heat gain by about 10%, and consequently overestimates the climate sensitivity factor by about the same margin (ie, underestimates ECS by about 10%).
That is important because his estimated climate sensitivity factor with ENSO pseudo-forcing (Step 2) is 1.9 W/m-2K-1. Correcting for this factor alone it should be 1.7 W/m-2K-1, equivalent to an ECS of 2.2 C per doubling of CO2. The step 3 ECS would be much lower, but it only gains a superior emperical fit to step 2 on one measure, and obtains that superior fit by the tuning of eight different parameters (at least). With so many tuned parameters for a better fit on just one measure, the emperical suport for step 3 values is negligible.
A second of Abraham's criticisms is the failure to include the effects of advection. Spencer's response that his model includes advection as part of the inflated diffusivity coefficients would be adequate if (1) they varied between all layers instead of being constant for the bottom 26 layers, and (2) where set by emperical measurement rather than being tunable parameters. The first point relates to the fact that advection may differentially carry heat to distinct layers, and hence the effects of advection are not modelled by a constant ocean diffusivity between layers, even on a global average.
There may be other such nuances in relation to particular criticisms that I am not aware of. The point is that the appeal to the features of a one dimensional model does not justify Spencer and Braswell in ignoring all nuance. Therefore some of Abraham's criticisms, and possibly all of them still stand.
Finally, I draw your attention to Durack et al (2014). If their results are born out, it will result in Spencer and Braswell's model with current parameter choices predicting an ECS 25-50% greater than the current estimates, ie, 2.7-3.3 C per doubling of CO2. Of course, the parameters are tunable, and Spencer and Braswell will without doubt retune them to get a low climate sensitivity once again.
-
Pierre-Normand at 08:55 AM on 24 October 2014Another global warming contrarian paper found to be unrealistic and inaccurate
Roy Spencer has posted an initial response to Abraham et al. on his blog.
-
Glenn Tamblyn at 06:44 AM on 24 October 20142014 Arctic sea ice extent - 6th lowest in millennia
An importat factor to remember wrt sea ic is that it isn't just the melting that matters. It is the refreeze each fall/winter. Decline can arise just as easily if refreeze declines as well as melting increasing.
And in this respect the basic thermodynamics of sea ice formation matters. Freezing starts once the air is cold enough. Then as the ice is forming the refreeze occurs on the bottom of the ice, where it is in contact with the water. But the driver for this is the air temperature above the ice.
And ice is actually a reasonable insulator.
So as the ice thickens, the air above needs to get progressively colder to allow the temperature of the ice at the bottom to be at the freezing point to cause more freeze. So as the ice thickens, the harder it becomes for it to thicken further.
So if we compare a patch of ice that is 1 meter thick when the refreeze starts with a patch that is say 2 meters thick, for the same weather conditions the thinner ice will thicken more over the wintter than the originally thicker ice
So the shift Tamino reported is most likely due to the fact that much of the old, thickest multi-year ice has been lost. So far more of the ice at the end of the melting season is thinner ice. And thus can actually put on greater thickness during the winter.
So the variation over the season increases.
-
2014 Arctic sea ice extent - 6th lowest in millennia
ranyl - Well, weather is highly non-linear, rather chaotic, but that's probably not the real reason.
Tamino had a post a while back on sea ice that indicated a significant change in 2007, namely that the annual cycle got bigger:

This may be due to the ongoing thinning of the Arctic ice leading to more susceptibility to weather - thinner ice is just more likely to be pushed around by winds and currents.
-
ranyl at 04:01 AM on 24 October 20142014 Arctic sea ice extent - 6th lowest in millennia
Does the rate, change the way choatic systems change, i.e. can we expect a more turbulent ride the faster things progress?
-
ranyl at 04:00 AM on 24 October 20142014 Arctic sea ice extent - 6th lowest in millennia
Wonder how a shift of that magnitude and rate affects fauna, flora and climatic system?
Rate of change must influence things as well.
Does the rate of change the way choatic systems change, cna we expect a more turbulent ride the faster things progress?
-
Glenn Tamblyn at 03:30 AM on 24 October 2014Another global warming contrarian paper found to be unrealistic and inaccurate
Nice comment over at the Guardian about what is wrong with the Spenser/Braswell model:
"This isn't really my field, but I did study enough about Thermohaline circulation. and it's role in climate, to know that a model that treated the oceans as a non-moving fluid, is about as much use as a chocolate fireguard. "
And that commenter forgot to add Ekman Transport as well.
If you are a novice in a field it's OK to try some stuff out as a part of how you learn. But you don't do a simple version like this then run off to Congress to tell them about it!
-
Cooper13 at 01:28 AM on 24 October 20142014 Arctic sea ice extent - 6th lowest in millennia
It's quite sad how this same old 'Arctic sea ice is recovering' mishmash can get repeated every few years...
Sort of like claiming your college football team staged a comeback in a blowout game:
Qtr 1 2 3 4 Total
Wisconsin 28 21 17 0 66
Illinois 0 3 0 10 13
"But we outplayed them in the 4th quarter!!!!"
-
mitch at 01:25 AM on 24 October 2014Another global warming contrarian paper found to be unrealistic and inaccurate
While I believe there is an ethical dimension to disinvestment, the risk factor is just beginning to peek its way above the noise. So, I expect to continue seeing a trend away from fossil fuels. What are the risk factors? (1) Cost of replacement of fossil fuel inventory, (2) increased price volatility, (3) competition for energy markets by renewables, (4) reduction of fossil fuel subsidies, and (5) carbon taxes or carbon limitations.
Of the fossil fuels, coal is the most vulnerable since it has competition from natural gas as well as the renewables. We are just getting into the economies of scale for renewables, so expect that the prices will continue to drop.
The stone age didn't end for lack of stones.
-
Tristan at 01:20 AM on 24 October 2014Another global warming contrarian paper found to be unrealistic and inaccurate
scaddenp
You can have so much fun with the US siting data, as Steve Goddard likes to do. Everyone can pretend to be a scientist!
-
Tom Curtis at 22:24 PM on 23 October 2014Recursive Fury: Facts and misrepresentations
Famously (or perhaps infamously), I have disagreed with LOG12 as to whether their results followed from their research. Because my comments on LOG12 have been frequently quoted out of context, and misrepresented, I have felt the need to comment on this matter at a number of sites where I would not normally comment (which need not be a reflection on the site, just my limitted time), and have seen the persistent and viturapetive attacks on Lewandowski first hand. Today I came across the perfect description of that ongoing attack on Lewandowdki. It definitely falls into the "I wish that I said that" category. Here it is:
"My beef with The Conversation is that they have built a great business on the back of contributions from academic authors but due to lazy, inconsistent and also IMO cowardly moderation, they frequently allow climate trolls free reign to trash the discussion. The cyberstalking of Lewandowsky, no matter what you think of his research is an attempt to intimidate and it is a disgrace that it is allowed by TC."
(Mike Hansen, ATTP, October 23, 2014 at 10:22 am, my emphasis.)
-
ubrew12 at 13:36 PM on 23 October 2014Another global warming contrarian paper found to be unrealistic and inaccurate
Rob Honeycutt @11: "it really doesn't take that much of a shift in long term projections to profoundly alter the value of a stock" Witness: Netflix. Ouch.
@16: "disruptive new market elements...[will] start replacing FF sources faster than we anticipate...the transition will get kinda messy" Wait! You mean this is a bubble economy? Who woulda thunk it?!? The old Chinese curse is "May you live in interesting times". My fear: thanks to our deniers, that is our fate, and that of our children.
lonelysalmon@15: anybody got the 'unvarnished truth' out there? Bueller? Ask Earth, lonelysalmon. It's a classic thermometer: a liquid contained in a solid bowl. Is the liquid rising? Ta Da.
-
scaddenp at 13:27 PM on 23 October 2014Another global warming contrarian paper found to be unrealistic and inaccurate
lonelysalmon, not exactly sure what you mean by unfiltered, uninterpreted?
Do you have the skill to analyze the raw oceanographic showing the oceans steady rise?
The land temperature record is more straightforward. If you here you can find links to the raw climate data record. Note the link to glacial monitoring data for indirect evidence. Somewhat more manageable data from the BEST project is here.
If you want purely unadjusted data, how are you going to compare data from when temperature was taken at 3pm to data when they changed to 9am? What about when the station moves or adds a stevenson screen? What about adjusting for urban heat island (if you dont adjust then temperatures appear to warm as city grows). Not the adjustments change the picture that much on a global basis. You might like to look at the BEST methodology for dealing with that (code and data on the site).
I would strongly suggest you over the information presented here as well for the empirical basis.
-
Tom Curtis at 13:01 PM on 23 October 2014Hansen's 1988 prediction was wrong
Talldave @20 claims, "Hansen's 1988 presentation was about emissions, as the Congressional record clearly shows."
Conveniently he neglects to link to the congressional record, where Hansen says:
"I would like to draw three main conclusions. Number one, the Earth is warmer in 1988 than at any time in the history of instrumental measurements. Number two, the global warming is now large enough that we can ascribe with a high degree of confidence a cause and effect relationship to the greenhouse effect. And number three, our computer climate simulations indicate that the greenhouse effect is already large enough to begin to effect the probability of extreme events such as summer heat waves."
Curiously, he makes no mention of emissions at all, when enumerating his three conclusions.
Later, and talking explicitly about the graph from Hansen et al (1988) which showed the three scenarios, he says:
"Let me turn to my second point which is the causal association of the greenhouse effect and the global warming. Causal association requires first that the warming be larger than natural climate variability and, second, that the magnitude and nature of the warming be consistent with the greenhouse mechanism. These points are both addressed on my second viewgraph. The observed warming during the past 30 years, which is the period when we have accurate measurements of atmospheric composition, is shown by the heavy black line in this graph. The warming is almost 0.4 degrees Centigrade by 1988. The probability of a chance warming of that magnitude is about 1 percent. So, with 99 percent confidence we can state that the warming trend during this time period is a real warming trend.
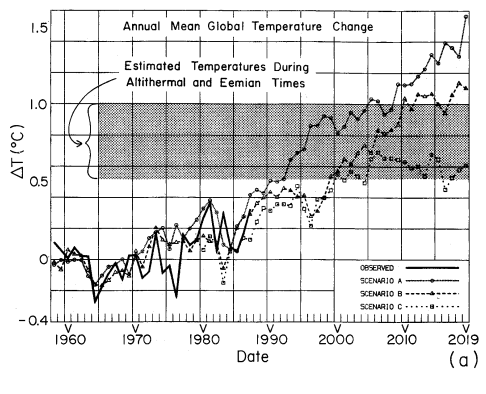
The other curves in this figure are the results of global climate model calculations for three scenarios of atmospheric trace gas growth. We have considered several scenarios because there are uncertainties in the exact trace gas growth in the past and especially in the future. We have considered cases ranging from business as usual, which is scenario A, to draconian emission cuts, scenario C, which would totally eliminate net trace gas growth by year 2000.
The main point to be made here is that the expected global warming is of the same magnitude as the observed warming. As there is only a 1 percent chance of an accidental warming of this magnitude, the agreement with the expected greenhouse effect is of considerable significance. Moreover if you look at the next level of detail in the global temperature change, there are clear signs of the greenhouse effect. Observational data suggests a cooling in the stratosphere while the ground is warming. ..."
(My emphasis)
Hansen then goes on to discuss other key signatures of the greenhouse effect.
As you recall, Talldave indicated that Hansen's testimony was about the emissions. It turns out, however, that the emissions are not mentioned in any of Hansen's three key points. Worse for Talldave's account, even when discussing the graph itself, Hansen spent more time discussing the actual temperature record, and the computer trend over the period in which it could then (in 1988) be compared with the temperature record. What is more, he indicated that was the main point.
The different emission scenarios were mentioned, but only in passing in order to explain the differences between the three curves. No attention was drawn to the difference between the curves, and no conclusions drawn from them. Indeed, for all we know the only reason the curves past 1988 are shown was the difficulty of redrawing the graphs accurately in an era when the pinacle of personal computers was the Commodore Amiga 500. They are certainly not the point of the graph as used in the congressional testimony, and the congressional testimony itself was not "about emissions" as actually reading the testimony (as opposed to merely referring to it while being carefull not to link ot it) actually demonstrates.
Ironically, Talldave goes on to say:
"This is part of what critics have accurately labelled the "three-card monte" of climate science: make a claim, then defend some other claim while never acknowledging the original claim was false."
Ironical, of course, because it is he who has clearly, and outragously misrepresented Hansen's testimony in order to criticize it. Where he to criticize the contents of the testimony itself, mention of the projections would be all but irrelevant.
As a final note, Hansen did have something to say about the accuracy of computer climate models in his testimony. He said, "Finally, I would like to stress that there is a need for improving these global climate models, ...". He certainly did not claim great accuracy for his model, and believed it could be substantially improved. Which leaves one wondering why purported skeptics spend do much time criticizing obsolete (by many generations) models.
-
zymeth at 12:59 PM on 23 October 2014Citizen scientists classify storms for the Cyclone Center
I have a great admiration to this site. It always amazes me through posting blogs which were given much time and effort to build. Well done!
Prev 657 658 659 660 661 662 663 664 665 666 667 668 669 670 671 672 Next


