


 Arguments


Recent Comments
Prev 660 661 662 663 664 665 666 667 668 669 670 671 672 673 674 675 Next
Comments 33351 to 33400:
-
Glenn Tamblyn at 03:30 AM on 24 October 2014Another global warming contrarian paper found to be unrealistic and inaccurate
Nice comment over at the Guardian about what is wrong with the Spenser/Braswell model:
"This isn't really my field, but I did study enough about Thermohaline circulation. and it's role in climate, to know that a model that treated the oceans as a non-moving fluid, is about as much use as a chocolate fireguard. "
And that commenter forgot to add Ekman Transport as well.
If you are a novice in a field it's OK to try some stuff out as a part of how you learn. But you don't do a simple version like this then run off to Congress to tell them about it!
-
Cooper13 at 01:28 AM on 24 October 20142014 Arctic sea ice extent - 6th lowest in millennia
It's quite sad how this same old 'Arctic sea ice is recovering' mishmash can get repeated every few years...
Sort of like claiming your college football team staged a comeback in a blowout game:
Qtr 1 2 3 4 Total
Wisconsin 28 21 17 0 66
Illinois 0 3 0 10 13
"But we outplayed them in the 4th quarter!!!!"
-
mitch at 01:25 AM on 24 October 2014Another global warming contrarian paper found to be unrealistic and inaccurate
While I believe there is an ethical dimension to disinvestment, the risk factor is just beginning to peek its way above the noise. So, I expect to continue seeing a trend away from fossil fuels. What are the risk factors? (1) Cost of replacement of fossil fuel inventory, (2) increased price volatility, (3) competition for energy markets by renewables, (4) reduction of fossil fuel subsidies, and (5) carbon taxes or carbon limitations.
Of the fossil fuels, coal is the most vulnerable since it has competition from natural gas as well as the renewables. We are just getting into the economies of scale for renewables, so expect that the prices will continue to drop.
The stone age didn't end for lack of stones.
-
Tristan at 01:20 AM on 24 October 2014Another global warming contrarian paper found to be unrealistic and inaccurate
scaddenp
You can have so much fun with the US siting data, as Steve Goddard likes to do. Everyone can pretend to be a scientist!
-
Tom Curtis at 22:24 PM on 23 October 2014Recursive Fury: Facts and misrepresentations
Famously (or perhaps infamously), I have disagreed with LOG12 as to whether their results followed from their research. Because my comments on LOG12 have been frequently quoted out of context, and misrepresented, I have felt the need to comment on this matter at a number of sites where I would not normally comment (which need not be a reflection on the site, just my limitted time), and have seen the persistent and viturapetive attacks on Lewandowski first hand. Today I came across the perfect description of that ongoing attack on Lewandowdki. It definitely falls into the "I wish that I said that" category. Here it is:
"My beef with The Conversation is that they have built a great business on the back of contributions from academic authors but due to lazy, inconsistent and also IMO cowardly moderation, they frequently allow climate trolls free reign to trash the discussion. The cyberstalking of Lewandowsky, no matter what you think of his research is an attempt to intimidate and it is a disgrace that it is allowed by TC."
(Mike Hansen, ATTP, October 23, 2014 at 10:22 am, my emphasis.)
-
ubrew12 at 13:36 PM on 23 October 2014Another global warming contrarian paper found to be unrealistic and inaccurate
Rob Honeycutt @11: "it really doesn't take that much of a shift in long term projections to profoundly alter the value of a stock" Witness: Netflix. Ouch.
@16: "disruptive new market elements...[will] start replacing FF sources faster than we anticipate...the transition will get kinda messy" Wait! You mean this is a bubble economy? Who woulda thunk it?!? The old Chinese curse is "May you live in interesting times". My fear: thanks to our deniers, that is our fate, and that of our children.
lonelysalmon@15: anybody got the 'unvarnished truth' out there? Bueller? Ask Earth, lonelysalmon. It's a classic thermometer: a liquid contained in a solid bowl. Is the liquid rising? Ta Da.
-
scaddenp at 13:27 PM on 23 October 2014Another global warming contrarian paper found to be unrealistic and inaccurate
lonelysalmon, not exactly sure what you mean by unfiltered, uninterpreted?
Do you have the skill to analyze the raw oceanographic showing the oceans steady rise?
The land temperature record is more straightforward. If you here you can find links to the raw climate data record. Note the link to glacial monitoring data for indirect evidence. Somewhat more manageable data from the BEST project is here.
If you want purely unadjusted data, how are you going to compare data from when temperature was taken at 3pm to data when they changed to 9am? What about when the station moves or adds a stevenson screen? What about adjusting for urban heat island (if you dont adjust then temperatures appear to warm as city grows). Not the adjustments change the picture that much on a global basis. You might like to look at the BEST methodology for dealing with that (code and data on the site).
I would strongly suggest you over the information presented here as well for the empirical basis.
-
Tom Curtis at 13:01 PM on 23 October 2014Hansen's 1988 prediction was wrong
Talldave @20 claims, "Hansen's 1988 presentation was about emissions, as the Congressional record clearly shows."
Conveniently he neglects to link to the congressional record, where Hansen says:
"I would like to draw three main conclusions. Number one, the Earth is warmer in 1988 than at any time in the history of instrumental measurements. Number two, the global warming is now large enough that we can ascribe with a high degree of confidence a cause and effect relationship to the greenhouse effect. And number three, our computer climate simulations indicate that the greenhouse effect is already large enough to begin to effect the probability of extreme events such as summer heat waves."
Curiously, he makes no mention of emissions at all, when enumerating his three conclusions.
Later, and talking explicitly about the graph from Hansen et al (1988) which showed the three scenarios, he says:
"Let me turn to my second point which is the causal association of the greenhouse effect and the global warming. Causal association requires first that the warming be larger than natural climate variability and, second, that the magnitude and nature of the warming be consistent with the greenhouse mechanism. These points are both addressed on my second viewgraph. The observed warming during the past 30 years, which is the period when we have accurate measurements of atmospheric composition, is shown by the heavy black line in this graph. The warming is almost 0.4 degrees Centigrade by 1988. The probability of a chance warming of that magnitude is about 1 percent. So, with 99 percent confidence we can state that the warming trend during this time period is a real warming trend.
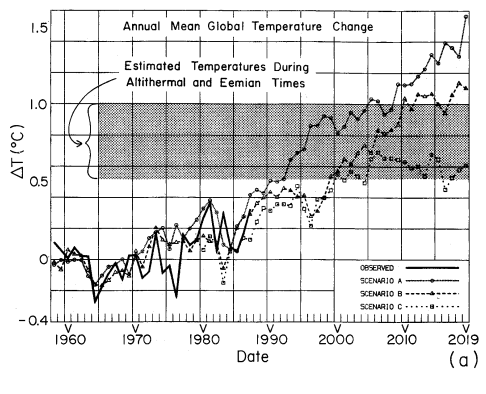
The other curves in this figure are the results of global climate model calculations for three scenarios of atmospheric trace gas growth. We have considered several scenarios because there are uncertainties in the exact trace gas growth in the past and especially in the future. We have considered cases ranging from business as usual, which is scenario A, to draconian emission cuts, scenario C, which would totally eliminate net trace gas growth by year 2000.
The main point to be made here is that the expected global warming is of the same magnitude as the observed warming. As there is only a 1 percent chance of an accidental warming of this magnitude, the agreement with the expected greenhouse effect is of considerable significance. Moreover if you look at the next level of detail in the global temperature change, there are clear signs of the greenhouse effect. Observational data suggests a cooling in the stratosphere while the ground is warming. ..."
(My emphasis)
Hansen then goes on to discuss other key signatures of the greenhouse effect.
As you recall, Talldave indicated that Hansen's testimony was about the emissions. It turns out, however, that the emissions are not mentioned in any of Hansen's three key points. Worse for Talldave's account, even when discussing the graph itself, Hansen spent more time discussing the actual temperature record, and the computer trend over the period in which it could then (in 1988) be compared with the temperature record. What is more, he indicated that was the main point.
The different emission scenarios were mentioned, but only in passing in order to explain the differences between the three curves. No attention was drawn to the difference between the curves, and no conclusions drawn from them. Indeed, for all we know the only reason the curves past 1988 are shown was the difficulty of redrawing the graphs accurately in an era when the pinacle of personal computers was the Commodore Amiga 500. They are certainly not the point of the graph as used in the congressional testimony, and the congressional testimony itself was not "about emissions" as actually reading the testimony (as opposed to merely referring to it while being carefull not to link ot it) actually demonstrates.
Ironically, Talldave goes on to say:
"This is part of what critics have accurately labelled the "three-card monte" of climate science: make a claim, then defend some other claim while never acknowledging the original claim was false."
Ironical, of course, because it is he who has clearly, and outragously misrepresented Hansen's testimony in order to criticize it. Where he to criticize the contents of the testimony itself, mention of the projections would be all but irrelevant.
As a final note, Hansen did have something to say about the accuracy of computer climate models in his testimony. He said, "Finally, I would like to stress that there is a need for improving these global climate models, ...". He certainly did not claim great accuracy for his model, and believed it could be substantially improved. Which leaves one wondering why purported skeptics spend do much time criticizing obsolete (by many generations) models.
-
zymeth at 12:59 PM on 23 October 2014Citizen scientists classify storms for the Cyclone Center
I have a great admiration to this site. It always amazes me through posting blogs which were given much time and effort to build. Well done!
-
Rob Honeycutt at 11:09 AM on 23 October 2014Another global warming contrarian paper found to be unrealistic and inaccurate
The big impacts on oil production are going to be on the demand side rather than anything to do with divestment, like suggested earlier with a major shift to electric vehicles. But what divestment does do is, it starts to price FF securities more accurately relative to the inherent risks that lay ahead, which can soften the potential impact it has on global economies.
Part of my own concern is, I think disruptive new market elements, like EV's and solar & wind, are actually going to start replacing FF sources faster than we anticipate. The market value of these new elements need to effectively balance out the massive market value of the legacy FF industry.
It's nice to think one will just nicely supplant the other, but my guess is the transition will get kinda messy instead.
-
lonelysalmon at 11:09 AM on 23 October 2014Another global warming contrarian paper found to be unrealistic and inaccurate
I am new ro this site. Please, someone point me to the unfiltered emperical evidence that global-warming is happening. The raw data if you will. I just want to understand the issue from the purely empirical evidence without anyone else's interpretations involved. Is that out there anywhere?
-
Bob Loblaw at 10:39 AM on 23 October 2014Another global warming contrarian paper found to be unrealistic and inaccurate
Dropping share prices makes it harder to borrow money and fund new projects. What bank would have lent money to Bre-X the week after the scandal hit?
Perhaps major oil companies have enough loose cash to not worry about banks, but droppng share prices would not be good.
-
Bob Loblaw at 10:34 AM on 23 October 2014Another global warming contrarian paper found to be unrealistic and inaccurate
Looking at that statement about models from Spencer, it would seem that Spencer wants modellers to have just one opportunity to get things right. No second chances.
On that basis, we must evaluate Spencer and Christy's work on MSU satellite derivations of atmospheric temperature by restricting ourselves to their first version. To look at how they have "curve fitted" their results, take a look here. (It's in figure 2.)
Of course, in the real world of science, perfection is rarely obtained on the first go. You start with a model, see what it gets wrong, and then try to improve the model. Even Newton didn't quite get the laws of motion right, and physicist are still trying to figure out how to connect gravity with all the other forces in a Universal Theory.
-
Tom Curtis at 09:55 AM on 23 October 2014Greenhouse Effect Basics: Warm Earth, Cold Atmosphere
unspecial @101, first thankyou. It is nice to know the effort involved is appreciated.
Turning to your questions:
1) With the removal of all CO2 temperatures would plumet. Of necessity, we can only determine by how much using models, and the best attempt to run this experiment that I am aware of is in Lacis et al (2010). They show global temperatures falling to -21 C with the removal of all CO2, a reduction of 35 C from the current average. By latitude, the reduction of temperatures looks like this:

You will notice that temperatures above freezing are only found in a small band north of the equator. That means that essentially the entire ocean is frozen. However, Lacis et al (2010) is not a complete answer in that their model did not allow the growth of ice sheets and glaciers. The further loss of albedo from that growth would in fact reduce global temperatures further still.
2) It is more difficult to say how temperatures would change with a 100% CO2 atmosphere as I am unaware of any attempts to model that situation. Using the modtran model (used to produce the third image in the OP), we can show that the initial reduction in outgoing radiation looks like this:

The initial reduction in upward IR radiation at the top of the atmosphere is very large (approximately 50 W/m^2), but not as severe as that on Venus due to the lower atmospheric pressure and altitude. There will be a further initial reduction not shown in the modtran model because a pure CO2 atmosphere would have a higher lapse rate.
Taking the 50 W/m^2 and a Equilibrium Climate Sensitivity of 3 C per doubling, that would yield a mean global surface temperature of 13.5 C above current values, or around 28 C. The figure is very approximate because climate sensitivity increases with increasing temperatures over a small increase due to the fact that water vapour concentration will increase with the fourth power (square of the square of) the increase in temperature. The real increase may be between half to double that (ie, 21 to 42 C GMST). Because increased greenhouse effect reduces the temperature difference between poles and equator, the net effect would be tropical or greater temperatures across the entire globe.
It should be noted that we would not get a runaway greenhouse effect as occurred on Venus. That is because the sunlight is too weak at this distance from the Sun to initiate the process. (A more technical explanation is given here.)
3) The altitude at which 50% of the IR from the ground is absorbed will depend on water vapour content in the atmosphere, and cloud height, and so will vary from place to place. Typically it will occur within a kilometer of the surface. Of course, the upward IR radiation from the ground in the frequencies in which it is absorbed will be replaced by an almost equal amount of upward IR radiation from the lower atmosphere, which is very close in temperature to the ground.
-
scaddenp at 09:28 AM on 23 October 2014Another global warming contrarian paper found to be unrealistic and inaccurate
What I dont see is how a drop in the share price value affects the amount of oil flowing or the size of the dividend per share for that matter. The recent drop in oil prices, largely due to fracking, would have a bigger impact on share price/dividend than any ethical divestment.
-
Rob Honeycutt at 08:38 AM on 23 October 2014Another global warming contrarian paper found to be unrealistic and inaccurate
scaddenp... But it's the risk element that should be driving fund manager decisions.
Maybe some of these folks are making the decision on ethics basis, but I really doubt it's many. I would think their decisions are more influenced by risk assessments.
Remember, it really doesn't take that much of a shift in long term projections to profoundly alter the value of a stock when you're talking about a security, like XOM, that's trading at 12X earnings.
The total market value for the FF industry is huge. A collective repricing of the value of that industry could erase a significant amount of total value in the global economy, with a fairly significant ripple effect. The housing bubble had pretty significant impacts. If markets don't take these risks into account in pricing FF stocks, a shift in value could be worse.
-
scaddenp at 08:23 AM on 23 October 2014Another global warming contrarian paper found to be unrealistic and inaccurate
I dont think ethical divestment sends much of meaningful message for oil companies. For coal its is bigger issue because it could eventually create difficulties with getting needed capital but that doesnt apply to oil. If fund managers divest because they dont think the companies will make much of profit, then that's a message but ethical choices? I cant see how that can translate into any behaviour change that would reduce CO2. Viable electric cars on the hand on the other hand are a serious risk.
-
Rob Honeycutt at 07:34 AM on 23 October 2014Another global warming contrarian paper found to be unrealistic and inaccurate
This may be straying off topic, but divestment must have a chilling effect on the FF industry.
Essentially, up until recently, fund managers have kept a certain percentage of their holding is the FF industry because it's been a safe, steady place to keep part of your assets. The message is starting to come across that, well, that may not necessarily be the case.
FF industry stocks are priced on the assumption that they can continue to extract oil, at projected rates, for the next ~15 years. And the industry is investing in exploration to support those projections. So, in buying and/or holding those positions you're essentially agreeing to those forward-looking assumptions. And for the past, what, 80+ years those have been good assumptions, with the occasional hiccup here and there.
Now, what happens when we start to see broad international agreements that we can't continue to extract and burn FF's the way we have for the past 80+ years? What happens if we see the next 10 years of accelerating surface temps confirming beyond anyone's sense of doubt that AGW is, in fact, real?
It wouldn't take much of a shift in the extraction rate to significantly change the value of those equities. Suddenly, that safe location for your assets looks a lot less stable. I think fund managers are starting to see the light here.
FF companies are already starting to bake in a price for carbon into their financials. As long as the FF industry and money markets can start accounting for the potential financial risks, then that's a good thing. We can have a fairly soft landing over the coming 30 years. If they all ignore these risk and toddle along like nothing is going to change, then we're going to see a pretty ugly correction in the future.
Like DSL says, it is coming and it is inevitable. We can do it the easy way or the hard way. But it is coming.
I would have to question the wisdom of anyone claiming that, "The reality is our economy and indeed the world economy is going to be dependant on fossil fuels for decades to come..."
That's political posturing, not rational thinking. I think the FF industry is very concerned about the direction things are headed and they're trying to stave off the inevitable as long as they can. If they were that sure of their market, they wouldn't be buying politicians the way they are.
Think of it. Even just with the auto fuel market, electrics have a significant potential to be cheaper and better than internal combustion cars... in just a few years. Gasoline accounts for 45% of oil use (LINK). Over a decade one of their most important revenue streams may start to significantly dry up.
The FF industry is literally staring down the abyss.
-
DSL at 05:09 AM on 23 October 2014Another global warming contrarian paper found to be unrealistic and inaccurate
I disagree with your assumptions about what divestment means. In order for change to take place, a shift away from business as usual must occur. Divestment is a strategy aimed at facilitating transition. Divestment is not an immediate, debilitating attack on the fossil energy economic structure. This is the message: energy corporations/companies can and should help transition toward the next human energy regime. It's coming. It's unavoidable. It's easier to get to the next stage when we still have abundant fossil reserves. Today, not tomorrow. That's the unpalatable truth.
-
Ashton at 04:36 AM on 23 October 2014Another global warming contrarian paper found to be unrealistic and inaccurate
DSL Quite obviously I am not making it plain that my comment "holding what appear to be opposing views" referred only to the VC of ANU who on the one hand realises that the world will be dependant on fossil fuels for decades yet on the other thinks that the companies involved with fossil fuels should not be a part of the ANU investment portfolio. Surely if these companies are necessary to the world and will be for "decades" why should ANU not have these companies in its investment portfolio. Not having these companies could well impact unfavourably on the portfolio but having them will not mean ANU is supportive of these companies but is recognising what is to some, an unpalatable truth.
-
WheelsOC at 02:50 AM on 23 October 2014Another global warming contrarian paper found to be unrealistic and inaccurate
@BojanD:
I think Spencer is too smart to not know how wrong this is. But no matter how wrong it is, the casual observer will notice the tuning part and just assume that all models do this, it's just a matter of how sophisticated they are in doing it. That's why any kind of denial is successful.Don't give him too much credit there. He seems to have a woefully simple (mis)understanding of what's involved in modeling the climate, and applies that misunderstanding consistently in his own papers. From his blog post How Do Climate Models Work?:
The modelers will claim that their models can explain the major changes in global average temperatures over the 20th Century. While there is some truth to that, it is (1) not likely that theirs is a unique explanation, and (2) this is not an actual prediction since the answer (the actual temperature measurements) were known beforehand.
If instead the modelers were NOT allowed to see the temperature changes over the 20th Century, and then were asked to produce a ‘hindcast’ of global temperatures, then this would have been a valid prediction. But instead, years of considerable trial-and-error work has gone into getting the climate models to reproduce the 20th Century temperature history, which was already known to the modelers. Some of us would call this just as much an exercise in statistical ‘curve-fitting’ as it is ‘climate model improvement’.
This looks very much like the kind of "modeling" Spencer's papers with Braswell have been about.
-
DSL at 01:37 AM on 23 October 2014Greenhouse Effect Basics: Warm Earth, Cold Atmosphere
unspecial, I suspect you'll be getting a detailed answer shortly, but in the meantime, Lacis et al. 2013 provides a few of the answers.
-
DSL at 01:32 AM on 23 October 2014Another global warming contrarian paper found to be unrealistic and inaccurate
Ashton, what view is that opposing? Has someone said, "There's no way that the global economy is going to be dependent on FF over the next few decades"? There are certainly people who want that dependency to be gone within a few decades (don't you?), but the vast majority understand that fundamental change for an integrated, global system that has cultural, political, and economic momentum isn't going to happen overnight. I fail to see what this has to do with the two groups you identify.
-
unspecial at 01:25 AM on 23 October 2014Greenhouse Effect Basics: Warm Earth, Cold Atmosphere
I was a 'climate skeptic' because until reading this page I have never come across a satisfactory explanation of exactly how the GHE works. Well done and thanks to everyone who has contributed to this page. One thing I have always found helpful in understanding things is considering limits so maybe someone can answer these two questions. How would temperatures at ground level change if all CO2 was removed from the atmosphere? How would temperatures at ground level change if all the atmosphere was 100% CO2 and the average air pressure at sea level the same as now? I'm also curious as to what height is 50% of the ground IR radiation converted to heat in the atmosphere.
-
MA Rodger at 01:17 AM on 23 October 2014Medieval Warm Period was warmer
bvangerven @224.
The talk of Romans and Alpine passes sounds like some of the nonsense that followed on from Kurt Nicolussi's "Green Alp" glacier theory that dates back to 2005. After a lot of noise, the evidence led to some better understanding of the microclimates in the Alps but had a big zero implications for climate on a regional or global scale.
-
tanelorn26 at 01:08 AM on 23 October 2014Global warming: a battle for evangelical Christian hearts and minds
I think if I just stick to the facts, cite my sources, and keep it polite, I'll be fine.
Thanks!
-
Ashton at 00:55 AM on 23 October 2014Another global warming contrarian paper found to be unrealistic and inaccurate
Whether the science is or isn't settled seems irrelevant. As the VC of the Australian National University has just commented to a Senate estmates hearing "“The reality is our economy and indeed the world economy is going to be dependant on fossil fuels for decades to come,”. That fact seems totally overlooked in the bickering that occurs between those who are convinced climate change is entirely due to humans and those who are less certain of that. It is surprising that the VC of the ANU who, a couple pf weeks ago, jettisoned the University's holdings in fossil fuel related companies has that view. But it does show that it is not impossible to simultaneously hold what appear to be opposing opinions.
-
Hansen's 1988 prediction was wrong
TallDave - Um, no. Emissions more closely tracked Hansens Scenario C in terms of total forcings, as shown here.

Those emission scenarios were "what-if" cases (not predictions) of economic activity, which are not in and of themselves climate science. Any mismatch of between those scenarios and actual events would only be an issue if Hansen was writing on economics, not on climate. He could hardly have predicted the Montreal Protocols on CFC's, for example.
"suffice it to note" - Strawman WRT to satellite temps, as Hansen was discussing surface temperatures and not mid-tropospheric temperature; you're attempting to attack something that wasn't discussed in his paper.
Yes, that 1988 paper is now out of date. Amazingly, though, it's frequently brought up and attacked on 'skeptic' websites, as if it represented current information - so it's quite reasonable to discuss these attacks on SkS as the current denial myths they are.
The real question is whether the model performs well in replicating temperatures given particular forcings - and since it does, it was a pretty decent model. The predictions of the paper were not "either Scenario A, B, or C will occur", but rather "Given a set of stated emissions, here's what the temperatures are likely to be", establishing a relationship between concentrations of forcing agents, and temperatures.
The major problem with his 1988 predictions came down to slightly too high a sensitivity to forcings (4.2 C/doubling of CO2, rather than ~3.2). This was strongly influenced by the radiative models and available data of the time, with the simplified expression at the time for CO2 forcing being 6.3*ln(C/C0). That constant was updated a decade later by Myhre et al 1998 to 5.35*ln(C/C0). Hansen used the data he had at the time, and his sensitivity estimate was a bit high.
If Hansen had time-traveled a decade and used that later estimate, his input sensitivity would have been ~3.57 C/doubling of CO2 - and his emissions to temperature predictions for the next 25 years would have been astoundingly accurate.
Your comment is a collection of strawmen arguments, and rather completely misses the point of the Hansen 1988 paper. It drew conclusions regarding the relationship of greenhouse gases and temperatures, not on making economic predictions. If you're going to disagree with it, you should at least discuss what the paper was actually about.
-
Tristan at 00:25 AM on 23 October 2014Hansen's 1988 prediction was wrong
TallDave, you say: "Actual global emissions look like Scenario A (if mainly because of China)."
Except, that if you read the link in the post directly above your own, you find information to the contrary. Perhaps you'd care to present your alternative data, that demonstrates that emissions(or even better, forcings) do in fact look like scenario A. -
DSL at 23:57 PM on 22 October 2014Medieval Warm Period was warmer
bvangerven--
1. "The earth is now definitely cooler than during the Roman Warm Period"
It's fairly clear from global Marcott et al. 2013 that the Roman Warming Period was not globally warmer than the present.
2. "There are passes in the Alps that the Romans used, today they are covered in ice. The tree line was hundreds of meters higher 3000 years ago, we still find remnants of trees under glaciers."
Note regional Marcott. The Northern hemisphere (north of 30) was likely warmer than present (though Marcott's uncertainty for 20th c. temps is large). It may be that the Alps were responding to a greater forcing during the RWP. How about the rest of the globe? Take a look at Funder et al. 2011 and see if the RWP is noticeable (note that Funder ends in 2000).
Regardless, what's the point? Even if the RWP were warmer than present, what would it mean, other than the possibility that climate sensitivty is greater than the current mainstream range? If the RWP was warmer, does it mean that global warming is going to stop?
-
TallDave at 23:43 PM on 22 October 2014Hansen's 1988 prediction was wrong
Several obvious problems here.
First, Hansen's 1988 presentation was about emissions, as the Congressional record clearly shows. Actual global emissions look like Scenario A (if mainly because of China). Yes, the forcings in the model depend on concentrations, but the fact that methane or CO2 concentrations didn't do what the model expected are failures of Hansen 1988 to accurately model the relationship of emissions to concentrations. This is part of what critics have accurately labelled the "three-card monte" of climate science: make a claim, then defend some other claim while never acknowledging the original claim was false. This is not how good science is done.
Second, the graph purports to measure whether Hansen 1988 made accurate predictions, but it doesn't start in 1988. To show the hindcast (which the model was deliberately tuned to!) is another kind of three-card monte.
One can quibble with the choice of the GISS surface temperature record, given that Hansen himself administered it, but the divergence from satellite doesn't really affect the conclusions, so suffice it to note the 1988 prediction looks slightly worse using UAH or RSS.
Another minor quibble is that the article is now somewhat out of date — we're well into the 2010s and the predicted warming is still not materializing. This also makes the prediction slightly more wrong.
Last, and most risibly, the resemblance of actual temperatures to Scenario C predictions is now being held up as vindication. Even if that were defensible on the merits, it would certainly have come as a great shock to Hansen and his audience in 1988. Imagine a time traveler arriving from 2014, barging into Senate hearings brandishing the satellite record and yelling "Hansen was right! Look, future temperatures are just like Scenario C!" The obvious conclusion would have been "oh good, there's no problem then."
As this is an advocacy site, I do not expect these errors to be corrected, I merely state them for the record so visitors to the site can draw their own conclusions. -
BaerbelW at 21:01 PM on 22 October 2014From Pole to Pole - a climate-themed tour through a zoo
Thanks much, Tom!
-
tanelorn26 at 20:21 PM on 22 October 2014Global warming: a battle for evangelical Christian hearts and minds
Hi folks, need a little advice, in correcting some information contained in our small town newspaper written by Joe D'Aleo, it seems that Dr legates has come to his defense regarding the Cornwall alliance. It seems Joe is taken to writing Alex Jones style diatribes, im not sure i can devote the time to continue to correct his misrepresentations? I'm a not a scientist, and I think I'm a bit over my head. Any advice or assistance would be appreciated. I know a little bit about these folks, and as I learn more, I'm shocked by what they espouse.
Thanks
-
bvangerven at 19:07 PM on 22 October 2014Medieval Warm Period was warmer
Hi,
I encountered the following argument:
<statement>The earth is now definitely cooler than during the Roman Warm Period.
There are passes in the Alps that the Romans used, today they are covered in ice.
The tree line was hundreds of meters higher 3000 years ago, we still find remnants of trees under glaciers.</statement>
I have no idea if these statements are correct, can anyone point me to the relevant literature ?
-
BojanD at 17:41 PM on 22 October 2014Another global warming contrarian paper found to be unrealistic and inaccurate
@ubrew12, agree! I noticed this quote in particular:
"In the end, they end up with a bunch of tunable parameters, which they adjusted so that the model output matches the measured temperature history."
I think Spencer is too smart to not know how wrong this is. But no matter how wrong it is, the casual observer will notice the tuning part and just assume that all models do this, it's just a matter of how sophisticated they are in doing it. That's why any kind of denial is successful. -
Tom Curtis at 17:04 PM on 22 October 2014From Pole to Pole - a climate-themed tour through a zoo
Outstanding post. Well done.
-
Tom Curtis at 17:01 PM on 22 October 2014Why ice sheets will keep melting for centuries to come
To give more perspective on future rates of sea level rise, here is the upper limit of sea level rise by 2100 as estimate by Jevrejevya et al (2014):

And the time series of sea level rise from the same paper:

The rate of increase at the upper limit from 2080-2100 is approximately 3 meters per century.
And the sea level rise (with uncertainties) out to 2300 as estimated by a Semi Empirical Model by Jevrejevya et al (2011):

(Follow the link for estimates out to 2500, and for scenarios other than RCP 8.5) These estimates give a higher value than the IPCC expected range, but must certainly be considered reasonable. It is interesting to note that the maximum rate of sea level rise over a century, and at the upper confidence level is again about 3 meters per century (from 2150-2250).
Given this data, I think it is reasonable to set policy on an expectation of 1-1.5 meters of sea level rise over this century, and a rate of sea level rise around 2 meters per century for the following two centuries. Both are higher than medium, or mean values. However, damages rise with increased rapidity of sea level rise, so that cost weighted expectations (ie, the expectations that should be used for policy) will be higher than the mean or median values.
I do not, however, see anything in Grant et al (2014) to contradict such estimate, nor reason to think the IPCC is significantly inerror in their estimates.
-
ubrew12 at 15:18 PM on 22 October 2014Another global warming contrarian paper found to be unrealistic and inaccurate
"The Science isn't settled" One of the advantages of denial is that once Curry and Spencer publish their (predictably) super-low estimates of climate sensitivity, the necessary rebuttal process (by illuminating their mistakes) supports the central denial claim ("The Science isn't settled"). When your object is to sow confusion, even losing an argument allows you to win: there was an argument. Certainly Curry and Spencer, and their backers, know this, and don't care. Anymore than someone tagging a bridge with X-rated grafitti cares that someone else will eventually show up to, slowly and laborously, repaint the bridge. Their purpose is anarchy, like so much of modern conservatism. They are saying nothing gets done, if it can't get done their way.
-
sidd at 10:14 AM on 22 October 2014Why ice sheets will keep melting for centuries to come
1)It is unfair to judge IPCC AR5 in light of results such as this, since the paper was published long after the review period closed.2)Glacial-interglacial SLR may be the wrong analog for present day forcings. Consider rather, the ANDRILL results, eg Pollard(2009) doi:10.1038/nature07809 from Pliocene and early Pleistocene
sidd
-
rkrolph at 09:34 AM on 22 October 2014Another global warming contrarian paper found to be unrealistic and inaccurate
Aren't these the kind of inaccuracies that peer review is supposed to weed out? I guess not always; I remember back when cold fusion made it through.
-
Tom Curtis at 09:16 AM on 22 October 2014Why ice sheets will keep melting for centuries to come
sidd @12, thankyou.
CBDunkerson @10 (Cont), the IPCC says the following about sea level rise:
"For the period 2081–2100, compared to 1986–2005, global mean sea level rise is likely (medium confidence) to be in the 5 to 95% range of projections from process based models, which give 0.26 to 0.55 m for RCP2.6, 0.32 to 0.63 m for RCP4.5, 0.33 to 0.63 m for RCP6.0, and 0.45 to 0.82 m for RCP8.5. For RCP8.5, the rise by 2100 is 0.52 to 0.98 m with a rate during 2081–2100 of 8 to 16 mm yr–1. We have considered the evidence for higher projections and have concluded that there is currently insufficient evidence to evaluate the probability of specific levels above the assessed likely range. Based on current understanding, only the collapse of marine-based sectors of the Antarctic ice sheet, if initiated, could cause global mean sea level to rise substantially above the likely range during the 21st century. This potential additional contribution cannot be precisely quantified but there is medium confidence that it would not exceed several tenths of a meter of sea level rise during the 21st century."
Note that their likely rate of rise for 2080-2100 given RCP 8.5 is 0.8 to 1.6 meter per century. For the mid value, and assuming an exponential rate of increase, that represents an acceleration of 1.75% per annum. Given that rate of increase, in 180 years the rate of sea level rise would be 6.8 meters per century, well beyond the upper rate of sea level rises shown in this study, and at half the time to a "peak" rate of increase of sea level shown in this study. More plausibly, if we do reach the peak rate of increase by 2200, the rate of increase will decelerate as we approach that peak yielding a lower value for the peak rate, but still well within the upper range of sea level rise.
I am not making any predictions here that the rate of sea level rise will peak within 200 years, or that it will reach 5 meters per century. I am merely pointing out that this study is entirely compatible with current IPCC estimates, ie, of a likely increase of 0.52 to 0.98 m by 2080-2100 under RCP 8.5. Put another way, for approx 1 meter to be the lower bound on sea level rise by the end of this century, we must expect 1.6 meters per century to be the lower bound on the rate of sea level rise in the same period, with maximum rates of sea level rise by 2200 well above 5 meters a century. This study does not support such rates. If anything it precludes them.
In short, I don't think just below 1 meter is a reasonable lower bound on expected sea level rise for this century. That is not because I do not expect rapid rates by the end of the century, but because we are starting from a (relatively) low base. Overall I am still inclined to accept the IPCC stated rates.
-
sidd at 07:22 AM on 22 October 2014Why ice sheets will keep melting for centuries to come
" If by "maximum retreat" they mean "maximum rate of retreat" "
yes
 Moderator Response:
[RH] Modified image size and added zoom feature (at least, tried to add the zoom feature...)
-
wili at 05:09 AM on 22 October 20142014 SkS Weekly News Roundup #42B
Another article/topic to consider for inclusion in the next News Roundup:
Betting on Negative Emissions Fuss et alia, Nature Climate Change (online), 21 September 2014.
Essentially, we are more and more relying on unproven or undeveloped technology (AKA pixie dust) to even imagine non-catastrophic climate futures in the coming decades.
-
Climate Bob at 04:34 AM on 22 October 2014Ocean Warming has been Greatly Underestimated
If there are markers in the sea how long does it take for Gulf Stream water that sinks off Norway to resurface in Antarctica? http://www.climateoutcome.kiwi.nz/blog/global-warming-pause
-
Tom Curtis at 02:50 AM on 22 October 2014Why ice sheets will keep melting for centuries to come
CBDunkerson @10, just briefly in relation to your last point, here is the graph of the sea level rise reconstruction from the paper (fig 2):

It is fairly easy to see that some of the sea level rises took longer than 1.1 k (0.11 of the graduations). Indeed, some took more than than 10 thousand years, although they may have proceeded by stops and starts.
Further, the abstract of the paper says, "We also find that maximum sea-level rise rates were attained within 2 kyr of the onset of deglaciations, for 85% of such events." If in fact the paper found that 95% of melt periods lasted 1100 years or less, the claim in the abstract is very weak.
What the post above claims is that:
"In the 120 different events we looked at, ice sheets went from initial change to maximum retreat within 400 years 68% of the time, and within 1100 years for 95%. In other words: once triggered, ice sheet reduction (and therefore sea level rise) kept accelerating relentlessly for many centuries."
If by "maximum retreat" they mean "maximum rate of retreat", that brings the post into line with the abstract and the graph. If not, and they mean 400 (68%) and 1100 (95%) years from inception of melt to maximum sea level rise, there does appear to be a conflict between the claim and the data presented.
At the moment I am interested if anybody with access to the full paper can clarify which claim is meant. I shall return to the other points tomorrow.
-
CBDunkerson at 21:56 PM on 21 October 2014Why ice sheets will keep melting for centuries to come
Tom, all good points. However, I think the second is covered by the different ice volume conditions covered in the study (since area should be fairly closely correlated with volume) and the third may be largely responsible for the range of variation in sea level rise the study found for given ice volumes... suggesting that at best, modern sea level rise might be on the lower end of that range if the zenith angle is a more significant factor than the warming rate.
I don't have a good feel for how quickly the equilibrium can shift, but haven't we already observed increasing rates of sea level rise? Likewise, the breakup of various ice shelves has taken place quite 'rapidly'. It is clear that Greenland is losing ice mass, and I think the evidence that Antartica is now doing so as well has become fairly solid. You note glacier growth in the 19th century, but do individual 'small' glaciers have the same 'equilibrium period' as the ice sheets on Greenland and Antarctica? In any case, the vast majority of glaciers have clearly been in retreat for decades now... suggesting (to me) that we are well past equilibrium temperature for them. Indeed, I recall reading a study that found glacier retreat began from natural causes even before significant AGW kicked in... suggesting that we were already on the 'retreat' side of the equilibrium point even before adding in AGW.
Intuition can certainly be wrong, but in this case there is also data... both from this proxy study and studies of recent sea level rise. Would you agree that data seems to be trending towards setting a 'lower bound' of possible sea level rise by 2100 not much below one meter?
I think one of the most significant findings of this study was that most melt periods lasted less than 400 years and nearly all less than 1100. That all but rules out estimates that the ice melt / sea level rise from AGW could take thousands of years. It also suggests (to me) that the onset, even with vastly slower natural warming of past melt periods, cannot take hundreds of years... it should be decades, and if data showing Antarctica losing ice mass is accurate then those decades have apparently already passed.
-
Tom Curtis at 01:12 AM on 21 October 2014Why ice sheets will keep melting for centuries to come
CBDunkerson @8:
1) Plausibly, the rate of ice melt is a function of the difference in temperature between the current temperature and the temperature at which the remaining ice would be in equilbrium. Given that in the 19th century, glaciers were expanding, it follows that they were at or below the equilibrium temperature and that hence we are not far of the equilibrium temperature for the current extent of ice sheets. On these assumptions, a rapid temperature rise will rapidly increase the disequilibrium and hence the rate of ice melt but need not do so significantly for several decades.
2) Plausibly the rate of ice melt is a function of exposed surface area of the ice, or perhaps the exposed edges of the ice sheets. The much smaller ice sheets current would therefore have a much smaller melt rate than those in the LGM to Holocene transition. Coupling both intuitions, we would need a far greater disequilibrium to generate the same rate of ice melt with todays smaller ice sheets.
3) Plausibly the rate of ice melt is also a function of the zenith angle of the sun durring the season of maximum melt. That zenith angle partially determines the rate at which energy can be absorbed by the ice sheet. The LGM - holocene ice melt had ice sheets at much lower latitudes and far greater summer insolation in the Arctic, both contributing to significantly higher zenith angles than is currently the case.
I am not saying that these intuitions are correct (although I strongly suspect the first two are, and think the third likely). My point is that they are reasonable intuitions that run counter to the intuition you rely on to conclude a very rapid ice melt (sea level rise). Given that there are plausible counter intuitions, I do not think we can rely on your intuitive argument.
-
CBDunkerson at 22:28 PM on 20 October 2014Why ice sheets will keep melting for centuries to come
Given that the current warming rate is vastly greater than anything in the natural record for the time period of this study, it stands to reason that the sea level rise rate should be at least as great as seen in past periods with similar amounts of ice. That apparently comes out to ~1.25 meters per century... which is consistent with some of the latest estimates (e.g. Rahmsdorf) of sea level rise by 2100 based on the currently observed rate of increase.
What this data, or any study of past climate change, is unlikely to be able to help us with any time soon is understanding how much greater the melt rate might be with the accelerated warming we are seeing, and how much of that future melt/sea level rise could be stopped if we succeed in reducing GHG emissions. There just haven't been any comparable situations which we can study.
-
CBDunkerson at 21:36 PM on 20 October 20142014 SkS Weekly News Roundup #42B
Miguelito, well...
The study doesn't say whether "it can work". Just that, currently, it doesn't. Could sensible regulations, better leakage controls, and carbon pricing allow natural gas to 'save the planet' by ending global warming? Maybe, but saying 'yes' based on this study is even less accurate than saying 'no'.
That said, to me it seems likely that the costs which would have to be added to natural gas in order to make it environmentally beneficial would also make it economically unfeasible. Solar and wind are already dropping below grid electricity rates in many countries. A carbon price reflecting the true cost of fossil fuels would instantly shift that to most of the people on the planet being able to get power from renewables more cheaply.
-
gpwayne at 15:57 PM on 20 October 20142014 SkS Weekly News Roundup #42B
Note to SkS: could you correct the error in which the Guardian article about Richard Tol is attributed to 'Bud' Ward, instead of his actual name - Bob?
Thanks...
Moderator Response:[JH] Correction made. Thanks for bringing this to our attention.
Prev 660 661 662 663 664 665 666 667 668 669 670 671 672 673 674 675 Next


