


 Arguments


Recent Comments
Prev 690 691 692 693 694 695 696 697 698 699 700 701 702 703 704 705 Next
Comments 34851 to 34900:
-
Roger D at 08:20 AM on 29 July 2014Nigel Lawson suggests he's not a skeptic, proceeds to deny global warming
Donny - others with more detailed knowledge can add to my 'answer', but i believe the IPCC has done your "survey" already by literature review and determined that responses from experts attribute from more than half to more than 100% of the observed global average temperature increas to anthropogenic sources. Also, I suspect there are better ways to look at the problem than simply projecting a post LIA temperature trend into the 1900's and assuming the difference between that and observed is anthropogneic, if such a projection even made sense.
-
scaddenp at 08:19 AM on 29 July 2014Nigel Lawson suggests he's not a skeptic, proceeds to deny global warming
Donny, I have replied to you here which is the appropriate thread. Please also read the main article. You can use the Search function on top left page to find appropriate places for comments.
-
scaddenp at 08:17 AM on 29 July 2014We're coming out of the Little Ice Age
Replying to comment from here.
Donny, first point of call for any question like this has to be IPCC WG1. You want the chapter of paleoclimate, and eg Fig 5.7.
Do you accept the physics law of conservation of energy? Assuming you do, then warming of the surface is a change in the energy flow. Apart from ocean-atmosphere heat exchanges, then warming or cooling are due to changes in forcings. These can be natural or man-made. To accept the idea that "half the change" is natural, then you need evidence that there is a natural forcing, operating since LIA, of about the same magnitude as anthropogenic forcing. That evidence is tough to find.
Instead LIA (which is much more pronounced in NH) is adequately accounted for by changes in volcanic and solar forcings, certainly not operating today.
-
Tom Curtis at 08:10 AM on 29 July 2014Nigel Lawson suggests he's not a skeptic, proceeds to deny global warming
Donny @1, with several crucial caveatts, your answer is given by the BEST land temperature index:

The caveats are that prior to 1880, thermomeeter records are largely restricted to those from Europe, and from the East coast of North America. That makes the record a regional rather than a global record, which accounts for the very large fluctuations in the record prior to 1880, and hence for the short term rapid trends. For that reason, I agree with the many scientists who think the land temperature index is insufficiently reliable prior to1880 to be considered a true global index. The area of coverage by BEST is shown in this video:
-
Donny at 07:43 AM on 29 July 2014Nigel Lawson suggests he's not a skeptic, proceeds to deny global warming
Could someone tell me what the rate of warming was, over land, in (10 year? ??) increments starting with 1800? I assume the earth has been warming since the little ice age then began to warm faster as we began to dump c02 into the atmosphere. I am wondering how much faster it is warming now.... compared to how fast it was warming before the increased co2. It seems like it would be an easy survey to do with climatologists just asking them what percentage of the warming do they feel is man made. ... it seems to me if we are warming twice as fast as we were. .... then half is natural and half is man made.
-
scaddenp at 07:05 AM on 29 July 2014There is no consensus
Well the questions Physicsprof thought interesting would mostly be case of RTFM, so no surprize that not much discussion of them. LC&C are very familiar with the content of the IPCC WG1. What is more surprizing is why these questions were there at all. It does not seem reasonable to me that anyone in APS who is questioning the consensus on climate change would not have read the document.
-
Maggnum at 04:59 AM on 29 July 2014Climate models accurately predicted global warming when reflecting natural ocean cycles
@mammelE @58 - one of the best explanations I have ever read. Unless you strenuously object, I will use that on occasion.
-
Rob Honeycutt at 02:13 AM on 29 July 2014There is no consensus
From what I gathered from people who were at that workshop, the APS board had a clear understanding of the situation ahead of time. It sounded like this was more about giving certain "skeptics" a chance to vent ahead of updating the APS position statement.
I would guess the framing document was a way of pulling up questions that "skeptics" put forth, though knowing those questions have been already answered to full satisfaction by the IPCC.
I agree with Philippe. This doesn't strike me as a reasonable list of questions, except to those who don't have a full grasp of the scientific evidence on climate change. It's a list of talking points that have been addressed, repeatedly, in full.
-
WRyan at 00:35 AM on 29 July 20142014 SkS Weekly News Roundup #30B
Haha. Yeh, I was somewhat bemused by that part of the article. But I have some sympathy for Oreskes. She worked as a geologist in Australia before she became a science historian and I expect that was an overwhelmingly male-dominated field of work, probably with a very macho culture. That might have left her with a fairly unsympathetic view of people in the physical sciences.
Personally, I was once part of a postgraduate electrical engineering program where there were 73 postgraduate students with a grand total of two of them being women.
-
PhilippeChantreau at 00:25 AM on 29 July 2014There is no consensus
I guess one could stretch the argument that, if APS revises isstatement, the consensus amongst scientists (not clkimate scientists) could be weakened and perhaps that's why PhysicsProf brought it up here. I am still unimpressed by the contents of that "framing document." I disagree that it resembles scientists asking questions in a sincere effort to understand. The arguments in it are well examined in the IPCC report. All of them are the object of current research and an abundance of litterature exists on them. Quite frankly, it reads more like a gish gallop and does not carry the to me the impression of sincerity that PhysicsProf advertises. I do not find that expressing this constitutes condescension.
-
joeygoze9259 at 00:21 AM on 29 July 2014Is a Powerful El Niño Brewing in the Pacific Ocean?
I think it is a lesson here, now in July, how cautious one needs to be about predictions. Statements made in April indicating how data is "stongly hint[ing]" about the size of the future El Nino are appearing to be inaccurate. Now in July, with ONI reported by the NOAA at .2, strong El Nino looks to be off the table with an event more in line with 2004 or 2009 (years where ONI was .2 at this time and El Nino started in September).
Moderator Response:(Rob P) - See also El Niño in 2014: Still On the Way?. An event like 2009 would put El Niño (if it occurs that is) down as an extreme one. We'll have to wait and see.
The immense build-up of heat in the equatorial ocean, followed by a strong decline, is something not observed before. Uncharacteristic behaviour often leads to new insights into how something works.
-
Tom Curtis at 20:04 PM on 28 July 2014There is no consensus
PhysicsProf @628:
1)
"How are IPCC confidence levels determined?"
As with many of the questions in the framing document, this question merely demonstrates the authors of the questions simply could not be bothered doing their homework:
http://www.ipcc.ch/pdf/supporting-material/uncertainty-guidance-note.pdf
2)
"What caused the 5% increase in confidence from 2007 to 2013?"
There is a whole chapter of the latest IPCC report on this topic, which apparently the framers of the question could not bother to read. Here is the summary:
"Combination of Evidence
Human influence has been detected in the major assessed components of the climate system. Taken together, the combined evidence increases the level of confidence in the attribution of observed climate change, and reduces the uncertainties associated with assessment based on a single climate variable. From this combined evidence it is virtually certain that human influence has warmed the global climate system. Anthropogenic influence has been identified in changes in temperature near the surface of the Earth, in the atmosphere and in the oceans, as well as changes in the cryosphere, the water cycle and some extremes. There is strong evidence that excludes solar forcing, volcanoes and internal variability as the strongest drivers of warming since 1950. {10.9.2, Table 10.1}"If that is not clear enough, let me spell it out. The attribution is for anthropogenic warming since 1950, ie, 60 odd years ago. The most commonly cited frequency for major oceanic fluctations is 60 years. A 60 year cycle will not raise temperatures over a full cycle. Therefore oceanic fluctuations are eliminated as a significant factor. Net volcanic foring and solar forcing since 1950 have been negative, or nearly so. Therefore they are not the cause of recent trends. That leaves anthropogenic factors as the dominant (>50%) cause of the warming. That conclusion is further supported by fingerprint arguments, and more detailed attribution in a host of areas. The increase in confidence comes because, firstly, at time extends to 60 years the potential role of oceanic cycles minimizes; and as we continue through the very low activity of the current solar cycle, the potential that it was the Sun further minimizes.
3)
"There also was a discussion (p 11) of the uncertainty of ocean heat flux data being 10-20% (or 20 W/m2) versus the change in global heat flux due to AGW since 1900 being less that 2 W/m2 (a factor of 10 less)."
From the relevant chapter of the IPCC:
"3.4.2.3 Net Heat Flux and Ocean Heat Storage Constraints
The most reliable source of information for changes in the global mean net air–sea heat flux comes from the constraints provided by analyses of changes in ocean heat storage. The estimate of increase in global ocean heat content for 1971–2010 quantified in Box 3.1 corresponds to an increase in mean net heat flux from the atmosphere to the ocean of 0.55 W m–2. In contrast, closure of the global ocean mean net surface heat flux budget to within 20 W m–2 from observation based surface
flux data sets has still not been reliably achieved (e.g., Trenberth et al., 2009). The increase in mean net air–sea heat flux is thus small compared to the uncertainties of the global mean. Large and Yeager (2012) examined global ocean average net heat flux variability using the CORE data set over 1984–2006 and concluded that natural variability, rather than long-term climate change, dominates heat flux changes
over this relatively short, recent period. Since AR4, some studies have shown consistency in regional net heat flux variability at sub-basin scale since the 1980s, notably in the Tropical Indian Ocean (Yu et al., 2007) and North Pacific (Kawai et al., 2008). However, detection of a change in air–sea fluxes responsible for the long-term ocean warming remains beyond the ability of currently available surface flux data sets."First note that the increase in ocean heat content is tightly constrained. As it happens the total Earth surface change in heat content from 1971-2010 was to 274 [196-374] zetajoules. That equates to a forcing of 0.42 [0.3-0.54] W/m^2 averaged over that period. 93% of that warming was in the ocean. Over that period, solar forcing was net negative, volcanic forcing was net negative, and oceanic fluctuations cannot give the ocean heat, merely shift it around. That leads to the IPCC conclusion that it is "very likely" that anthropogenic factors have "made a substantial contribution to upper ocean warming" using a method independent of observation estimates of the value of individual fluxes.
However, the IPCC quote properly refuses to specify the contribution form the magnitude of any individual flux, or combination thereof because the evidence on individual fluxes is not exact enough. This, quite frankly is kindergarden stuff. If we have a pool being filled from three different sources, each of which varies substantially from minute to minute in its outflow, but the volume of water in the pool increases steadilly, we know the net flow into the pool is positive and the average flow per minute even though we may be completely in the dark as to which source provides the greatest contribution in any given minute.
4) As shown above, the questions raised by you echoing the framing document have been more than adequately answered by the IPCC already. It is sufficient response to all of them (and all the questions in the framing document I have read) to simply reply, read the IPCC report. Of course, the original framers of the questions obviously have read sufficient of the report to present facts out of context, and frame questions in such a way as to create maximum confusion, even though a simple reading of the report already answers all the questions.
I emphasise "original" because it is quite possible, indeed probable if they are competent, that the APS committee has just presented a document of denier talking points so that said deniers cannot reasonably complain their points have not been addressed.
PS: @623 you wrote ' "you're a denialist"--because Holocaust imagery is always in good taste" '. Everybody else will have noted that you are the only person invoking the Holocaust here. The will probably recognize that if you call Paul tall, that does not prevent you calling Mary tall as well, and that in no way implies they have the same gender. Likewise, if some people have called people who doubt the history of the Holocaust on unreasonable grounds "Holocaust deniers", that I call people who doubt AGW on unreasonable grounds "AGW deniers" in no way implies that the latter have offensive views on the Holocaust - only that they deny AGW on unreasonable grounds. My language is not limited by your determination to use the taking of offense as a rhetorical tactic.
PPS: This is all well of topic on this thread, and I expect any reply on any of these issues (or other questions) to be in an appropriat thread. Not doing so is a vioation of the comments policy and should result in your comment being summarilly deleted.
-
PhysicsProf at 15:04 PM on 28 July 2014There is no consensus
"How are IPCC confidence levels determined?"
"What caused the 5% increase in confidence from 2007 to 2013?"
How is the persistent factor of 3 uncertainty in climate sensitivity consistent with the IPCC confidence levels?
How long must stasis exist before a firm declaration of a problem with the models?
There also was a discussion (p 11) of the uncertainty of ocean heat flux data being 10-20% (or 20 W/m2) versus the change in global heat flux due to AGW since 1900 being less that 2 W/m2 (a factor of 10 less).
I guess these would be a starting point....
-
scaddenp at 14:22 PM on 28 July 2014There is no consensus
Well I havent read every line the workshop transcript but it certainly looked to me like the questions likely of interest to L,C&C were being addressed. Got an example of a particularly interesting question that you feel was not addressed?
-
PhysicsProf at 14:13 PM on 28 July 2014There is no consensus
Of course the framing document is not a position paper expressing skepticism on climate change. But they are serious questions that good scientists are asking. The IPCC report makes strong statements and the APS committee is inquiring into the basis of those statements. The 2007 APS statement on climate change is one of the pillars of the scientific consensus on climate change. That position is being reviewed by this committee. I think they are asking good questions. I would assume there are good answers and that is why I asked if they had been addressed. But so far I only hear defensive responses that don't address substance. If all you have is condescension, I am clearly in the wrong place for information.
-
Tom Curtis at 13:46 PM on 28 July 2014There is no consensus
KR @624:
"Why would you treat an unapproved draft as the opinion of the APS?"
Particularly as it is not a draft, but a "framing document" that may have deliberately set out to encapsulate "skeptical" arguments without either endorsing those arguments or even agreeing that they are sensible, but merely in order garner responces to what are considered to be contrary opinion.
-
KR at 13:31 PM on 28 July 2014There is no consensus
PhysicsProf - If and when the APS releases an updated statement, it might be worth commenting upon it to the APS. Right now, it's silly to claim that a draft in progress, particularly with biased committee membership, is the opinion of the society as a whole.
Why would you treat an unapproved draft as the opinion of the APS?
-
Tom Curtis at 13:09 PM on 28 July 20142014 SkS Weekly Digest #30
In the spirit of the Toon of the week, we have this gem from XKCD:
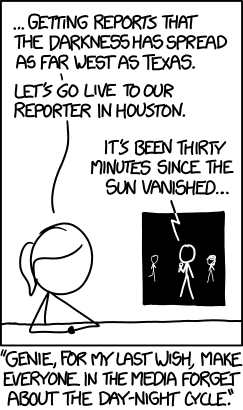
The first wish probably gave us AGW "skeptics" ....
-
PhysicsProf at 12:50 PM on 28 July 2014There is no consensus
So I gather the answer to my question is no, there hasn't been an article addressing the concerns raised by the American Physical Society. While Linzen, Curry and Christy were part of the actual workshop, my understanding was the framing document was from the APS without the input of the three. I did read the whole 573 pages of the workshop which was pretty fascinating but most of the questions in the framing document weren't directly addressed. What interests me is the current discussion feels like politicians slamming each other rather than scientists analyzing a problem ("this is all a hoax"--because scientists love secret meetings to fool the public; or "you're a denialist"--because Holocaust imagery is always in good taste). What I liked about the APS document was it asked serious questions a scientist rather than a politician would ask seeking to understand the basic science involved.
-
Tom Curtis at 12:40 PM on 28 July 2014Rupert Murdoch doesn't understand climate change basics, and that's a problem
Donny @38, read carefully the five "certainties" listed by Mancan. They are in fact sufficiently close to indisputable that calculating a probability of error for them is pointless. The only quibble on that point is that proposition (4) says that increasing CO2 "will warm the planet", but that is only true ceterus paribus. They also do not say very much about global warming as a problem for humans to sovlve. They jointly insist, for example that ceterus paribus, and with increasing CO2, temperatures will rise but do not quantify the increase from BAU by 2100. For all these certainties, that increase could be statistically indistinguishable from the preindustrial temperatures. They insist that warming will alter weather (better: climate), but no not indicate whether that alteration will be good, bad or neutral for humans, our society or the environment.
Unfortunately, if you cannot agree with these certainties, you are deeply in denial about climate science. Having agreed to them, however, implies nothing about future policy. Other, quite solid, but not so certain statements do imply a lot about policy. But if you cannot agree to even such basic propositions as the five given by Mancan, there is no hope in actually discussing the evidentiary merits of that science.
-
DSL at 12:28 PM on 28 July 2014Rupert Murdoch doesn't understand climate change basics, and that's a problem
Donny, you say this: "I am surprised to see a site with this kind of name be full of so many absolutely non scientific commentary and or mindsets."
And then you follow it with this:
"I am starting to doubt our understanding of how much c02 actually does effect temperature. I feel like the recent pause in warming doesn't sit right with my expectations"
This site is here just for you to work through your doubts and "feelings." So do it, and bring the evidence — on the appropriate threads, of course.
-
Donny at 11:05 AM on 28 July 2014Rupert Murdoch doesn't understand climate change basics, and that's a problem
Mancan. ...
Don't you think there may be some variables in all those "certainties" that you are listing? Maybe Murdoch thinks that the climate systems are extremely complex and to say that everything is decided in the CC debate may be a little premature.
I have a degree in environmental biology so I am by no means an expert in climate change. ... However I follow the debate closely and have enough science background to understand that the lack of having proper controls while experimenting in nature is a real problem. Thinking that you have a set of truths like your 5 can take away your scientific objectivity. I am surprised to see a site with this kind of name be full of so many absolutely non scientific commentary and or mindsets.
I am starting to doubt our understanding of how much c02 actually does effect temperature. I feel like the recent pause in warming doesn't sit right with my expectations. So I am looking back at what I assumed to be true and re questioning everything. .... and assuming nothing.
Moderator Response:[PS] This would be best discussed under a more focussed topic. eg here. " I feel like the recent pause in warming doesn't sit right with my expectations". Perhaps you havent read enough climate science to have very accurate expectation then? Try the appropriate sections of the IPCC WG1 report and bring questions to the appropriate topic.
-
Ken in Oz at 09:49 AM on 28 July 2014Climate data from air, land, sea and ice in 2013 reflect trends of a warming planet
I should say that I don't think the most serious impediments to action on climate are down to failure to communication of the science. My wish list on that front isn't going to turn the tables.
It may well be that more of the public demanding action is what overcomes the resisting inertia, but I think it's failures of politics, which sees people in positions of trust and responsibility putting their perceived role as advocates for agendas and interests that they support and that support them - their 'side' - ahead of their broader and longer term responsibilities that prevents such a public groundswell. As it prevents serious and effective policy action.
Rejection of mainstream science is given a stamp of respectability and authenticity when it comes from those with established power and influence - from those who are perceived to be essential to our own bit of economic security and prosperity. When the public is mislead and misinformed by those we should be able to trust that groundswell of public demand for appropriate action is inhibited. Better, more compelling communication that targets politicians and community leaders will lead to greater community acceptance of both the reality of the climate problem and of roads to solutions.
-
Paul R Price at 08:26 AM on 28 July 20142014 SkS Weekly News Roundup #30B
On the Oreskes and Conway Washington Post article.
O&C have done great service in their Merchants of Doubt research and many of the "14 concepts that will be obsolete after catastrophic climate change" hit the target but one sticks out like a sore thumb as being dead wrong. Apparently along with "Fugitive emissions" one of the great evils contributing to catastrophic climate change is "Physical scientists" (I kid you not) who are described as:
The practitioners in a network of scientific disciplines derived from the 18th-century natural philosophy movement. Overwhelmingly male, they emphasized study of the world’s physical constituents and processes — the elements and compounds; atomic, magnetic and gravitational forces; chemical reactions; flows of air and water — to the neglect of biological and social realms, and focused on reductionist methodologies that impeded understanding of the crucial interactions between the physical, biological and social realms.
This is laughably absurd, it's just nonsense. It does not take too much knowledge of climate literature, both science and policy, to realise that the problem lies with special interests and competitive national interests, all at the expense of long-term global well being (yet O&R obscured these under "Market failure"). It is certainly not the physical scientists that bear blame for doing their job. How can O&R get this so wrong?
O&R's dig smacks of the Pielke Jr [dis]Honest Broker schtick of blaming the scientists, its very disappointing coming from them as historians of science.
Among the academics my own reading of conferences, research and policy documents is that it is the social sciences especially those in policy and in economics who have failed far more than the physical and biological scientists. After all the latter groups report the observations and best explanations whereas resolving the problem is all about how humans respond, which is the area where social scientists are supposed to be expert. But no, blame the poor physical scientists, next O&R'll be saying it's a conspiracy.
And what is this 'overwhelmingly male' quip? There seem to be a great many excellent women climate scientists, well represented on Twitter for example. Very odd to be demeaning them in the group. I don't get the gender comment. It might make sense if they were talking about climate disinformers who are predominantly older, white, rich, educated and male, but physical scientists? Puzzling.
Having nailed the Merchants of Doubt and their special interest funders showing how they to ensure that policy and politicians and economists stay on board the fossil fuel supertanker O&R somehow themselves come over all MsofD themselves and blame the scientists. 'Climate denial' doesn't even make the article's list.
Irony level seems high.
-
Chris Crawford at 00:49 AM on 28 July 2014Climate models accurately predicted global warming when reflecting natural ocean cycles
Thanks for explaining it to me, Bob.
-
Ken in Oz at 17:21 PM on 27 July 2014Climate data from air, land, sea and ice in 2013 reflect trends of a warming planet
I'm not sure what Rob Painting has in mind. Antarctic ice, in isolation, is being actively employed by climate action obstructionists to mislead and deceive so giving some perspective to that should be as prominent and clear as possible, with the hope and intention that mass media should notice and pick up on it. If that can be done in ways that link to the bigger picture without getting too bogged down in excessive details and complexities, then it will be more compelling. But the bigger picture, including snow cover, glaciers, ice shelves and ice sheets as well as sea ice, appears to tell a compelling story, if it can be communicated well. The balance between big picture vs clarity on details seems very important.
I realise there are many excellent resources out there (including this site) and some may be already doing what I had in mind - with it not entirely clear in my own mind I suppose; what I've been thinking being many things rather than one.
It's making things as clear as possible to the widest possible audience that's needed, which probably takes it into the realm of video documentary rather than a revved up woodfortrees idea. I would still like to see improved and more compelling visual graphical representations available in user friendly form. For example I would like to see relative contributions to global average temperatures of various forcings through time - with the individual contributions being shown in an "additive" or perhaps subtractive manner; a bit like a series of Foster and Rahmstorf style temperature evolution graphs but including as many forcings as possible, with an option to see what temperature evolution would be with and without specific ones to help communicate their relative contributions. The links between ocean oscillations like ENSO, sea surface temperatures and surface air temperatures would be another, showing how much they impact year to year temperatures, whilst revealing how they do not, by themselves, create a longer term trends. Sea levels and distribution of water over land masses, revealing and accounting for the seasonal and year to year variations we see.
I would note that I think that Dana's heat content metric is probably a superior indicator of actual systemic change to the climate system than SAT's but it looks like we are stuck with global average surface air temperatures as the familiar, all inclusive metric of choice. As such, communicating the variations of the climate processes and phenomena that contribute to it's ups and downs, pauses and accelerations is important, if only to put to rest the false idea that climate science fails to take into account natural variations (in turn falsely suggestive that warming is down to those variations).
-
Bob Loblaw at 13:06 PM on 27 July 2014Climate models accurately predicted global warming when reflecting natural ocean cycles
Chris:
Keep in mind that portions of a model can be verified in the manner you suggest. Take radiation transfer, for example. It is not difficult to take a vertical profile of radiation measurements, combined with a vertical profile of atmospheric conditions (pressure, humidity, aerosols, radiatively-active gas concentrations such as CO2 and O3, etc.) and compare the observed radiation to a model. You can also examine such things as surface energy balance sub-models (surface evaporation, thermal transfer from the surface to the atmosphere, soil temperatures) or other components of a GCM.
It's the "model the whole world" stage that is difficult to compare in a statistical sense. The model won't be an exact fit, and you can't easily tell if that is because of a model error or because you don't know something like atmospheric compostion well enough. In a physics-based model there aren't a lot of "tuning knobs", and adjusting one to fit one condition - e.g., temperature - may make another condition (precipitation) worse.
The other characteristic in complex models is that you can get good fits over quite a wide range of input variables, due to co-dependence of variables - e.g., add some reflective aerosols to the model atmosphere, but reduce your surface albedo. Trying to tweak results that way is, as you say, not of high scientific value.
To use a crude analogy, it's like having a model that says A+B=C, and you have measurements that say C=4 +/- 0.1, and you think that A is in the range 0.9-1.1 and B is in the range 2.9-3.1, and you start playing around with different values of A and B to try to best match C=4. You'll find an infinite number of values of A and B that will do the job equally well - without learning anything more about the accuracy of your model.
-
barry1487 at 12:50 PM on 27 July 2014Climate data from air, land, sea and ice in 2013 reflect trends of a warming planet
Ken, we should probably add snow cover to the cryospheric list.
http://tamino.wordpress.com/2012/10/05/snow-2/
http://tamino.wordpress.com/2012/10/08/snowice-by-request/
Yes, it would be great for various purposes to have data for a multitude of metrics lined up and plottable/mappable in a super-app. But how long before contrarians start denouncing such a thing as a model? ;-)
-
barry1487 at 12:33 PM on 27 July 2014Climate data from air, land, sea and ice in 2013 reflect trends of a warming planet
Ken,
Have you seen Nick Stokes Climate Plotter?
My main computer is down so facts and figures aren't to hand, but of glaciers, sea ice and land ice, only Antarctic sea ice and 15% of glaciers are increasing or unchanging. The Antarctic ice sheet, Greenland's, 85% of studied glaciers and Arctic sea ice are in decline. That's a fairly hefty statement against those zeroing in on metrics bucking the trend.
Jim Hunt,
My question hinges on whether the same algorithm is used North and South for AR4/AR5 (per the differences mentioned in the article Ashton linked). I don't know the answer to that, hence my query. This wasn't discussed in the article or the paper.
Here's the full paper.
http://www.the-cryosphere.net/8/1289/2014/tc-8-1289-2014.pdf
-
Tom Curtis at 10:36 AM on 27 July 2014Challenges in Constraining Climate Sensitivity: Should IPCC AR5’s Lower Bound Be Revised Upward?
VictorVenema @3, using HadCRUT4 and calculating the temperature difference of the hiatus as the difference after 15 years between the Jan 1983 to Dec 2012 and the Jan 1998 to Dec 2012 trends, I calculate the temperature difference to be 0.18 C. I use HadCRUT4 because it is the most commonly used of the well known climate indices (even though there are good reasons to think GISS, and now BEST, are better). As a result, it is the temperature index most likely to be used in climate sensitivity studies.
Further, warming from 1910 is about 1 C, but warming from the preindustrial era (and certainly from 1850) is about 0.8 C. The difference is because of a low temperature due to a sequence of large volcanoes in the preceding decades (effectively starting with Krakatoa), and a solar minimum in 1910 as strong, or stronger than that we are currently experiencing. Combining the difference in the values, the "hiatus" would make a difference of 22.7% in a climate sensitivity estimate which was a simple function of temperature and forcing. It would reduce a climate sensitivity estimate from 3 C to 2.3 C per doubling of CO2; or from 2 C to 1.5 C. That is, it is sufficient to account for the reduction on climate sensitivity estimates in the IPCC AR5.
Never-the-less, there are other factors involved. One is lower estimates of the temperature difference between the pre-industrial and the LGM, which has resulted in a number of lower paleoclimate estimates of climate sensitivity. Another is variations of technique such as Nic Lewis's use of a "non-informative prior" which turns out to be an assumption of low climate sensitivity built into the Bayesian methodology (and which is justified only by subjective preference IMO).
Further factors (particularly relevant to Otto et al 2013) include the adjustment of estimated forcings to reflect lower values of aerosol radiative forcing from AR5 (which drops the estimate from 2.4 to 2.0 C per doubling), and the assumption that radiative forcing per doubling of CO2 is 3.44 W/m^2 rather than the more commonly accepted 3.7 W/m^2, without which assumption their estimate would be 2.2 C per doubling. The later assumption is based on Forster et al (2013), who estimate an average adjusted forcing for the CMIP5 models of 3.44 W/m^2. "Adjusted forcing" is a different concept to "radiative forcing", and allows for some rapid tropospheric feedbacks. It is not clear to me that using adjusted forcing rather than radiative forcing in their climate sensitivity estimate is not a mistake.
Finally, some of the perception of a lower climate sensitivity comes from treating all estimates as being equal. They are not. Otto et al, for example state that their estimate is for a "lower bound" of climate sensitivity as it does not allow "... delayed ocean warming at high latitudes can mask the impact of local positive feedbacks". That is, Otto et al {with the probable exception of Nic Lewis ;)} expect climate sensitivity to be greater than their estimate (ignoring error margins), a fact that is frequently ignored.
-
VictorVenema at 06:15 AM on 27 July 2014Challenges in Constraining Climate Sensitivity: Should IPCC AR5’s Lower Bound Be Revised Upward?
I wonder if the relationship between the estimates of climate sensitivity and the apparent warming slowdown is really there.
The "missing" warming is in the order of 0.1°C for a decade. The man-made warming itself is in the order of 1°C over a century. Thus we are talking about a deviation in the order of one to a few percent.I would personally not expect that small deviation to influence the estimates of the climate sensitivity that much. Aren't the recent estimates of climate sensitivity lower for other reasons? Or is there some nonlinearity in these estimation methods that I am overlooking?
-
Chris Crawford at 03:26 AM on 27 July 2014Climate models accurately predicted global warming when reflecting natural ocean cycles
Bob Loblaw @ 64
Thanks for explaining that. Yes, it would surely be quite a job to put together a statistical analysis of the reliability of various models, and there would be a lot of tough judgements to be made that would detract from the rigor of the analysis. It *is* certainly possible; the pattern matching you describe can be carried out with mathematical rigor.
I suspect, however, that the value of such a project to the scientific community would be low; in the long run, a well-informed scientist's judgement will always produce better results than any formalized analysis such as I am suggesting. I suppose that such an analysis would be of utility only for debunking deniers' claims that the models don't work. The few knowledgeable deniers have already, in all likelihood, come up with such analyses and realized just how good the climate models are.
-
PhilippeChantreau at 02:24 AM on 27 July 2014There is no consensus
"L,C&C who often claim nobody listens to them"
Someone at APS listened enough to bother with yet another ClimateAudit insinuation of impropriety, which I find a little disappointing. Of course, if "skeptics" were part of that commitee then all bets are off...
L,C & C were listened to when they first spoke. As they kept on repeating themselves, the amount of listening they garnered decreased, which is entirely normal and even desirable. Sometimes I wish that the the mass media out there would have the same sloganeering policy that SkS has.
L, C&C receive exactly the attention they deserve from the scientific community and way more than that in the public media, they have no reason to complain.
-
Bob Loblaw at 22:54 PM on 26 July 2014Climate models accurately predicted global warming when reflecting natural ocean cycles
Chris Crawford @ 62:
With a huge variety of variables (temperature, precipitation, wind speed, pressure, radiation, etc.) to compare, combined with the fact that model output often represents averages at fixed grid spacing whereas observations are rather randomly distributed with different temporal and spatial resotuion, there is no simple mathematical relationship to derive such an error statistic. Climate GCMs are not statistical models: they do not reproduce data at points specified by observations.
What can be done is pattern-matching: does a map of modelled global temperature look like the map of observed global temperature?, etc.
-
MA Rodger at 18:18 PM on 26 July 2014There is no consensus
PhysicsProf @618 & PhilippeChantreau @619/620.
The APS is reviewing its statement on Climate Change and the document link given @618 is to a document that was an early part of that process. It is a pukka APS document produced by the sub-committee appointed to look into the review. (It is the "Framing Document for Workshop" mentioned on the page linked above.) It was a sort-of agenda document for a workshop held in January this year. What was curious was the list of experts invited to that workshop. These included obvious suspects (Bill Collins, Isacc Held, Ben Santer) and controversially arch-denialists Lindzen, Curry & Christy. I know of no offical reason for their invite but there was comment I read that this would disarm L,C&C who often claim nobody listens to them. The workshop transcript is available on-line and stretches to 573 pages (of big print).
The next step in the process, a decisionof whether to stick with the old statement from 2007 (which itself got some skeptics grinding teeth) or whether to start a process to develop a fresh statement - that decision has yet to be made. However the whole thing got a lot of airing in March when a professional twit of the British press called Delingpole kicked off a story that L,C&C had been appointed to the committee considering the APS statement review. Although utter bunk, the skeptical twitosphere feasted heavily on this "news" for some days.
So we await the outcome of the sub-committee's deliberations.
-
PhilippeChantreau at 16:18 PM on 26 July 2014There is no consensus
I sent an e-mail with the url to APS, hopefully they'll respond in a few days and tell us something on the nature of this statement.
-
Ken in Oz at 16:15 PM on 26 July 2014Climate data from air, land, sea and ice in 2013 reflect trends of a warming planet
Rob @15 - I look forward to it.
As an aside, I have had an ongoing wish for improved graphical demonstration more broadly. Perhaps out of naivete, I keep imagining animated graphs progressing through various time periods, with a whole lot of variables/indicators being shown individually as well as together, and additively as well - some kind of woodfortrees on steroids, like 'here's global heat content and surface air temperatures, here's surface air temperatures with sea surface temperatures, with ENSO and with AO, milankovic cycle, aerosols, albedo changes. etc.' ie visually revealing real world connections and contributions where they exist or lack of them where they don't. Ultimately we get an additive 'here, with everything we know about!'
Needless to say that would be a mammoth undertaking; I'm not holding my breath!
-
PhilippeChantreau at 16:09 PM on 26 July 2014There is no consensus
PhysicsProf, the document you link is worded and presented in a rather peculiar fashion. What is its exact origin?
When I go to the APS website and follow the links, I find this page:
http://www.aps.org/policy/statements/07_1.cfm
It is much more consistent with the normal tone of APS statements, which usually do not contain an abundance of graphs and data, or text highlighted in red. I looked at a variety of other statements and none of them has a format similar to the one you linked. I had too much difficulty to keep the document running on my computer to study it in enough detail, it kept on triggering error messages when trying to scroll. However, I did see a reference to the CimateAudit blog, which I find highly suspicious. APS does not normally refer to blogs of any kind.
Do you know where exactly that document came from? As I see it, it appears more fraudulent than anything else. Did you talk to anyone at APS about it?
-
chriskoz at 14:49 PM on 26 July 20142014 SkS Weekly News Roundup #30A
The relationship between global warming denial and speaking English, as noticed by Chris Mooney, is incidental. Similar to once popular meme about the number of pirates on Indian Ocean and GW.
The ranking of 20 countries on the denial scale in Chris' article is truely explained by conflict of national interests. It happens that the top industrialised countries that mostly benefited from FF (and continue to benefit under bau scenario) do speak English. Those countries are joined by non-English speaking Poland, where coal mining and processing is the main driver of the economy, with virualy all top paying jobs.
On the other hand, India with its largest in the world English-speaking population (note Indians who took this survey online must speak English fluently with no exceptions) is at the end of the list. That's because there is no conflict of interest in this country, while their language is irrelevant.
-
PhysicsProf at 13:26 PM on 26 July 2014There is no consensus
Has skeptical science done an article responding to the American Physical Society Framing document on climate science which raised substantial questions on the state of climate science: http://www.aps.org/policy/statements/upload/climate-review-framing.pdf
-
Tom Curtis at 10:37 AM on 26 July 2014Climate models accurately predicted global warming when reflecting natural ocean cycles
Anne Ominous @59, the authors of the paper only constrained their selection of model runs to be in phase with temperature trends in the NINO 3.4 region, as demarcated in the figure below:
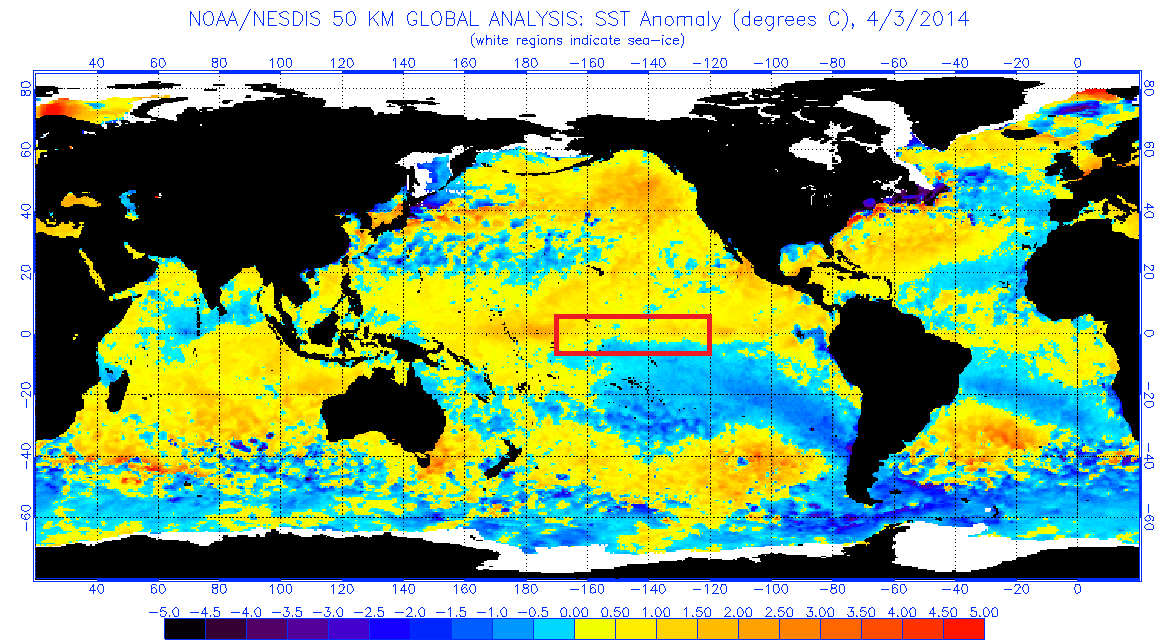
That area is just 3.1 million km^2, or 1.2% of the Earth's surface (1.9% of the Pacific's area). Were you to select an equivalent area at random from the Earth's surface, and filter model runs to have the same phase of trends in that area, it is highly unlikely that it would sort the models runs into high and low trend groupings. Consequently your analogy is inapt.
This is only an unsurprising result because a number of other studies (formal and informal) have already shown that ENSO trends are probably the major cause in the relatively flat GMST trends over the last 15-20 years. The authors have in fact done what scientists should do - tested a currently popular hypothesis by an alternative method to those that have already been tried to see if it avoids falsification when you do so. It did, which is fairly ho-hum given the other results.
The only problem is that AGW deniers refuse to acknowledge the ENSO connection. The simultaneously (it seems) maintain that:
1) 1998 was only a very hot year because of ENSO, so the very high temperatures in 1998 are not evidence of global warming;
2) Only short term trends including 1998 at or near the start year can be of any interest for testing the validity of global warming; and
3) The slightly positive trend between 1998 and 2012 has nothing whatever to do with the very strong El Nino in 1998 and the strong La Ninas in 2008, and 2011/12.
Some people notice a certain inconsistency in the denier opinion.
-
Chris Crawford at 10:31 AM on 26 July 2014Climate models accurately predicted global warming when reflecting natural ocean cycles
I have a question regarding the measurement of the success of the models. I don't see anything in this paper suggesting a calculation of deviance (sum of squares of errors) of the models. I realize that they make multiple predictions; hence, there would be a LOT of calculating to get an overall assessment of the reliability of the model. Yet I would think that a solid calculation of the deviance would make it easy to address questions about the reliability of the models.
So the question is: where are the deviance results?
-
Rob Honeycutt at 07:14 AM on 26 July 2014Climate models accurately predicted global warming when reflecting natural ocean cycles
Anne... My thought on the relevance of the paper is this: What are the potential outcomes of the experiment?
a) Models phased with La Nina do not show any detectable difference from out of phase models.
b) Models phased with La Nina do show a detectable difference from out of phase models that agree with the observed surface trend.
If the results were (a), that would suggest there is potentially something wrong in the models that are causing them not tracking the observed trend in surface trend of the past 15 years.
If the results were (b), then we have an indicator that prevailing La Nina conditions can at least partially explain the observed temperature trend of the past 15 years.
The results ended up agreeing with (b).
-
KR at 07:07 AM on 26 July 2014Climate models accurately predicted global warming when reflecting natural ocean cycles
Anne Ominous - Climate deniers frequently note that observations are at the edge of the model envelope, and then claim the models are useless/wrong and we should ignore them. Foolish rhetoric, really, since even perfect models show stochastic variation on different runs, and neither the model mean nor any single individual run will therefore exactly match the trajectory of observations. Climate models aren't expected to track short term observations of climate variations, but rather explore long term trend averages.
This paper is an elegant demonstration that models do reproduce shorter term global temperature trends and patterns when model variations match observations - strong support for the accuracy and physical realism of those models, and their usefulness when exploring longer term trends where those variations average out.
Demonstrating that models are physically accurate enough to model the range of short term variations, and that observations are indeed within the envelope of modeled behavior, is hardly a waste of time. It shows that the models are useful.
-
Anne Ominous at 05:56 AM on 26 July 2014Climate models accurately predicted global warming when reflecting natural ocean cycles
scaddenp @48:
"The paper does demonstrate that a mean created from runs which are in phase with actual state are a closer match to observed global temperature."
This is so, but it is also a statement of the blatantly obvious. Why would a sane person need proof of this? I'm not asking this as flamebait, I am being completely serious. A very good analogy would be to say "this paper shows that periods during which the door of the darkroom was open are correlated with an increase in ambient illumination."
Seriously? And it's even pretty weak evidence of correlation, as Russ quite correctly pointed out.
The question remains: what does this paper actually demonstrate that wasn't already pretty darned obvious without it? The fact that models have to model reality in order to be valid (including the past) has been long known. So even if this paper is 100% true and valid, it is nothing more than a confirmation of something already known to REASONABLE people. I add that qualifier intentionally.
One might say "Yeah, but there was a time when the existence of phlogiston was considered to be 'obvious'." But these aren't those days. Reference Asimov's "The Relativity of Wrong."
We know what models are for, and at least roughly what evidence they provide and what not. To show that a few models that best (albeit badly) modeled the past also best (albeit very very badly) modeled the present is hardly a revelation. If I were a reviewer I would have rejected it out-of-hand as grandstanding and a waste of everybody's time.
-
Magma at 01:16 AM on 26 July 20142014 SkS Weekly News Roundup #30A
Attack of the Chicago climate change maggots
I was a little surprised to see that level of vituperation in a Washington Post headline... but it turns out the article mentioned maggots hatching from fly eggs brought up from sewage backups caused by heavy rainstorms.
Literal maggots, not figurative ones.
-
HK at 23:27 PM on 25 July 2014Seal of approval - How marine mammals provide important climate data
WRyan:
I think the different numbers depend on what period Hansen and others have used in their calculations. Hansen was probably most interested in the recent energy imbalance.
Based on figure 1 here and temperature data from GISS I got the following results for the troposphere’s fraction of the total heat accumulation:1961-2008
1.5 %
1975-1998
2 %
1993-2008
1.2 %The higher fraction of tropospheric warming in the second period is caused mostly by a very slow ocean warming between 1975 and 1990 compared to the warming we have seen after that.
It’s worth noting that the linear trend for the troposphere between 1993 and 2008 was 0.22°C/decade, and that is actually higher than the trend between 1975 and 1998 (0.18°/decade).BTW, this graph clearly shows that the ocean warming has been far from uniform. Note that the difference between these depth intervals would be even larger if they didn’t overlap each other.

-
Rob Painting at 20:05 PM on 25 July 2014Climate data from air, land, sea and ice in 2013 reflect trends of a warming planet
Ken in Oz - That's a very good point. I think you will find the comparison quite mindboggling. I'll work on a post, although given the enormous disparity I'm not sure how to demonstrate it graphically.
-
Ken in Oz at 13:04 PM on 25 July 2014Climate data from air, land, sea and ice in 2013 reflect trends of a warming planet
Barry @ 4
With a counter intuitive increase in winter maximum for Antarctica in a warming world, it seems that there is something to be gained by giving some comparisons with overall changes to Antarctic ice. In order to undercut the opportunities from that for climate science deniers and obstructionists creating false perceptions it seems to me that some perspective could be gained by looking at land ice and sea ice side by side, both qualitively (seasonal vs permanent) and quantitively. How does this periodic, winter only increase in sea ice look alongside the estimates of 160 billion tonnes a year of land ice being lost without being replaced? Anyone know how much mass that winter sea ice increase comes to?
-
WRyan at 10:54 AM on 25 July 2014Seal of approval - How marine mammals provide important climate data
With regard to the different heat capacity of the ocean and atmosphere, the absolute heat content of the two systems is not in question here. Rather we are looking at their respective changes in heat content.
The changes in heat content depend on their respective specific heat capacities and the respective changes in average temperature of each system.
The troposphere has had a fairly uniform temperature increase throughout its entire mass. So we can calcualte its increase in heat content by using its entire mass. I don't know if the same can be said of the ocean.
I imagine that heat distribution in the ocean is much slower than heat distribution in the atmosphere, so the temperature increase of the upper ocean is probably different to the temperature change in the deeper ocean. So I don't know how accurate it would be to use the total mass of the ocean when calculating heat gain in recent periods unless you had the average temperature increase for the entire ocean.
Prev 690 691 692 693 694 695 696 697 698 699 700 701 702 703 704 705 Next


