


 Arguments


Recent Comments
Prev 693 694 695 696 697 698 699 700 701 702 703 704 705 706 707 708 Next
Comments 35001 to 35050:
-
Chris Crawford at 10:31 AM on 26 July 2014Climate models accurately predicted global warming when reflecting natural ocean cycles
I have a question regarding the measurement of the success of the models. I don't see anything in this paper suggesting a calculation of deviance (sum of squares of errors) of the models. I realize that they make multiple predictions; hence, there would be a LOT of calculating to get an overall assessment of the reliability of the model. Yet I would think that a solid calculation of the deviance would make it easy to address questions about the reliability of the models.
So the question is: where are the deviance results?
-
Rob Honeycutt at 07:14 AM on 26 July 2014Climate models accurately predicted global warming when reflecting natural ocean cycles
Anne... My thought on the relevance of the paper is this: What are the potential outcomes of the experiment?
a) Models phased with La Nina do not show any detectable difference from out of phase models.
b) Models phased with La Nina do show a detectable difference from out of phase models that agree with the observed surface trend.
If the results were (a), that would suggest there is potentially something wrong in the models that are causing them not tracking the observed trend in surface trend of the past 15 years.
If the results were (b), then we have an indicator that prevailing La Nina conditions can at least partially explain the observed temperature trend of the past 15 years.
The results ended up agreeing with (b).
-
KR at 07:07 AM on 26 July 2014Climate models accurately predicted global warming when reflecting natural ocean cycles
Anne Ominous - Climate deniers frequently note that observations are at the edge of the model envelope, and then claim the models are useless/wrong and we should ignore them. Foolish rhetoric, really, since even perfect models show stochastic variation on different runs, and neither the model mean nor any single individual run will therefore exactly match the trajectory of observations. Climate models aren't expected to track short term observations of climate variations, but rather explore long term trend averages.
This paper is an elegant demonstration that models do reproduce shorter term global temperature trends and patterns when model variations match observations - strong support for the accuracy and physical realism of those models, and their usefulness when exploring longer term trends where those variations average out.
Demonstrating that models are physically accurate enough to model the range of short term variations, and that observations are indeed within the envelope of modeled behavior, is hardly a waste of time. It shows that the models are useful.
-
Anne Ominous at 05:56 AM on 26 July 2014Climate models accurately predicted global warming when reflecting natural ocean cycles
scaddenp @48:
"The paper does demonstrate that a mean created from runs which are in phase with actual state are a closer match to observed global temperature."
This is so, but it is also a statement of the blatantly obvious. Why would a sane person need proof of this? I'm not asking this as flamebait, I am being completely serious. A very good analogy would be to say "this paper shows that periods during which the door of the darkroom was open are correlated with an increase in ambient illumination."
Seriously? And it's even pretty weak evidence of correlation, as Russ quite correctly pointed out.
The question remains: what does this paper actually demonstrate that wasn't already pretty darned obvious without it? The fact that models have to model reality in order to be valid (including the past) has been long known. So even if this paper is 100% true and valid, it is nothing more than a confirmation of something already known to REASONABLE people. I add that qualifier intentionally.
One might say "Yeah, but there was a time when the existence of phlogiston was considered to be 'obvious'." But these aren't those days. Reference Asimov's "The Relativity of Wrong."
We know what models are for, and at least roughly what evidence they provide and what not. To show that a few models that best (albeit badly) modeled the past also best (albeit very very badly) modeled the present is hardly a revelation. If I were a reviewer I would have rejected it out-of-hand as grandstanding and a waste of everybody's time.
-
Magma at 01:16 AM on 26 July 20142014 SkS Weekly News Roundup #30A
Attack of the Chicago climate change maggots
I was a little surprised to see that level of vituperation in a Washington Post headline... but it turns out the article mentioned maggots hatching from fly eggs brought up from sewage backups caused by heavy rainstorms.
Literal maggots, not figurative ones.
-
HK at 23:27 PM on 25 July 2014Seal of approval - How marine mammals provide important climate data
WRyan:
I think the different numbers depend on what period Hansen and others have used in their calculations. Hansen was probably most interested in the recent energy imbalance.
Based on figure 1 here and temperature data from GISS I got the following results for the troposphere’s fraction of the total heat accumulation:1961-2008
1.5 %
1975-1998
2 %
1993-2008
1.2 %The higher fraction of tropospheric warming in the second period is caused mostly by a very slow ocean warming between 1975 and 1990 compared to the warming we have seen after that.
It’s worth noting that the linear trend for the troposphere between 1993 and 2008 was 0.22°C/decade, and that is actually higher than the trend between 1975 and 1998 (0.18°/decade).BTW, this graph clearly shows that the ocean warming has been far from uniform. Note that the difference between these depth intervals would be even larger if they didn’t overlap each other.

-
Rob Painting at 20:05 PM on 25 July 2014Climate data from air, land, sea and ice in 2013 reflect trends of a warming planet
Ken in Oz - That's a very good point. I think you will find the comparison quite mindboggling. I'll work on a post, although given the enormous disparity I'm not sure how to demonstrate it graphically.
-
Ken in Oz at 13:04 PM on 25 July 2014Climate data from air, land, sea and ice in 2013 reflect trends of a warming planet
Barry @ 4
With a counter intuitive increase in winter maximum for Antarctica in a warming world, it seems that there is something to be gained by giving some comparisons with overall changes to Antarctic ice. In order to undercut the opportunities from that for climate science deniers and obstructionists creating false perceptions it seems to me that some perspective could be gained by looking at land ice and sea ice side by side, both qualitively (seasonal vs permanent) and quantitively. How does this periodic, winter only increase in sea ice look alongside the estimates of 160 billion tonnes a year of land ice being lost without being replaced? Anyone know how much mass that winter sea ice increase comes to?
-
WRyan at 10:54 AM on 25 July 2014Seal of approval - How marine mammals provide important climate data
With regard to the different heat capacity of the ocean and atmosphere, the absolute heat content of the two systems is not in question here. Rather we are looking at their respective changes in heat content.
The changes in heat content depend on their respective specific heat capacities and the respective changes in average temperature of each system.
The troposphere has had a fairly uniform temperature increase throughout its entire mass. So we can calcualte its increase in heat content by using its entire mass. I don't know if the same can be said of the ocean.
I imagine that heat distribution in the ocean is much slower than heat distribution in the atmosphere, so the temperature increase of the upper ocean is probably different to the temperature change in the deeper ocean. So I don't know how accurate it would be to use the total mass of the ocean when calculating heat gain in recent periods unless you had the average temperature increase for the entire ocean.
-
WRyan at 10:19 AM on 25 July 2014Seal of approval - How marine mammals provide important climate data
Thanks for the graph.
Older calculations had the atmospheric warming at around 2% of the total heat content. These two graphs include periods after 2005 where the atmosphere was not warming. So this difference in atmospheric heat gain might be due to this lack of temperature increase, or maybe Hansen is using a different way calculating heat gain for different parts of the system than was used in the earlier calculations.
-
HK at 05:21 AM on 25 July 2014Seal of approval - How marine mammals provide important climate data
WRyan:
This figure on page 13 in Earth’s energy imbalance and implications by James Hansen et al shows the estimated energy imbalance (rate of warming or cooling) for different parts of the climate system given as watt/m² spread over the entire surface of the Earth.
Notice that the atmosphere has accumulated a nearly negligible fraction of the entire climate system’s heat increase and a pretty small part of the non-ocean climate system as well. The amount of heat penetrating into the ground is several times larger than the accumulation in the atmosphere and the second largest component of non-ocean, after the melting of sea ice and ice sheets.
Regarding the heat capacity of the ocean vs. the atmosphere:
Water has about 4 times larger heat capacity than air measured by mass, i.e. it takes 4 times more energy to heat one gram of water by 1°C than one gram of air. The total mass of the oceans is about 250 timer larger than the atmosphere, hence the 1000-fold larger heat capacity overall. -
CBDunkerson at 04:36 AM on 25 July 2014Where is global warming going?
WRyan... how does the photon know the temperature of the object it would eventually impact if it were emitted? I mean... it could have to travel hundreds of light years to get there. Say a photon emitted from a distant star is going to hit the International Space Station, but if the station hadn't been constructed (hundreds of years after the photon was emitted) then it would have just passed through empty space and continued on to hit the Sun (which in this hypothetical is hotter than the emitting star). How does the photon instantaneously 'know' something that won't happen for hundreds of years? For that matter... how is it NOT emitted just because it will eventually strike a warmer object?
You should really publish on this. Among other things it allows faster than light communication. Aim a laser at a target location and then raise or lower the temperature of that target to higher/lower than the laser's temp and the laser will instantaneously stop emitting when the temperature is higher... regardless of the distance involved. Messages could thus be 'transmitted' instantly to the laser end by changing the temperature at the target end.
-
Mammal_E at 02:33 AM on 25 July 2014Climate models accurately predicted global warming when reflecting natural ocean cycles
What the comments on this post highlight is the difficulty in our brains coming to grips with two very distinct aspects of modeling climate (or any dynamic system):
1) The conceptual and quantitative understanding of mechanism
2) Assumptions about future states that contribute to the quantity being modeled.
Both have to hold true in order to make skillful predictions about future conditions, especially in the short term when essentially random factors can hold sway. Mismatch between predictions and observed conditions (assuming the observations are reliable — that's another topic) can derive from failures of 1) or 2), but 1) is the component that science is most interested in, and is most relevant to long-term prediction. Therefore, to assess the strength of our understanding, we need to figure out how much of the mismatch can be attributed to 2).
Here's an example:As I understand it, my bank balance changes according to this equation:
change in balance = pay + other income - expenses
I can predict how my bank balance will change in the future if I assume some things that are pretty well understood (my monthly paycheck, typical seasonal utility bills, etc.). However, some aspects of the future are random (unexpected car repairs, warm/cool spells affecting utility bills, etc.) — these cannot be predicted specifically but their statistical properties can be estimated (e.g., average & variance of car repair bills by year, etc.) to yield a stochastic rather than deterministic forecast. Also, I could get an unexpected pay raise (ha!), need to help my brother out financially, etc. All of these factors can generate mismatch between predicted changes in the balance and what actually happens.
But (and here's the important bit): that mismatch does not mean that my mechanistic understanding of the system is faulty, because it stems entirely from item 2). How can I demonstrate that? Well, if I plug the actual values of income & expenses into the equation above it yields a perfect match (hindcasting). Alternatively, (as was done by Risbey et al), I could select those stochastic forecasts that happened to get income and expense values close to what actually occurred, and find that the forecasts of those runs are close to the actual change in my balance.
Examining these runs is not "cherry picking" in any sense of the word, it is a necessary step to separate out the effects of items 1) and 2) on model-data mismatch. If these tests failed, that would imply that my understanding is faulty: some other source of gain or loss must be operating. Perhaps a bank employee is skimming?
Climate forecasts are necessarily much less precise than my personal economic forecasts, because the system is observed with error and because many more inputs are involved that interact in complicated, nonlinear, spatially explicit ways. But the logic involved is the same.
-
Christian Moe at 00:56 AM on 25 July 2014New study investigates the impact of climate change on malaria
This sentence doesn't parse:
They downscale global climate models “to provide high-resolution temperature data for four different sites (in Kenya) and show that although outputs from the global and downscaled models predict diverse but qualitatively similar effects,” and some of the modeling approaches led to quite different findings.
Also, there's a stray quotation mark in the Mann quote, which might indicate some text got included in the blockquote that shouldn't be.
-
Tom Curtis at 23:31 PM on 24 July 2014Where is global warming going?
WRyan @94&95, that is the trap of thinking in terms of the temperature of the emitting source rather than the energy of the photon. The Sun also emitts IR radiation, for example. A PV cell behind such a filter would react in the same way to the IR photons from the Sun as it would to IR photons from any other source. Light from an LED or fluorescent light is carried by high energy photons, even though the method of emission is not thermal.
-
WRyan at 21:49 PM on 24 July 2014Where is global warming going?
p.s. With regard to my previous comment. The temperature difference requirement applies only to thermal radiation.
A PV panel can absorb light from a light source like an LED or a fluorescent light without having ot be cooler than the light source. This is because the light from those sources is not being produced by a thermal process.
-
WRyan at 21:44 PM on 24 July 2014Where is global warming going?
just read this article and comments. With regard to the hypothetical photovoltaic IR panel, it would work if it was cooled below the temperature of the emitting body (the earth's surface, in this case.) PV panels work because they are cooler than the Sun's surface, which is where the light originates.
-
WRyan at 20:12 PM on 24 July 2014Climate models accurately predicted global warming when reflecting natural ocean cycles
The text you quoted about spatial trends is from the abstract and it is stated without any context. Perhaps someone who has read the paper can provide that context by giving a description of how the authors support that statement in the main body of the paper.
-
WRyan at 18:35 PM on 24 July 2014Seal of approval - How marine mammals provide important climate data
I'm guessing that the heat absorbed to produce the net loss of ice is also included in the land-ice-air value.
There is also some heat involved in raising the land's temperature. It would be interesting to see that calculated. I can't imagine that heat would penetrate far below the land's surface, but it would have to gain some heat to keep the surface temperature in a rough equilibrium with the increased air temperature over land.
-
Rob Painting at 18:25 PM on 24 July 2014Climate data from air, land, sea and ice in 2013 reflect trends of a warming planet
Ashton - Yes, perhaps it was in the original text and later omitted. Rightly so, there are other data which suggest a robust increase in the Antarctic sea ice even though the Earth is very obviously warming.
-
WRyan at 18:14 PM on 24 July 2014Seal of approval - How marine mammals provide important climate data
That graph is showing the change in heat content. So the relative values probably reflect the fact that that the temperature of the tropopause has increased more than the temperature of the ocean, combined with the much larger volume of the tropopause compared to the volume of ocean water that has undergone a measurable increase in temperature. That's just a guess though.
-
miro at 15:15 PM on 24 July 2014Climate models accurately predicted global warming when reflecting natural ocean cycles
The words used in the context provided definitely seem to signify the spatial trend for the entire Pacific. So therefore the line above is either poorly worded or taken out of context (I don't have access to the paper and so I can't verify, but going off history I'd put my money on the latter).
Indeed I agree that it's not an important point in the context of the paper's goals, but most deniers will be happy to focus on the one incidental discrepency and ignoring the point made by the paper as a whole. This helps them ignore the fact that this paper completely decimates just about the only argument they were hanging onto - that climate models failed to predict the current period of slower warming. This unambiguously shows that the models did in fact predict the current slowdown in warming - within the bounds of what they attempt to predict.
-
scaddenp at 14:21 PM on 24 July 2014Climate models accurately predicted global warming when reflecting natural ocean cycles
I'd go with 1/ more or less. The spatial pattern of interest is the cooling eastern pacific cf warming central-western. This pattern is visible in both the selected models and observation but missing in the anti-phased model. I would definitely say "good" means something different to the authors than it does to Russ. I think it is accurate for the 15 year trend, but somewhat dependent on your expectation to apply it to the spatial trend. However, I think it is a very small point blown right of proportion when it comes to evaluation of the paper as a whole. The main text barely mentions it.
It is easier to make the comparison looking at the figs at HotWhopper than in the Russ gif, if you dont have access to the paper.
-
Chris Crawford at 14:13 PM on 24 July 2014Seal of approval - How marine mammals provide important climate data
Thanks for explaining that for me, Mr. Painting. I had not taken into account the differences due to distribution between land and ocean as a function of latitude. I suppose that there are further differences between the heat capacity in ideal conditions and the heat capacity in practice.
Thanks again.
-
miro at 13:29 PM on 24 July 2014Climate models accurately predicted global warming when reflecting natural ocean cycles
We present a more appropriate test of models where only those models with natural variability (represented by El Niño/Southern Oscillation) largely in phase with observations are selected from multi-model ensembles for comparison with observations. These tests show that climate models have provided good estimates of 15-year trends, including for recent periods and for Pacific spatial trend patterns.
I'm a bit confused by this as well. I must admit looking at the maps of the regional trends around the Pacific look inaccurate based on the graphs shown by Russ. This seems to conflict with the bolded text above. I'm not convinced anyone has really provided a reasonable answer to this. Either;
1) The authors actually mean a different thing when they talk about "Pacific spatial trend patterns" than what Russ believes, and that phrase does not refer to the regional distribution of warming in the Pacific region but rather something else. In this case, what exactly are the authors referring to here?
2) The maps are misleading in some way, making similar trends actually look completely different.
3) The models are in fact inaccurate, and the authors are incorrect in the bolded statement.
It's confusing because the paper's goal seems to be to test whether models can provide the correct global temperature scales if the ENSO input is modelled correctly, and it shows that the models are actually accurate globally. But this almost throwaway line seems to suggest that the spatial distribution of the warming was also predicted correctly, when it really looks like it wasn't.
Some commentators have pointed out that the model's aren't expected to get the spatial distribution of warming accurate, and that's fine, I don't think anyone (excluding Watts, Monckton, et al) can reasonably expect accuracy where the models are not designed to provide it, but if that's the case, why is the bolded phrase even included in the paper?
-
Tom Curtis at 11:45 AM on 24 July 2014Climate models accurately predicted global warming when reflecting natural ocean cycles
Charlie A @32 shows the following image, and comments:
"Figure 2 of this paper show the "small amount" by which forecasted trends have diverged from reality in the sort period of true forecast vs. hindcast. Look closely at the trends from recent observations vs the models. Note it is nearly outside the 2.5 percentile line."

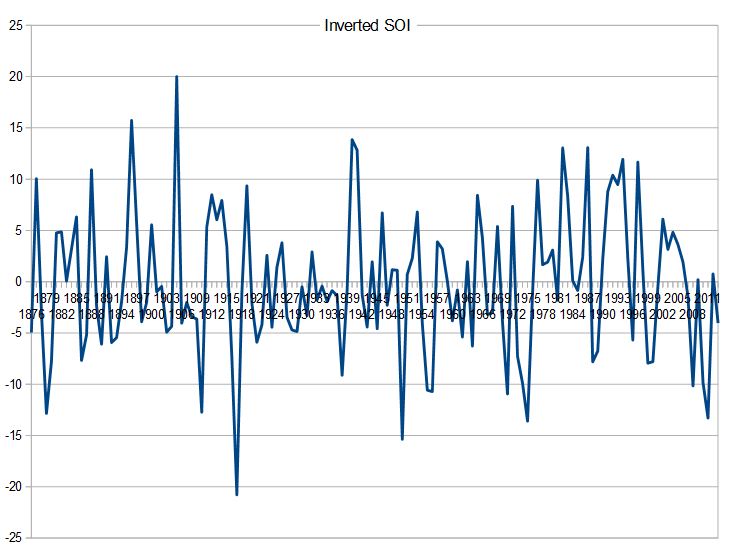
From 97 fifteen year trends, 5 instances of observations being at the 2.5% limit, and two of them being at the 97.5% limit. (Because trends overlap, clusters of trends at the limit are treated as single instances.) That is enough to suggest the models do not capture the range of natural variability, but not enough to data to suggest a bias towards warm or cool result.
Of the two warm episodes, both are associated with strong positive 15 year trends in the inverted, lagged SOI. Of the 5 cool episodes, four are associated with strong negative trends in the lagged SOI. That is, 6 out of seven strongly tending temperature excursions in observed temperatures relative to modelled temperatures are associated with same sign excursions in lagged inverted SOI, and therefore are probably the results of large La Nina trends. The one low escursion not related to ENSO trends occurs in the twenty year period from 1880 to 1899 in which there were twelve major volcanic erruptions (VEI 4 +), leading of with Krakatoa.
When comparing the lagged, inverted SOI trends to GISS LOTI, the match in the early half of the century is quite good (with the exception of the first 20 years). In the latter half of the twentieth, and the early thirtyieth century two discrepancies stand out. One is the major positive trend excursion around 1980 associated with the 1982/83 El Nino. That event coincided with the 1982 El Chichon erruption, the effects of the two events on global temperatures more or less cancelling out. The other is the large disparity in the early twentieth century, where GMST trends are far more positive than would be expected from the SOI trends. Something, in other words, has been warming the Earth far more strongly than would be expected from looking at natural variation alone.

-
Tom Dayton at 11:43 AM on 24 July 2014Climate models accurately predicted global warming when reflecting natural ocean cycles
Yes, thank you Russ for withdrawing your claim of cherrypicking.
You still misunderstand the main purpose of the paper, as revealed by your comment "The higher the correlation, the more the method would treat luck as skill." The authors of the paper did not treat luck as skill. Indeed, they conceived their project on the basis of their and everyone else's explicit and repeated acknowledgment that the GCMs get the timing of ENSO events correct entirely by chance! Their main conclusion was, as scaddenp noted, that the GCMs could be improved substantially (not completely!) in their projections of 15 year periods if the GCMS' timing of ENSO events was improved substantially. The authors did not claim any method for accomplishing that improvement of ENSO timing, and did not even claim that it is possible for anyone, ever, to accomplish that improvement. Their paper leaves unchallenged the suspicion that GCMs forever will lack the skill to accurately project the timing of ENSO events. That means their paper leaves unchallenged the suspicion that GCMs forever will lack the skill to much more accurately project global mean surface temperature for 15 year periods.
What the authors did claim (I think; somebody please correct me if I'm wrong) is that:
- The consequences of ENSO events for global mean surface temperature are responsible for a large portion (not all!) of the GCM's poor projection of global mean surface temperature in 15 year timescales.
- GCMs fairly accurately project the spatial pattern of ENSO events within (only) the Nino 3.4 geographic area (see Steve Metzler's comment of 22:41 PM on 23 July, 2014, on Lewandowsky's post), when by sheer chance the GCMs happen to project the timing correctly. It is fair for you to use your own judgment of what qualifies as "fairly accurate," but my judgment is that the smeared-out temperature of the bad-timing-GCM runs is sufficiently different from the concentrated temperature of the good-timing GCM runs. (See HotWhopper's reproduction of Figure 5's pieces, for easy visual comparison.)
-
Tom Curtis at 11:17 AM on 24 July 2014Climate models accurately predicted global warming when reflecting natural ocean cycles
"[If] the only model problem is phasing of Enso, and the current 15 year GMST trends are below all model runs (or perhaps only below 97.5% of all model runs). then I would expect that either 1) that La Nina in the real world over the last 15 years is at or above the 97 percentile point, or 2) that the distribution of Enso in the entire CMIP5 ensemble of model runs is overwhelmingly biased towards El Nino."
1) The authors of the paper, SFAIK, make no claim that ENSO is the only factor supressing recent observed trends in GMST. Therefore you are not entitled to assume that because the observed 1998-2012 trend in GMST is at the 2.5% limit that the ENSO trend will also be at or near that limit. Indeed, the 4 best modelled trends are unlikely to be within the 2.5% limit of ENSO trends as they are selected only for having the same phase out of far fewer than 100 realizations. Yet they match the observed trend fairly closely (see first figure in OP), therefore falsifying your assumption. (Note, the lower limit is the 2.5% limit, not the 97.5% limit.)
2) Even if a ENSO trend approaching the 2.5% limit was required to explain the depressed observed trend in GMST, it is the trend that needs to be statistically unlikely, not the individual ENSO states in any period. An unusual trend can be formed by a couple of stronger than normal El Nino events at the start of the trend period and a couple of stronger than usual La Nina events at the end of the trend period without any of those events being 97.5% (for El NIno) or 2.5% (for La Nina) events.
3) In the so obvious it is unbelievable that you missed it category, an unusually strong El Nino at the start of the trend period is just as capable of generating a very strong trend as an unusually strong La Nina at the end. Your restricting the test to the later condition only is uncalled for, and very puzzling given that it is known the 97/98 El Nino was unusually strong:

4) Your claim that the observed ENSO trends were not unusual (based solely on claims regarding the strength of recent La Ninas) is not backed up by the data. For temperature based indices (plotted above), the observed percentile rank of the 1998-2012 ENSO trends are:
NINO1+2_|_ NINO3_|_ NINO4_|_ NINO3.4
_10%_____|_ 7.1%___|_ 38.1%__|_ 25.7%That is, two out of four such indices do show very low percentile ranks. That they do not show lower percentile ranks is probably due to two unusualy strong El Ninos appearing in the short record. (Note, the ONI is just the three month running mean of NINO 3.4, and so will differ little from that record.)
5) Single region temperatre indices for ENSO are fatally flawed (IMO) in that they will incorporate the general warming trend due to global warming as a trend to more, and stronger El Ninos. Far better are multiple region indices (such as ENSO 1+2) where the common global warming signal can be cancelled out, or non temperature indices such as the SOI:
The inverted five month lagged SOI trend for 1998-2012 has a percentile rank of 2.52%, compared the GISS LOTI trend of 42.9%. For what it is worth, the inverted, lagged 1998 ranks at the 95.6th percentile in the SOI, and 2011 ranks at the 0th percentile. The inverted, lagged SOI index for 2011 was -17.3, which is less than the strongest shown on the graph above (which was not lagged). The five month lagged 2011 La Nina has a percentile rank of 0.8% among all 12 month averages of the SOI index.
So, when you say the 2011 La Nina was not unusually strong, that only indicates over reliance on one ENSO index, and an unsuitable one in a warming world.
In summary, nearly every claim you make @37 is wrong. To be so comprehensively wrong should be a matter of embarrassment for you. You should certainly pause and reconsider your position.
-
scaddenp at 10:52 AM on 24 July 2014Climate models accurately predicted global warming when reflecting natural ocean cycles
Thank you Russ. That is appreciated.
-
Russ R. at 10:02 AM on 24 July 2014Climate models accurately predicted global warming when reflecting natural ocean cycles
scaddenp @47,
I'll withdraw my "cherry-picking" comment for two reasons:
1. It was never intended as an allegation of fraud, rather of selection bias, in that their selection criterion for the "best" models (agreement by chance with ex-post ENSO trends) was likely correlated with the model output being used to assess of predictive skill (global temperature trends). The higher the correlation, the more the method would treat luck as skill.
2. On further review it turns out that these two items (NINO3.4 trend and global temperature trend) are not nearly as correlated as I had imagined. When looking at 15-year trends, the correlation coefficient is only 0.13 between them.
So... withdrawn.
-
Joel_Huberman at 09:58 AM on 24 July 2014Seal of approval - How marine mammals provide important climate data
Thanks, BaerbelW and Anne-Marie Blackburn, for a very interesting post!
-
scaddenp at 09:56 AM on 24 July 2014Climate models accurately predicted global warming when reflecting natural ocean cycles
This is my personal view on this paper. The paper takes a novel way to test the hypothesis that poor match between ensemble mean and observations is due fact the model mean includes many different states of ENSO whereas observations a "one member of the ensemble". The paper does demonstrate that a mean created from runs which are in phase with actual state are a closer match to observed global temperature. This does underline the importance of ENSO on short term global temperatures. I am sure everyone is very surprized by that result (not!).
I do not think the paper can preclude (and the authors make no such claim) that there are other problems with the modelling. Beyond well-known problems with models, the question about accuracy of aerosol forcing seems to need more data (at least another year) from the Argo network. There could obviously be other errors and inaccuracies still hidden in modelling of feedbacks.
However, what you can conclude is that there is not as yet conclusive evidence of some unknown failure in the models on the basis of a mismatch between ensemble mean and observations: It would appear that issue of ENSO is quite sufficient to explain the mismatch in global surface temperature for such a short term trend.
-
scaddenp at 09:31 AM on 24 July 2014Climate models accurately predicted global warming when reflecting natural ocean cycles
" A minor concern is that the selection criteria (NINO3.4 Index trend) is correlated with the outcome (global trends), meaning that to some extent the study will suffer from retrospective selection bias (which I called "cherry-picking")."
This comment makes no sense. Cherry-picking is a very serious allegation to make about a published paper since it implies fallacious argument with the underlying suspicion of scientific fraud. Unsubstantiated accusations like this are not tolerated by the comments policy. I ask again, how could you test their hypothesis with this data in a way that doesnt use that selection method?
To your points:
1/ The "good" is being used to describe the pattern (not cell-by-cell estimate) compared to the anti-phased ensemble.
2/ It is no news to climate science that models are poor at regional level. Eg see Kerr (2013) (which was discussed at Realclimate here.)
However it does not follow that "if they cant do regional, then global is wrong". This is discussed in detail in papers referenced in the RealClimate article.
-
Russ R. at 07:21 AM on 24 July 2014Climate models accurately predicted global warming when reflecting natural ocean cycles
scaddenp@45,
"I am not totally sure about what question Russ R refers to, but I believe the question may @8. This I answered directly in here..."
Apologies, I didn't realize that the first paragraph of your comment @10 was actually a response to my oft-repeated question (@1, @3, @8, and again @21)... which is why I kept on asking, with increasing frustration.
Since you've been kind enough to answer me, I'll be happy to answer your question @30. (I'll put that response its own dedicated comment next.)
"I think Russ is interested in pushing the point that even the selected scenarios do not match observations particularly well in absolute terms"
The point I've been pushing is this... the paper claims that the "in-phase" models accurately predicted global warming over the 15-year time period AND that the models "provided good estimates of 15-year trends, including for recent periods and for Pacific spatial trend patterns".
I don't take major issue with the first part... the average trends. A minor concern is that the selection criteria (NINO3.4 Index trend) is correlated with the outcome (global trends), meaning that to some extent the study will suffer from retrospective selection bias (which I called "cherry-picking").
But claiming that the models made even "good" spatial trend pattern predictions appears absolutely wrong, as shown by the authors themselves (Figure 5.) where they show a regional comparison of model predictions (best and worst) vs. observations. The relationship between even the "best" model predictions and the data is backwards in every ocean region except for the one region used for selection of the "best" models.
So, two points to make here.
- The claim that the "in-phase" models made "good" predictions of recent spatial trend patterns appears to be invalidated by Figure 5.
- Even if they "in-phase" models got the global trend right on average, that feat looks more like luck than skill when they got every regional trend wrong.
-
scaddenp at 06:28 AM on 24 July 2014Climate models accurately predicted global warming when reflecting natural ocean cycles
I am not totally sure about what question Russ R refers to, but I believe the question may @8. This I answered directly in here though Russ obviously understand spatial pattern differently from me and the authors.
I think Russ is interested in pushing the point that even the selected scenarios do not match observations particularly well in absolute terms (does he really expect any ensemble to do that??) but seems much interested in this rhetoric point than in the more interesting questions as to why and the relative matching skill of phased and anti-phased scenarios.
-
Charlie A at 06:19 AM on 24 July 2014Climate models accurately predicted global warming when reflecting natural ocean cycles
The abstract is only 5 sentences long. The last two sentences (with my bolding) are:
"We present a more appropriate test of models where only those models with natural variability (represented by El Niño/Southern Oscillation) largely in phase with observations are selected from multi-model ensembles for comparison with observations. These tests show that climate models have provided good estimates of 15-year trends, including for recent periods and for Pacific spatial trend patterns."
So the authors selected a subset of the model runs and compared them to observations. They found that this subset of model runs provided good estimates for Pacific spatial trend patterns.
Can someone clarify what is meant by "Pacific spatial trend patterns" in this context. Do the authors mean basin-wide trend patterns; trend patterns in the same Enso 3.4 area used to select the subset of models; something else entirely?
-
Rob Painting at 06:07 AM on 24 July 2014Seal of approval - How marine mammals provide important climate data
Chris - They are two different things. The ocean has the capacity to hold a thousand times more heat than the atmosphere, but we live on a rapidly rotating sphere where the bulk of incoming energy from the sun is received in the tropics.
In practice, because of Earth's geometry, the shape of the ocean basins, the percentage of land vs ocean in the tropics, and a host of other considerations, we're never going to actually see a thousand times more heat in the ocean than the atmosphere.
The 93.4% figure is the percentage of heat going into the ocean, whereas the specfic heat capacity is an idealized scenario.
-
Chris Crawford at 05:32 AM on 24 July 2014Seal of approval - How marine mammals provide important climate data
Actually, I have a serious question, concerning the graph of ocean heat versus atmospheric heat. Long ago, I did the calculation of the relative heat capacities of the oceans and the atmosphere and came up with a result of 99% of the net heat capacity of the two was held in the oceans. I have seen other calculations yielding 99.9%, 99%, and even 90%. Figure 1 suggests 90%. I realize that there are complexities arising from freshwater, and the amount of water vapor in the air, especially involving the latent heat in water vapor. Can somebody please explain the basis for the different answers?
-
Chris Crawford at 05:22 AM on 24 July 2014Seal of approval - How marine mammals provide important climate data
I'm sorry, but that seal looks very much like she's saying "Does this hat make me look fat?"
-
MA Rodger at 04:53 AM on 24 July 2014Why we care about the 97% expert consensus on human-caused global warming
troyvit @6.
Your linked item "The Control Group Is Out Of Control" is mainly about parapsychology and the examples it looks at in wider science are still pretty soft psychology (eg social priming) plus the odd reference to pharma research. The argument offered by your linked item is that a subject that is so obviously crackpot like parapsychology must then be subject to much more suspicion, and thus much higher levels of checking, if parapsychology can fail to spot so much unreplicable work, what of other sciences where suspicion and checking would be less? Is it valid to conclude as the item quotes "It just means that the standard statistical methods of science are so weak and flawed as to permit a field of study (parapsychology) to sustain itself in the complete absence of any subject matter."?
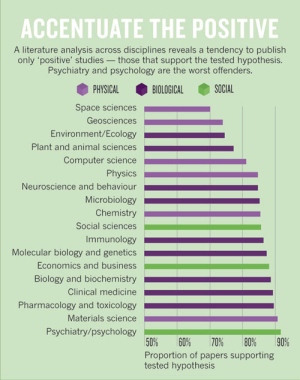
Well, the level of defense in psychology/psychiatry literature appears to be the problem and one that doesn't extend to geosciences & enviro-eco science, as this graphic from a subsequently-linked Nature article illustrates. (The position of Material Sciences second from bottom may be to do with initial results being far more strongly based in such a physical area of study.)
-
Bob Lacatena at 04:34 AM on 24 July 2014Climate models accurately predicted global warming when reflecting natural ocean cycles
RussR does not appear to understand the most basic aspects of the paper, or of climate modeling. His tone and anger suggest that his misreading / misinterpretation of the subject and paper is either consciously or unconsciously willful.
I would suggest that arguing with him is a complete waste of time. Certainly, correct his mis-statements, for the sake of lurkers and other readers, but engaging him directly is pointless.
-
dhogaza at 02:47 AM on 24 July 2014Climate models accurately predicted global warming when reflecting natural ocean cycles
"ENSO-like variations in the models differ in phase based upon the individual runs."
I think a couple of people posting here probably haven't figured out that a finite number of runs (I think a few dozen are typical) which exhibit internal variability means that it's largely chance as to which model runs (and therefore which models) will be in phase for the historical recent ENSO history for each 15 year period.
Run each model a few more dozen times, select according to their algorithm in the same way, and for each 15 year period the model's whose runs match the historical 15 year period will differ ...
I think it's a rather ingeneous approach. Some model teams can (and have) performed hindcast runs plugging in known values for natural variability but that's expensive, much more expensive than this approach, and can't be done external to the team (unless you happen to have a massive supercomputer sitting in your basement).
-
Dikran Marsupial at 02:19 AM on 24 July 2014Why we care about the 97% expert consensus on human-caused global warming
troyvit academics have very little to gain by following the crowd, we are generally a rather disagreeable lot that spend our time finding fault with the work of others (and more importantly trying to do better). To get highly cited papers, you need to find out something that people don't already know, and the best way to do that is to be different.
The reason that we have a consensus is not because we are all following the crowd, but because reality places constraints on which hypotheses are plausible. The reason that there is a consensus on, for example that the rise in CO2 is anthropogenic, is not because we all agree with eachother, but because the alternative hypothesis is inconsistent with the observations. Of course that doesn't mean there are not still some scientists that disagree, and even the occasional one that manages to get something published in a journal, despite it being incorrect. That is why it is 97% not 100%.
-
Rob Honeycutt at 01:51 AM on 24 July 2014Why we care about the 97% expert consensus on human-caused global warming
troyvit... Don't you think it would be hard to get to a 97% consensus if scientific results were biases along political lines?
I think what you do find is, when scientists express their opinion outside their specific area of expertise, that opinion is going to be far more influenced by their political views over research.
-
troyvit at 01:47 AM on 24 July 2014Why we care about the 97% expert consensus on human-caused global warming
Maybe I'm wrong, but my conservative friends aren't distrustful of science, but rather of scientists, and they have a point. If an intelligent, analytical conservative is more likely to go with his or her crowd, then who is to say that (regardless of political affiliation) scientists wouldn't be victims of their own cultural biases?
Before you say that scientific method is designed to short-circuit that kind of behavior I recommend reading this article:
http://slatestarcodex.com/2014/04/28/the-control-group-is-out-of-control/
which shows just how easy it is to taint the scientific method with preconceptions — even unconsciously.
By the way I believe global warming is human-created.
-
KR at 00:35 AM on 24 July 2014Climate models accurately predicted global warming when reflecting natural ocean cycles
Russ R. - From the paper:
To select this subset of models for any 15-year period, we calculate the 15-year trend in Niño3.4 index in observations and in CMIP5 models and select only those models with a Niño 3.4 trend within a tolerance window of 0.01K y-1 of the observed Niño 3.4 trend. This approach ensures that we select only models with a phasing of ENSO regime and ocean heat uptake largely in line with observations.
In the 1998-2012 period 4 models met that criteria, for 1997-2011 a different subset, and so on for each 15-year window. As noted above, "The sizes of the dots are proportional to the number of models selected" for each window.
Your false statement is "excluding other models" - all of them were considered for each window, and subsets were selected for each window based on the stated similarity criteria to see how they differed.
ENSO-like variations in the models differ in phase based upon the individual runs. Since the entire purpose of the paper was to see if those models in phase with observational ENSO matched better or worse than those not in phase, the criteria used is entirely reasonable.
-
Charlie A at 00:26 AM on 24 July 2014Climate models accurately predicted global warming when reflecting natural ocean cycles
Perhaps CBDunkerson @38 is taking exception to your use of terms model and model run interchangeably.
I note that the authors also do this. For an example, see the caption to first figure in this blog post where "The sizes of the dots are proportional to the number of models selected. "
It is unclear to me whether the dot size is truly the number of models selected or the number of model runs.
-
Russ R. at 00:09 AM on 24 July 2014Climate models accurately predicted global warming when reflecting natural ocean cycles
scaddenp @30,
I'll happily answer your question, as soon as someone answers mine.
I asked first (two days ago). You can kindly wait your turn.
CBDunkerson @38
Russ wrote: "The authors took an ensemble of 38 models, and selected a narrow subset (~4) for analysis, excluding the other models."
"Russ, you do get that people are objecting because this is straight up false, right?"Perhaps you might like to try this simple quiz...
- How many models were available for study in the CMIP5 archive?
- How many models were excluded because they lacked outputs of sea surface temperatures for the NINO3.4 region?
- Of the remaining models with NINO3.4 outputs, how many were selected for analysis in each 15-year period as being "in-phase" with ENSO?
Answers:
- 38.
- 20.
- The number of selected "in-phase" models varied for each 15 year period, but only 4 models were selected for the most recent period from 1998-2012.
What part of my statement was "straight up false"?
Moderator Response:[Dikran Marsupial] Please can both sides of this discussion dial back the tone. RussR, answer scaddenp's question and address CBDunkerson's question directly, without sarcasm. If you want scaddenp to answer your question, please restate it politely. I will be monitoring this discussion and will summarily delete any post that violates the comments policy. Note especially:
No profanity or inflammatory tone. Again, constructive discussion is difficult when overheated rhetoric or profanity is flying around.
Please can everybody resist responding to RussR's post until he has first answered these two questions in a reasonable manner.
-
One Planet Only Forever at 23:29 PM on 23 July 2014Deep Decarbonization Pathways Project (DDPP) Presents Interim Report to UN Secretary-General Ban Ki-Moon
This is a fabulous discussion.
I would add that economic activity that the entire human population can be allowed to choose to develop to benefit from and continue doing forever will allow constant growth by the creative development of even better 'sustainable activity'.
Any other kind of activity may be incredibly popular and profitable among a portion of the global population for a moment of human future, but damaging activity that cannot be benefited from by everyone, and cannot be continued to be benefited from indefinitely, is a threat to the sustainability of the economy and of humanity. That type of activity is the root cause of most of the viciuous and damaging conflicts that have ever occurred and continue to occur.
This planet is finite and should be habitable by humanity for several hundred million years. Humanity really needs to figure out how to collectively make the best of this good thing, meaning humanity's future depends on competing to develop the best ways of keeping people who don't care about the develoment of a sustainable better future for all life from 'succeeding'.
-
greenhousegaseous at 22:37 PM on 23 July 2014Deep Decarbonization Pathways Project (DDPP) Presents Interim Report to UN Secretary-General Ban Ki-Moon
Larry, my twisting of the Pareto Principle was a joke, one I have used in managing projects during a very long career. I start with the traditional 80/20 idea and then focus the team down to the *really* important things to help them find the critical path.
And the 5% I mention isn’t quite the same thing as what Anderson talks about. I was referring rather to the 5% of countries that are doing almost all the damage, in terms of emissions. He’s talking about the societal segment that represent the really serious burners.
Nor did I mean to suggest that the solution implemented should only include the energy gluttons. I completely concur that all need to be actively involved. But the vast majority of countries burn very little FFs per capita. So the main difference is that for most countries, the solution needs to focus on the females: get them educated and empowered to get the birthrates down faster than the UN projects, and get them to financial independence as small business owners ASAP. This goal also confronts the religious and cultural barriers that have driven social economy for centuries.
As Rob repeats, putting a price on carbon via taxation is the critical path step. I add regulation and alternative energy funding. And reaching critical political mass is the prerequisite to both.
The cold truth is that in the taxation/regulatory steps, the poor and developing countries will not play a significant role, in the next 2 or 3 decades. That doesn’t mean they should be ignored.
I agree that the affluent minority is the barrier to seriously meaningful decarbonization. I do not think that class will soon or willingly surrender their privileged lifestyle. So our real challenge is to stage a (hopefully bloodless) revolution, one that restructures consumption globally without imposing some dogmatic sociopolitical agenda.
Prev 693 694 695 696 697 698 699 700 701 702 703 704 705 706 707 708 Next


