


 Arguments


Recent Comments
Prev 718 719 720 721 722 723 724 725 726 727 728 729 730 731 732 733 Next
Comments 36251 to 36300:
-
franklefkin at 01:37 AM on 15 May 20142013 Arctic Sea Ice Extent Prediction
When are 2014 predictions going to happen?
-
Bob Lacatena at 00:33 AM on 15 May 201497% - A Statistically Representative Debate On Global Warming
Bart, here are the 10. A quick read of their abstracts shows that they are indefensible garbage that should never have been published, and many got in by being submitted to "Energy" journals rather than climate science journals (i.e. they gamed the system by finding editors "friendly" to their results).
For example, one claims this:
The author suggests that neither modeling nor analyzing the resulting data show the presence of warming in the World Ocean; hence, there is no global warming in the atmosphere either.
Another has this childish observation to make:
The authors believe that recent global warming of Earth’s atmosphere is not due to an increase in anthropogenic carbon dioxide emission but rather to long-term global factors. The human contribution to the CO2 content in the atmosphere and the increase in temperature is negligible in comparison with other sources of carbon dioxide emission.
Look at them all. They're an embarrassing joke.
-
Bart Strengers at 00:03 AM on 15 May 201497% - A Statistically Representative Debate On Global Warming
@Curtis
I understand your point, but I am still curious which studies John was talking about. (Or does he refer to them in his paper?)
-
Tom Curtis at 22:47 PM on 14 May 201497% - A Statistically Representative Debate On Global Warming
Bart Strengers @9, the peer review process is a spam filter for scientists. There are so many scientists and non-scientists wanting to publish their theories that if they all were published, any scientist wanting to keep up with the literature would be swamped by a sea of ridiculous, crackpot or poorly researched papers and have little time for the good papers that truly advance the science. This first started being a problem early in the twentieth century, so early in the twentieth century various journals started taking steps to weed out the pseudo-scientific spam. Those steps developed into the modern peer review system, in which, in order to be published you need to convince just three people (and editor and two peer reviewers) that your research is not obviously wrong. If you don't convince the first three you try, you can submit to another journal and try there. And again, and again.
Once you have been published in peer review, you have the imprimature of those three people that your theory is:
1) Not transparently wrong;
2) Does not include any obvious errors that can be picked up without redoing the maths;
3) Is well enough written that other people have a reasonable chance of determining what you did, and repeating it if they want to.
For most science publications, there may be some other criteria, ie, that it deals with a particular fairly general subject, that it challenges current views, that it can be communicated briefly, and so on, but no journal requires all, or even most of these additional criteria.
Fairly obviously, the first three criteria are not onerous. So like all spam filters, the peer review system sometimes lets spam through. The system works fairly well, so that the amount of spam tends to be very limitted. As some does get through, and as the general criteria are not that onerous, that is were the second tier or peer review comes in, ie, the response or otherwise of other scientists in the related field. and how much it effects the related field. Nearly all skeptical papers fair poorly in that regard.
In any event, the way most skeptical papers get published is that they are examples of some of the spam that gets through - in some cases through deliberate attempts to game the system. Some, on the other hand, are older papers that were on the cutting edge of the debate at the time of publication, but which subsequent publications have shown to be flawed.
-
Bart Strengers at 22:16 PM on 14 May 201497% - A Statistically Representative Debate On Global Warming
Great video indeed!
However, a sceptic might say: this Cook study shows there are 10 studies in the category 7 (i.e. against AGW in a quantified manner). Albert Einstein would say that 1 is enough. Actually there are 15 more in category 6. What do these studies say and why did they pass the peer review process?
-
YahooMike at 15:13 PM on 14 May 2014Phil Jones says no global warming since 1995
I participate in YA global warming forum and the deniers there always drop "statistically significant" but he went on to say the average warming for the period I think was 0.2C yearly which is a slight warning
Just another case of cherrypicking
-
John Hartz at 14:28 PM on 14 May 2014CO2 increase is natural, not human-caused
chris626: The first comment you posted on this thread was deleted by me because it did not comply with the SkS Comments Policy.
Please note that posting comments here at SkS is a privilege, not a right. This privilege can be rescinded if the posting individual treats adherence to the Comments Policy as optional, rather than the mandatory condition of participating in this online forum.
Please take the time to review the policy and ensure future comments are in full compliance with it. Thanks for your understanding and compliance in this matter.
-
John Hartz at 14:14 PM on 14 May 2014CO2 increase is natural, not human-caused
All: Please do not dogpile any future comments posted by Chris626. Dogpiling is both unnecessary and unseemly. Furthermore, it is prohibited by the SkS Comments Policy.
-
Stephen Baines at 13:11 PM on 14 May 2014We can't count on plants to slow down global warming
I'm always puzzled by those who claim plants will save us by taking up CO2. If that were true it would already have happened, while CO2 was still at levels that didn't saturate uptake by Rubisco. The current increase of CO2 was happening despite the fact that, up to this point, photosynthesis was still sensitive to CO2.
In that same vein, this finding may be a good thing going forward, or at least less than bad thing. If CO2 were stimulating carbon sequestration previously, we could not expect that level of sequestration to continue to keep pace with CO2. That would mean a possible decline in sequestration and an increase in the airborne fraction in the future.
Now it appears that that sequestration was never happening in the first place...or at least not much. So that means were are not likely to get surprise increases in the airborne fraction in the future, at least not from this source.
-
Tom Curtis at 09:56 AM on 14 May 2014Animals and plants can adapt
Following Scott Sinnock's (@34) advice, I searched Google Images for "tertiary temperature". The most relevant, prominent image was this one (originally from wikipedia):
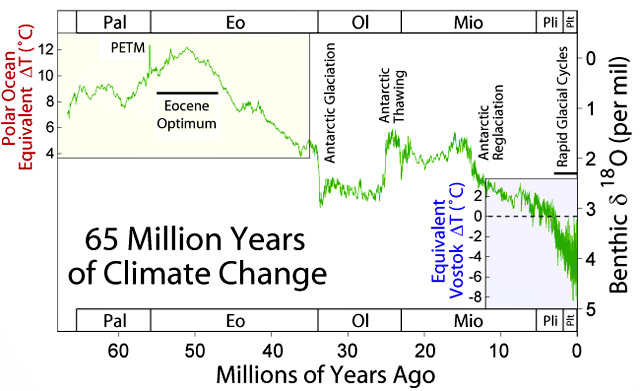
The data is from dO18 from foraminafora shells on the ocean floor. dO18 records both the ratio of fresh to salt water, and water temperature. Consequently dO18 records do not linearly equate to temperature records between different periods with very different ratios of fresh to salt water, as when large quantities of ice are locked up in ice sheets. Hence the two different temperature scales.
As Stephen Baines mentions, the paper cited in the OP shows a temperature record for the tertiary. Indeed, it shows the data in the image above, first in an unmodified form and then adjusted for the size of ice sheets to give a direct temperature measurement (Fig 3(b)):
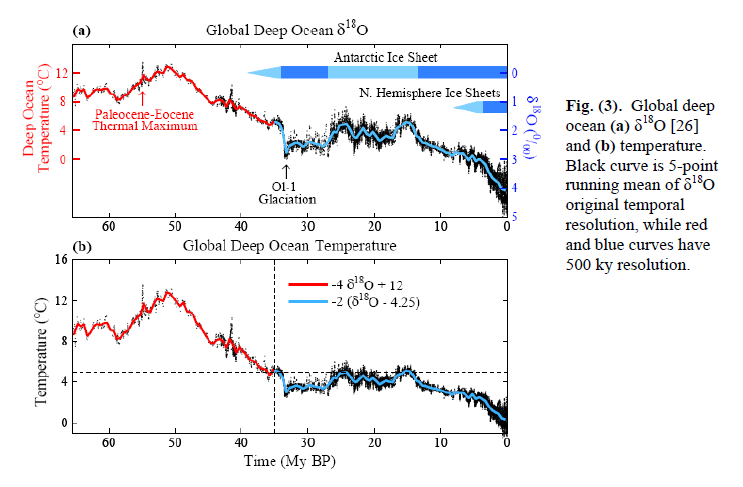
As you can see, temperatures did not consistently exceed 4 C above mid-twentieth century values until 35 million years ago.
Finally, I did see two images that showed temperatures in the 20 degree range. One showed central european temperatures only, and hence was not representative of global temperatures. The second was the crude graph by Scotese which is (in its original form), not proxy based, but merely assigns a warm temperature for periods without glaciation, and a cool temperature for periods with extensive glaciation. It also showed global average temperatures rather than the global temperature anomaly, and therefore showed at most a 7 C increase over modern temperatures at any time in the tertiary. I do not know what figure Scott Sinnock was basing his claims on, but they are not warranted by the limited evidence he provides.
-
Tom Curtis at 08:11 AM on 14 May 2014Sense and climate sensitivity – more evidence we're in for a hot future
An addendum for my prior post:
Kummer and Dessler state of the forcing data:
"Forcing comes from the IPCC’s Fifth Assessment Report [Table 8.6 Myhre et al., 2013], which provides forcing broken down by component."
And:
"The forcing time series is referenced to the late-19th century, which means that the temperature anomaly time series must also be referenced to that same time."
However, the IPCC AR5 WG1 table 8.6 gives values for various IPCC reports including:
"AR5 (1750–2011)"
It's caption reads:
"Summary table of RF estimates for AR5 and comparison with the three previous IPCC assessment reports. ERF values for AR5 are included. For AR5 the values are given for the period 1750–2011, whereas earlier final years have been adopted in the previous IPCC assessment reports."
That clearly proves that Kummer and Dessler were in error in claiming that the forcings tabulated on Table 8.6 were "...referenced to the late-19th century". It is about that point only that I have said that they are wrong.
-
Tom Curtis at 07:59 AM on 14 May 2014Sense and climate sensitivity – more evidence we're in for a hot future
Michael Sweet @17, I had read what Shindel wrote. It is, however, largely irrelevant because:
1) We are discussing Kummer and Dessler (2014), not Shindel et al (2010); and (more importantly,
2) Kummer and Dessler use 1880-1900 as there baseline period, not 1850.
Because of the later point, it is not possible to straightforwardly apply Shindel's comments to Kummer and Dessler. What is true of 1850 may well not be true of 1880-1900.
Further, the discussion of failure to use all forcings by Nic Lewis in criticizing to Shindell et al probably is not relevant to Lewis's superficially similar criticism of Kummer and Dessler. In fact Lewis does not show his working, so he may only have modified for the average anthropogenic forcing for 1880-1900. From the wording of his comment at Bishop Hill, however, it is far more likely that he has used the average of the net forcings (anthropogenic plus natural).
Finally, in a way I have argued that the first of Shindell's ways of resolving the issue for 1850 also applies for 1880-1900. It will almost certainly result in a small error of indeterminate sign, which is no criticism at all in science. I have, however, argued that his second method cannot be used in 1880-1900 because of the distorting effect of the volcanic erruptions, and in particular Krakatoa. That is an almost negligible consideration in 1850, where the closest preceding volcano was more than ten years prior and hence of negligible remaining effect.
-
Stephen Baines at 07:54 AM on 14 May 2014Animals and plants can adapt
Scott...before you simply presume that the post is "egregiously misrepresenting" facts, you should read the paper its referencing, which, lo and behold, has a reconstruction of temperatures through the Cenozoic! It may even be the one you are referring to!
That reconstruction indeed shows that there are deep ocean temps in the Eocene era that were substantially greater than today, but those were 55 million years ago. It also shows that the last time temps were consistently 4C higher than current was just prior to the Antarctic glaciation 34 mya. There may have some periods that were a touch more than 4C warmer in the following 10 million years, but that was still 24 million years ago. The point of this post is that we are likely to recapitule tens of millions of years of climate history in the span of a century or two.
If you have a reconstruction that says otherwise, link to it. Otherwise we have no idea what you're specifically talking about, and it is therefore impossible to clarify things.
Then again, maybe you really aren't interested in actually discussing the evidence.
-
scaddenp at 07:46 AM on 14 May 2014CO2 increase is natural, not human-caused
I dont want to dogpile, but Chris626 is only looking at one of the lines of evidence presented (getting the accounting wrong). If it is "crap" then explain the isotopic evidence and ocean acidification.
While the planet might have had higher levels in past, (but also different solar input) the problem is rate of change (because adaption takes a long time), not the final temperature.
-
Dikran Marsupial at 06:55 AM on 14 May 2014CO2 increase is natural, not human-caused
Chris626 wrote "The simple accounting demonstration that CO2 increase is manmade is pure crap."
so all of the worlds carbon cycle specialists are wrong, no hubris there then! ;o)
"Let humans be part of the nature term NE (as we are)"
This is just silly, if you define humans as part of nature the word "anthropogenic", "artificial" and ultimately "natural" have no meaning.
" let a group of animal species A be the one that produce some extra CO2 by an amount of 30 GT "
The flaw in this argument is obvious. The carbon dioxide that animals produce through respiration is directly (in the case of herbivores) or indirectly (in the case of carnivores) derived from plant matter, which is contructed from carbon dioxide taken out of the atmosphere. Thus all animals merely return to atmosphere the carbon that was taken out of it via photosynthesis, and hence are essentially carbon neutral. Now if you can identify an animal species where this is not the case and is increasing the amount of carbon moving through the carbon cycle, then you might have the beginings of an argument.
"Why should humans be solely responsible for all CO2 production added to the atmosphere? Is this some sort conspiracy against humans? Why not share the blame among all species, animals and humans included?"
because humans are the only animals that introduce additional carbon into the carbon cycle by extracting it (in the form of fossil fuels) from the lithosphere and burn it, which puts it in the atmosphere.
"How uglier can it get?"
Rather ironic thatyou should ask that, given you started your post by calling the work of eminent scientists "crap".
It is sad that there are skeptics that can't even accept that the increase in atmospheric CO2 is due to anthropogenic emissions when the evidence is unambiguous and unequivocal. If the natural environment (including all the animals) were a net carbon source, the atmospheric CO2 would be rising faster than anthropogenic emisssions as both nature and mankind would be net sources. However we know for sure that this is not the case, the observations rule that out completely.
-
Tom Dayton at 06:41 AM on 14 May 2014CO2 increase is natural, not human-caused
Chris636: Of course the CO2 level eventually will stabilize--when humans eventually run out of fossil fuels to burn. The problem is that the ill effects of those high CO2 levels will get much, much worse, for a very, very long time in the time scale of human lives, civilization, and even species. See RealClimate for a couple of relevant posts.
-
Stephen Baines at 06:34 AM on 14 May 2014CO2 increase is natural, not human-caused
Chris636
You are not doing the accounting correctly. It's not enough to simply produce CO2. You have to have a net exchange from one reservoir to the other.
So, for your example to work, the respiring organisms would have to cause a net loss of plant carbon to the atmosphere. To match the observed increase in atmospheric CO2, you would have to move about 250 petagrams of carbon from the terrestrial biosphere to the atmopshere (current - preindustrial atmsopheric CO2 = 850 Pg - 600 Pg).
That is 40-60% of current living terrestrial plant biomass (terrestrial plant C ~450 - 650p petagrams C according to the IPCC.) About 2/3s of that deline in terrestrial biomass would have occured since 1970. There is large uncertainty around estimates of plant biomass for sure, but you bet we would have noticed such a massive decline over such a short period of time.
As indicated in the post, the CO2 accumulating in the atmosphere is highly depleted in 14C. We know it is therefore tens of thousands of years old because that is how long it takes for 14C to decay completely. That age rules out everything except fossil fuels.
It is simple accounting in the end. Really, scientists are not so stupid to miss something so obvious. If individuals had been, you can bet their competitors would take them to task!
-
DSL at 06:24 AM on 14 May 2014Animals and plants can adapt
Regardless of what your link says, Scott, you're not reading carefully:
"A low-range optimistic estimate of 2°C of 21st century warming will shift the Earth’s global mean surface temperature into conditions which have not existed since the middle Pliocene, 3 million years ago. More than 4°C of atmospheric heating will take the planet’s climate back, within a century, to the largely ice-free world that existed prior to about 35 million years ago."It doesn't make the claim you say it makes. It compares a potential 2100 with the "largely ice-free world" of about 35mya.
-
DSL at 06:19 AM on 14 May 2014Animals and plants can adapt
Scott, can you provide a link? See the "insert" tab above the commenting box.
-
Scott Sinnock at 06:10 AM on 14 May 2014Animals and plants can adapt
The author claims in item (B) that a 4 degree or so increase in global temperature will make things hotter than anytime in the past 35 million years. WRONG, at least according to graphs I see of Tertiary temperatures at Google "Tertiary Temperatures" (Images), which show temperatures up to 20 degrees hotter at about that time, even more earlier. So why should I believe anything else you tell me if you so egregioulsy misrepresent such easily available "facts"?
-
WheelsOC at 05:39 AM on 14 May 201497% - A Statistically Representative Debate On Global Warming
I've actually proposed this exact demonstration (well, I usually cut the numbers by a third) as a way to illustrate the dangers of false balance in the media for years now.
I shall await my check from HBO.
-
DSL at 05:32 AM on 14 May 2014CO2 increase is natural, not human-caused
Chris, plants take carbon out of the atmosphere. Animals eat plants. Animals breathe out CO2. In general, animals are carbon neutral, just as human breathing is carbon-neutral. Humans, however, are also digging up and burning billions of tons of carbon that has been stored in the Earth over hundreds of millions of years. We're adding the carbon of the past to the present (and future).
-
Chris636 at 05:20 AM on 14 May 2014CO2 increase is natural, not human-caused
SIMPLE ACCOUNTING REVISITED "IT’S THE ANIMALS"
Simple Accounting Revisted "It's the Animals"
The simple accounting demonstration that CO2 increase is manmade is pure crap.
Animals and plants produce more than 220 GT of CO2 per year. Let’s just change a few words. Let humans be part of the nature term NE (as we are) and let a group of animal species A be the one that produce some extra CO2 by an amount of 30 GT (we can certainly find some species to be blamed). Then we have the same result,
NE-NA = -15
but now the added CO2 is blamed on animals, not humans. Why should humans be solely responsible for all CO2 production added to the atmosphere? Is this some sort conspiracy against humans? Why not share the blame among all species, animals and humans included?
In any way, the NE and NA terms will balance in the future (CO2 will stabilize as it always did in history) and humans and animals will keep on living. As is well known, CO2 levels have been much higher in the history of the planet and life kept growing despite of it. I'm just sick of alarmists and skeptics bashing against those who have another perspective about this whole topic and who, ironically, are also skeptics. Skeptics against skeptics. How uglier can it get?Moderator Response:[TD] Please do not use all caps, because it is the web equivalent of yelling. Instead use the bold and italic formatting controls.
-
Paul D at 05:10 AM on 14 May 201497% - A Statistically Representative Debate On Global Warming
Very good.
Sums up what we have all been thinking and discussing for many years now.
But the reality is that a public media debate is a political platform designed to promote personalities, it isn't suitable for discussing the truth about science. Which is why any one on one debate about climate science will present a false balance and will promote the characters taking part in the debate, rather than any science.
-
citizenschallenge at 03:57 AM on 14 May 2014Volcanoes emit more CO2 than humans
It occurs to me,
Why not have a "Counter" set at
human greenhouse gas emissions are equaling x volcanes erupting,
(say... X Mt. Pinnatubos = current human emissions?)
-
ubrew12 at 03:41 AM on 14 May 201497% - A Statistically Representative Debate On Global Warming
I refuse to change my denial stance until Oliver holds his statistically representative debate on a rickety footbridge...
-
DSL at 03:30 AM on 14 May 2014Antarctica is gaining ice
ugh - "Antarctic land and sea ice"
-
DSL at 03:29 AM on 14 May 2014Antarctica is gaining ice
b1rdinski, this is a thread on Antarctic sea ice. There are many other threads at SkS more appropriate to your concerns.
I'll also point out that the fundamental piece in the theory of anthropogenic global warming is simply the theory of the greenhouse effect (GHE). That theory (the GHE) is one of the strongest science has to offer.FYI: If you want to avoid having your comments deleted--that is, if you want your voice to be heard--you'll need to show that you're capable of 1) understanding/recognizing the responses people give you and 2) providing evidence to support your claims.
Moderator Response:[JH] If I had seen b1rdinski's comment prior to your reponding to it, I would have deleted it for being in violation of the SkS Comments Policy.
Geneally speaking, when someone posts a comment that looks like and smells like concern trolling, it would behoove everyone to refrain from responding until a Moderator has had a chance to review the comment and take appropriate action.
Please let the official Moderators moderate the comment threads.
-
Composer99 at 03:20 AM on 14 May 2014Antarctica is gaining ice
b1rdinski:
Assuming your comment survives moderation, as it may well be considered sloganeering, your argument from ignorance (that is, lack of knowledge) is not universalizable.
You may not know what's been going on with paleoclimate. That doesn't mean no one knows.
So instead of asserting with such certainty that "no one knows why it has cooled and heated for those millions of years" - because you are incorrect - how about you start by asking how scientists know what they know? You might even get a helpful answer.
Moderator Response:[JH] If I had seen b1rdinski's comment prior to your reponding to it, I would have deleted it for being in violation of the SkS Comments Policy.
Geneally speaking, when someone posts a comment that looks like and smells like concern trolling, it would behoove everyone to refrain from responding until a Moderator has had a chance to review the comment and take appropriate action.
Please let the official Moderators moderate the comment threads.
-
b1rdinski at 02:53 AM on 14 May 2014Antarctica is gaining ice
I know that all of these scientists are much smarter than me, but there are millions of years of data no one has. It is so easy for all of these scientists to get all caught up in the details they have learned and focus on this fact and that fact, but the truth is they don't know much of anything, no one does!!!! They have a less than miniscule snapshot of what has happened in the last however many years and they are claiming their beliefs in climate change are fact. The earth has warmed and cooled for millions of years. No one knows why it has cooled and heated for those millions of years. As a society we can't even predict the weather with much accuracy, why does anyone believe they can predict what is happening to the earth? So pretentious....
Moderator Response:[JH] If I had seen this comment prior to anyone reponding to it, I would have deleted it for being in violation of the SkS Comments Policy.
Geneally speaking, when someone posts a comment that looks like and smells like concern trolling, it would behoove everyone to refrain from responding until a Moderator has had a chance to review the comment and take appropriate action.
-
Rob Honeycutt at 02:10 AM on 14 May 201497% - A Statistically Representative Debate On Global Warming
No. Talking about "the three" deniers in John Oliver's piece. Within the deniosphere there are multiple positions that are not mutually consistent.
Moderator Response:[JH] Thanks for the clarification. I will delete my prior comment.
-
michael sweet at 01:20 AM on 14 May 2014Sense and climate sensitivity – more evidence we're in for a hot future
Tom,
You state that "Kummer and Shindler are simply wrong in saying the forcing data is referenced to the late 19th century"
Shindlell says:
"The second substantive point Lewis raised relates to the time period over which the TCR is evaluated. The IPCC emphasizes forcing estimates relative to 1750 since most of the important anthropogenic impacts are thought to have been small at that time (biomass burning may be an exception, but appears to have a relatively small net forcing). Surface temperature observations become sparser going back further in time, however, and the most widely used datasets only go back to 1880 or 1850. Radiative forcing, especially that due to aerosols, is highly uncertain for the period 1750-1850 as there is little modeling and even less data to constrain those models. The AR5 gives a value for 1850 aerosol forcing (relative to 1750) (Annex II, Table AII.1.2) of -0.178 W/m² for direct+indirect (radiation+clouds). There is also a BC snow forcing of 0.014 W/m², for a total of -0.164 W/m². While these estimates are small, they are nonetheless very poorly constrained.
Hence there are two logical choices for an analysis of TCR. One could assume that there was minimal global mean surface temperature change between 1750 and 1850, as some datasets suggest, and compare the 1850-2000 temperature change with the full 1750-2000 forcing estimate, as in my paper and Otto et al. In this case, aerosol forcing over 1750-2000 is used.
Alternatively, one could assume we can estimate forcing during this early period realistically enough to remove if from the longer 1750-2000 estimates, and so compare forcing and response over 1850-2000. In this case, this must be done for all forcings, not just for the aerosols. The well-mixed greenhouse gas forcing in 1850 is 0.213 W/m². Including well-mixed solar and stratospheric water that becomes 0.215 W/m². LU and ozone almost exactly cancel one another. So to adjust from 1750-2000 to 1850-2000 forcings, one must remove 0.215 W/m² and also remove the -0.164 W/m² aerosol forcing, multiplying the latter by it’s impact relative to that of well-mixed greenhouse gases (~1.5) that gives about -0.25 W/m².
If this is done consistently, the denominator of the climate sensitivity calculation containing total forcing barely changes and hence the TCR results are essentially the same (a change of only 0.03°C). Lewis’ claim that the my TCR results are mistaken because they did not account for 1750-1850 aerosol forcing is incorrect because he fails to use consistent time periods for all forcing agents. The results are in fact quite robust to either analysis option provided they are done consistently."
It seems to me that you have oversimplified Shindell's position. Can you offer a citation to your claim that Shindell has not consided the forcings correctly? I do not see a reply to Shindells claims in your claims. Can you refer to Shindell's position above to support your claim that he is "simply wrong"? It appears to me that Dessler agrees with Shindell. Claiming that they are both wrong without strong references is a pretty strong claim.
-
Rob Honeycutt at 00:57 AM on 14 May 201497% - A Statistically Representative Debate On Global Warming
What's not often noted is that "the three" rarely even agree with each other.
-
JoeK at 00:36 AM on 14 May 2014Sense and climate sensitivity – more evidence we're in for a hot future
Tom @15,
With regard to your point about relying on Kummer and Dessler I think you somewhat miss the significance of their paper. If it were just one more estimate of climate sensitivity it would not be such a big deal. Importantly, they claim that their estimate is conditional on an estimate for efficacy (which may be a bigger source of uncertainty than points so far raised here).
To me the significance of Kummer and Dessler is to take Shindell's estimate of aerosol efficacy and ask what implications it would have for climate sensitvity? The important point is setting some scale to the relation between efficacy and sensitivity. If, for example, they had found that you need efficacies in the range of 2-3 before a big effect on sensitivity shows up then Shindell would have an interesting observation, but of limited relevance to the question of climate sensitivity. As it happens they find a problem in the other direction, that in their simple model Shindell's central estimate produces a rather high sensitivity to be realistic.
I think Kummer and Dessler's concluding paragraph highlights this.
Thus, an efficacy for aerosols and ozone of ≈1.33 would resolve the fundamental disagreement between estimates of climate sensitivity based on the 20th-century observational record and those based on climate models, the paleoclimate record, and interannual variations. It would also mean that the 20th-century observational record strongly supports the IPCC’s canonical range.
(my emphasis)
Their final sentence is also appropriate. They do not end by concluding they have a better estimate of sensitivity, but rather that
Clearly, better quantification of the forcing efficacy should be a high priority.
Maybe a chart of modal estimated ECS vs. efficacy, and the slope of that dependence would be of interest? While you may be able to eyeball an estimate of the effect of the error on a point estimate of ECS, can you do the same for the ECS vs. efficacy curve?
As for a correction, it seems to me that this should not be such a big deal. We are in the 21st century now, with electronic publishing. If there's a simple error it should be noted for future readers who may come to the document (possibly in future years) without having to search the internet or blogs for errata to every paper. The fact that by co-incidence the numerical result may happen to be close to correct doesn't seem an important consideration. Developing methods correctly is what will allow this work to be built on in the long term.
-
Tom Curtis at 23:30 PM on 13 May 2014Sense and climate sensitivity – more evidence we're in for a hot future
JoeK @13, your itemized points fairly represent my claims. With regard to your points in response, I largely agree with your first point. With regard to the second point, first, while the error regarding the forcing baseline is a problem it is almost certainly less of a problem than those that have afflicted other similar attempts using this method, including those by Nic Lewis. In particular, the use of integrated values to estimate climate sensitivity is a clear improvement in method over anything before. Further, no prior attempt using the general method has adequately determined the initial energy imbalance, and have generally used energy imbalances which on the face of it are the wrong sign. If we are to disregard Kummer and Dessler's result, therefore, we should disregard also all results from equivalent methods. Alternatively and more sensibly we should recognize it as one attempt to measure climate sensitivity among many and not assume that either it or its predecessors provide a perfectly accurate assessment.
With regard to errata, it is not yet clear that this is a significant error. It may be that the result is accurate or nearly so despite the mistatement about forcings, in which case an erratum or corrigendum need not be warranted. It may be appropriate to merely acknowledge the error in blogs or by some other means. Of course, if the error does significantly alter the estimate of climate sensitivity, then a corrigendum should be issued.
-
DSL at 23:26 PM on 13 May 20142014 SkS Weekly Digest #19
GISS L-OTI is out for April: 0.73C. That's the warmest April on record, and with a mere .152 for March-April MEI.
-
John Hartz at 22:34 PM on 13 May 201497% - A Statistically Representative Debate On Global Warming
I'll bet you a dollar to a donut that Oliver's skit does not tickle the funny bones of Richard Tol and the Tolettes.
Ditto for all of the other inhabitants of Deniersville.
-
chriskoz at 22:31 PM on 13 May 201497% - A Statistically Representative Debate On Global Warming
The comedy is great but seriously - a bit exaggerated. Those three "deniers" or "skeptics" should also be dressed in white aprons and waving their notepads. They are also reputable (or were reputable until their research led them astray) climate scientists. They are not heckled as on this video. Quite opposite: someone finds time (usually those whose research is contradicted) to take "skeptic" arguments seriously and rebut in peer reviewed journals. The rest of the crowd are just ignoring them: no time to waste arguing that the Earth is flat. That's the tue picture (somewhat unatractive) of "A Statistically Representative Debate".
-
chriskoz at 22:06 PM on 13 May 2014Sense and climate sensitivity – more evidence we're in for a hot future
I don't like the F scale presented in the video (evidently targetted at US audience), because the video does very poor job translating from/to C scale. It portrays ESC from models of efficacy 1 as 4F, wrongly equaling it to 2degC, where in fact it equals 2.2degC (according to the formula: dF/dC = 9/5). Then, the efficacy 1.33 yields 6F, which is again wrongly equaled to 3degC, when in fact it is 3.3degC. My nitpick is justified here, because in this range of ECS numbers, the inaccuaracies in the video make a difference.
Best of all (in the interest of KISS paradigm that I advocate everywhere) the US audience should learn that in climate science the golden rule is to measure temp in degC (or K) only and forget about F that confuse the picture. It's not hard to accept degC because the temps we are talking about (global averages) are somewhat abstract entities, different to those we are feeling and seing on TV forecasts. It seems that those who accept the science have no problem accepting different scale. So, accordingly, let's bring the numbers from the acual abstract (forgetting the last one minute of the video):
Unified efficacy of 1 gives ECS of 2.3 K (5%-95%-confidence range of 1.6-4.1 K), near the bottom of the IPCC's likely range of 1.5-4.5 K. Increasing the aerosol and ozone efficacy to 1.33 increases the ECS to 3.0 K (1.9-6.8 K)
-
JoeK at 22:06 PM on 13 May 2014Sense and climate sensitivity – more evidence we're in for a hot future
Tom Curtis @7,
Thanks for the explanation.
If I understand you correctly you are suggesting that:
1) Nic Lewis correctly found an error in Kummer and Dessler, namely that treat their forcing as referenced to 1880-1900.
2) Lewis may well have the arithmetic correct when he says that simply subtracting the 1880-1900 average from the forcing series would result in a significantly lower estimate of climate sensitivity.
3) However, because of the large volcanic forcing in the period 1880-1900 this is misleading and it would be better to use a more 'normal' period, where the forcing is closer to the pre-industrial 'average'.
4) Unfortunately, data for average surface temperatures become far less accurate going back before 1880, so the simple fix of plugging in the average surface temperature in 1750 is not available.
5) Tom Curtis suggests that if such a procedure could be carried out (i.e. we had good surface temeprature for 1750) then the result would be closer to Kummer and Dessler's 'incorrect' published result than to Lewis' 'corrected' result (by luck for Kummer and Dessler).
6) Eyeballing graphs, Tom Curtis suggests 'the error may be in favour of a lower climate sensitivity, although it is more likely a small error in favour of a higher climate sensitivity.'
7) Finally, Tom Curtis suggests 'there are better ways around this problem'.
If the above are correct I would draw the conclusions:
1) The method of Kummer and Dessler is promising. It is worth developing and implementing ways around the problem. Perhaps this involves taking an average over a longer period, such as 1850-1900. On the other hand there are problems with this, too. 1800-1850 looks like the forcing would be even more negative. The result should not depend on the arbitrary period chosen. I can think of other approaches but they may be more complicated, e.g. depend on GCMs, which has other drawbacks.
2) The results of Kummer and Dessler should not be quantitatively relied on. A correction should be issued addressing these issues.
-
chriskoz at 20:54 PM on 13 May 2014Sense and climate sensitivity – more evidence we're in for a hot future
Dean@6,
Climate models do take into account that part of carbon cycle feedback that is understood as much that it can be quantified. Specifically, the process of CO2 equilibration between atmosphere and oceans is understood quite well and the rate quantified. CO2 uptake by biosphere due to the fertilasation effect is less known but still quantified from the observations of CO2 mass balance between emissions and Keeling curve sine 1958.
The rate of last of the feedbacks you mentioned: melting permafrost, is poorly understood and not quantified. Therefore it is omitted from the models.
-
Brian Purdue at 15:02 PM on 13 May 201497% - A Statistically Representative Debate On Global Warming
Comedy is a great messenger – well done indeed John Oliver.
-
Tom Curtis at 14:41 PM on 13 May 2014Sense and climate sensitivity – more evidence we're in for a hot future
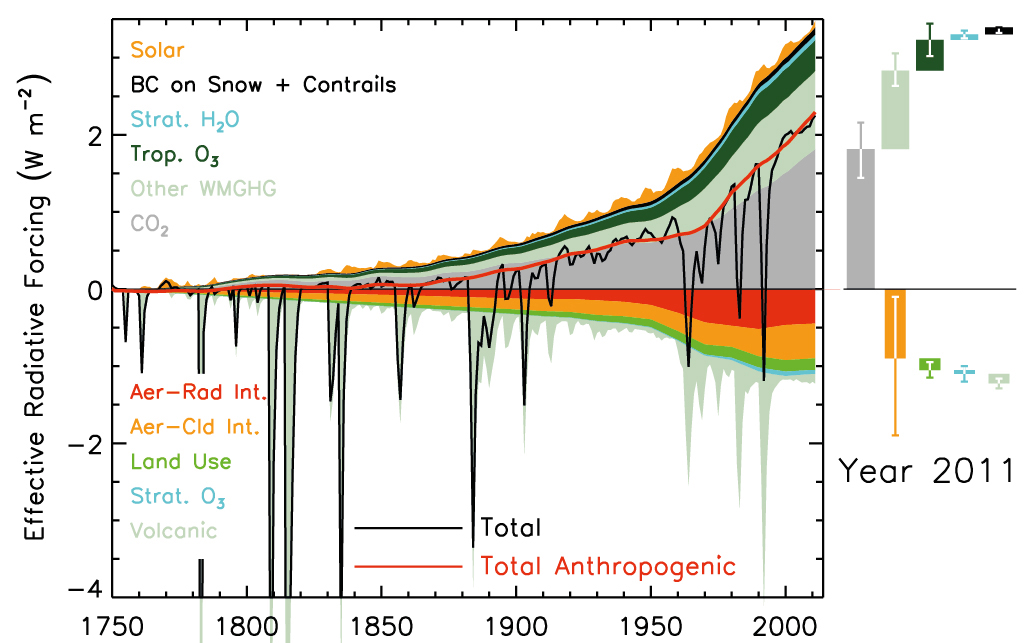
BC, I don't see how that implication follows from the OP. If you look at the first image in my post @7, you will sea the aerosol forcing has the largest error range. Indeed, from table 8.6 we find that while the mean estimate of aerosol radiation interactions has declined from -0.5 to -0.35 W/m^2 from AR4 toAR5, the uncertainty has risen from a 0.8 W/m^2 ranged (-0.1 to -0.9) to a 1.0 W/m^2 range (0.15 to -0.85) so that overall uncertainty is greater.
The key point on which the OP is based is not the uncertainty of the aerosol forcing, but the fact that the aersol forcing is regionally localized, specificly around areas of significant industrialization (Europe, North Eastern US, China). That, combined with the fact that the NH responds more rapidly to forcings simply by virtue of its large land mass (and consequently less thermal inertia provided by the large oceans of the SH) implies that there will be a larger response to a given aerosol forcing than to an equal GHG forcing, given that GHG forcings are globally homogenous.
-
Tom Curtis at 14:25 PM on 13 May 2014Sense and climate sensitivity – more evidence we're in for a hot future
The following comment was made by BC, and accidentally deleted:
"James Hansen made much in his book 'Storms of My Grandchildren' about our lack of understanding of the forcings caused by aerosols due to a lack of funding for a satellite to measure their impact. And when Glory was eventually sent up there was a launch failure. This posting seems to imply that we don't have a problem with estimating aerosol forcings any more?"
Sorry for any inconvenience.
-
One Planet Only Forever at 13:59 PM on 13 May 2014Sense and climate sensitivity – more evidence we're in for a hot future
I meant to end my previous comment with the importance of remaining focused on the scientific best understanding of the temperature increase that should be a concern (1.5 C), especially when referring to the potentially ever increasing "political popularity target".
As global leaders reset their "targets" out of "pragmatic expediency" balancing popular support for unacceptable actions against common well understood decency, there needs to be constant reminders of how much further they are from acceptable impacts of one group of people, the most fortunate at a point in time, on all others, especially on future generations (no group should be able to excuse getting benefit from the creation of negative consequences for others).
Even the IPCC reports regarding mitigation make the fatally flawed claim that discounting future costs is a legitimate methodolgy for evaluating acceptability of a lack of concern about future impacts that another group of people will face. That is deemed excusable because, of course, the economy will always grow, in spite of the fact that the only rational way for the economy to sustainably grow is for that growth to exclusively be in activities that are sustainable and not damaging to the future, meaning any perceived beneficial economic growth through increased burning of fossil fuels is a lie deliberately created by uncaring people.
-
One Planet Only Forever at 11:08 AM on 13 May 2014Sense and climate sensitivity – more evidence we're in for a hot future
It is important to remember that a 1.5 degree C rise of global average above the pre-industrial level is still the threshhold of concern regarding signficant difficult to predict and difficult to adapt to climate change consequences.
The change to a 2 degree target occurred in the 2009 Copenhagen meetings. That was when it was admitted that the 1.5 degree target was no longer achievable because of the lack of reduction of pursuit of benefit from burning fossil fuels, primarily by the most fortunate who refused to participate in leading toward a sustainable better future for humanity (less reliant on the ultimately unsustainable burning of fossil fuels).
The continued deliberate lack of concern by many of the most fortunate for anything other than their personal potential benefit, including their deliberate desire and efforts to discredit the best understanding of what is going on, is likely to make 2.5 degrees the target discussed in 2015, then 3.5 in 2020, then 4.5 if anyone even bothers to care after that.
-
Tom Curtis at 10:39 AM on 13 May 2014Sense and climate sensitivity – more evidence we're in for a hot future
JoeK @2 and @5:
First, Kummer and Shindler are simply wrong in saying the forcing data is referenced to the late 19th century.
Second, here is the forcing data over time from AR5 (Fig 8.18):
And here is the temperature data over time, also from AR5 (Fig 2.14):

It is very clear that there is a large negative forcing over the period 1880-1900, primarily due to volcanoes, and in particular the Krakatoa erruption of 1883. It is also clear that the associated temperature excursion is nowhere near as large in relative terms. That is because of the thermal inertia of the oceans, which prevents temperatures from fully following large but short term forcing excursions.
One immediate consequence of that difference is that the energy imbalance at the TOA durring the period of 1880-1900 was reversed in sign relative to the average over the twentieth century. To estimate climate sensitivity starting from the base period of 1880-1900 you need a reasonably accurate estimate of that energy imbalance, which we do not have. To estimate it from the forcing and temperature data, you would need to know the climate sensitivity, which is what you are trying to estimate in the first place.
Rather than do that, you could take a simple fudge factor that approximates to a 0 W/m^2 forcing at the time by reducing the forcing excursion to match qualitatively the temperature excursion. It is very clear that such a fudge factor would reduce the forcing estimate below the underlying trend estimate, but that it would be far closer to zero than the simple average of the forcing as used by Nic Lewis.
I think there are better ways around this problem, but Kummer and Dessler's "solution", however accidental, is plainly superior to Lewis's solution. I doubt it is 100% accurate but the error may be in favour of a lower climate sensitivity, although it is more likely a small error in favour of a higher climate sensitivity.
-
Dean at 09:28 AM on 13 May 2014Sense and climate sensitivity – more evidence we're in for a hot future
Nice article, though I miss some analysis of the carbon cycle feedback and how much of an effect this will have. You recently wrote about the vegetational response. But there is also the transient uptake by the ocean and of course the melting permafrost issues.
"...that gives us a best estimate of about 5°C warming above pre-industrial temperatures by 2100..." Does this take into account carbon cycle feedback or does it implicitely assume it is zero?
-
StElias at 08:29 AM on 13 May 2014Antarctica is gaining ice
"Two papers scheduled for publication this week, in the journals Science and Geophysical Research Letters, attempt to make sense of an accelerated flow of glaciers seen in parts of West Antarctica in recent decades."
"The collapse of large parts of the ice sheet in West Antarctica appears to have begun and is almost certainly unstoppable, with global warming accelerating the pace of the disintegration, two groups of scientists reported Monday."
"The new finding appears to be the fulfillment of a prediction made in 1978 by an eminent glaciologist, John H. Mercer of the Ohio State University. He outlined the uniquely vulnerable nature of the West Antarctic ice sheet and warned that the rapid human release of greenhouse gases posed “a threat of disaster.” He was assailed at the time, but in recent years scientists have been watching with growing concern as events have unfolded in much the way Dr. Mercer predicted. (He died in 1987.)"
Moderator Response:Fixed link
-
JoeK at 07:52 AM on 13 May 2014Sense and climate sensitivity – more evidence we're in for a hot future
Really, I don't want to fill up this thread with irrelevancies, and the moderators should feel free to remove this comment if it's just a distraction, but I don't find michael sweet and ubrew12's responses very helpful.
michael sweet refers me to Drew Shindell's Realclimate post, which I was already familiar with. He states
it seems to me that if Lewis has a real point he would be more effective taking it to Real Climate where people are qualified to review it.
The Shindell paper is not the same as the Kummer and Dessler paper. The Realclimate thread addresses the Shindell paper. This thread is about the Kummer and Dessler paper.
Leaving aside advice for Lewis, what should I do if I want to find an answer? Is sweet saying that Skeptical Science is not an appropriate venue for this question (and that Realclimate is)? It seemed to me that it would be somewhat more appropriate for Skeptical Science but if others agree not then I will take it elsewhere.
sweet continues
Most of the comments at Bishop Hill were of the "Dessler used a model so it must be wrong" type. The OP at Bishop Hill disparages Dressler's paper based on a review of the abstract. It has no substantiative analysis or data.
which may be true, but it doesn't help me. In fact, that was one reason I didn't persist in trying to get an answer there and came over here.
ubrew12 also refers me to Shindell's post, pointing out that one can use either a 1750 or an 1880 reference, which may be true. But Nic Lewis is claiming that Kummer and Dessler mixed two legimate options in an illegitimate way - using one reference for temperature and another for forcing. An initial check showed a prima facie contradiction in Kummer and Dessler. I thought someone here may be able to offer a quick clarification.
Prev 718 719 720 721 722 723 724 725 726 727 728 729 730 731 732 733 Next


