


 Arguments


Recent Comments
Prev 724 725 726 727 728 729 730 731 732 733 734 735 736 737 738 739 Next
Comments 36551 to 36600:
-
John Hartz at 01:44 AM on 31 July 2014State Department cuts through the acid political environment on oceans and climate
Ocean acidification imperils Alaska’s fishing-dependent economy, says a new study funded by the National Oceanic and Atmospheric Administration.
For details, see:
Southeast, southwest Alaska communities at highest risk from ocean acidification, study says by Yereth Rosen, Alaskan Disptach News, July 29, 2014
-
KR at 01:42 AM on 31 July 2014State Department cuts through the acid political environment on oceans and climate
Russ R. - Regarding past episodes of acidification, Hönisch et al 2012, The Geological Record of Ocean Acidification, is a recent and relevant paper. They examine among other data boron isotope composition for pH, calcium-to-trace element ratios for ambient CO2, and alkenone carbon isotope composition for aqueous CO2.
In table S1 of the paper (supplemental data) they compare these past episodes to the present, and find the only really comparable episode is the Paleocene–Eocene Thermal Maximum (PETM). The PETM notably had a mass extinction of shell-forming foraminifera. This recent work with direct proxies for pH and CO2 changes agrees with previous research on the PETM and its similarities to the present.
Regarding your "hard to believe" question (Argument from Incredulity?) on pH swings, seasonal variations are short term and can be managed by many organisms, while longer term average pH changes induce energy costs (energy of fixation in shells) and the lifespan availability of aragonite and calcite needed to build shells. And yes, there are nonlinear thresholds (Ries et al 2010) for many organisms.
Finally, the correct and proper chemical terminology for lowering pH is indeed "acidification" - semantic arguments in that regard don't affect changing H3O+ concentrations, and are irrelevant red herrings. If you start at the South Pole and travel a few hundred km in any direction, you are moving north (northification?) despite still being in the Southern Hemisphere, and the weather will be correspondingly different there.
-
Tom Dayton at 01:28 AM on 31 July 2014State Department cuts through the acid political environment on oceans and climate
Russ R., regarding your question #3: No, "acidification" is not misleading. It was a common term long before the human cause of ocean acidification was a hot topic. Saying "it is acidifying" instead of saying "it is becoming less alkaline" is no more misleading than saying "it is warming" instead of "it is becoming less cold."
Also, please do follow Dikran's advice about the background reading.
-
Russ R. at 00:40 AM on 31 July 2014State Department cuts through the acid political environment on oceans and climate
Good responses all. Highly informative.
Three followup questions, two scientific and one semantic.
- The argument that "the rate of change is higher today than in the past" rests on an unstated premise that the rate of change in the past was actually low. What proxies (of atmospheric CO2, seawater pH, or carbonate ion concentrations) have resolution to decades and can show that the rate of change in the geological past was consistently low?
- The man-made rate of change in average pH today (around -0.19 pH units per century)
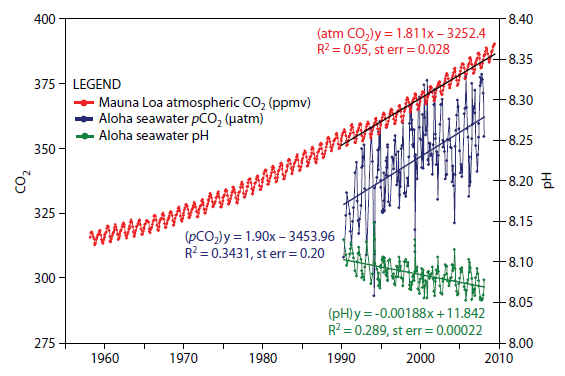 is miniscule compared to the range of natural variability of pH (often more than 0.3 ph units in a month) http://sanctuarymonitoring.org/regional_docs/monitoring_projects/100240_167.pdf I find it hard to believe that marine species which have adapted to deal with such a large pH variations from month to month and from year to year somehow can't deal with a much smaller shift over a century. Is there some sort of non-linearity or threshold level that comes into effect?
 - Since the ocean pH at >8 isn't in the "acidic" range of the scale, and since pH isn't even the primary issue here, isn't the term "Ocean Acidification" more than a bit misleading?
-
Klaus Flemløse at 20:14 PM on 30 July 2014Southern sea ice is increasing
Southern Ocean: Sea Ice Concentration and Sea Surface Temperature
Recently there has been a discussion about the link between SST and SIC in the Southern Ocean around Antarctica. It is claimed that there has been a drop in temperature in the Southern Ocean with a consequent increase in ice concentration. This is contrary to what you can read on the SKS. However, there are conflicting data.If you use data from GISS, HADLEY or Berkeley, it seems that SST is growing in the Southern Ocean. If you are use data from NOAA you arrive at the opposite conclusion, namely that the SST is decreasing.
So there is a reconciliation issue between the different data sources. At present I have not found any discussions that shed light on the causes of this. NOAA, however, stresses a possible cause:
“The optimum interpolation (OI) sea surface temperature (SST) analysis is produced weekly on a one-degree grid. The analysis uses in situ and satellite SST's plus SST's simulated by sea-ice cover. Before the analysis is computed, the satellite data is adjusted for biases using the method of Reynolds (1988) and Reynolds and Marsico (1993).”
This means that you start with ice cover and then you simulate the SST and let this go into calculating the SST. In this way there will be a strong correlation between SST and SIC.
The following graph shows the development of SST around Antarctica (60S-90S) using data from NOAA monthy sst and sic

There is at strong correlation beween SST and SIC

My questions are:
Is the NOAA data a fact or an artifact?
Is this in general a story of bad data? -
Dikran Marsupial at 20:12 PM on 30 July 2014State Department cuts through the acid political environment on oceans and climate
Russ R, Doug Mackie wrote an excellent series of blog posts called OA is not OK that is well worth reading to understand the basics (there are 20 posts, which show there is quite a lot you need to know and "simple chemistry" isn't quite enough).
-
Tom Curtis at 17:05 PM on 30 July 2014Challenges in Constraining Climate Sensitivity: Should IPCC AR5’s Lower Bound Be Revised Upward?
Victor @5, I assume by "the computation", you are referring to that in Otto et al. In that case, their preferred value is that derived from the difference between the 1860-1879 to the 2000-2009 intervals. Using HadCRUT4 the trend over 2000-2009 is 0.087 C/decade. The interval is bracketed by the end of the 1999/2000 La nina at the start, and the 2008 La nina, and is either ENSO neutral (NINO 3.4) or has a negative ENSO trend (SOI). For comparison, the BEST trend is 0.116 C/decade over the same interval.
Recalculating the climate sensitivity (ECR) and transient climate response (TCR) using BEST data rather than HadCRUT4, but otherwise using Otto et al's data and methods, I find the following temperature differentials for the various periods used by Otto et al:
Interval_____|__HadCRU__|__BEST
1970-79___|__0.22_____|__0.27
1980-89___|__0.39_____|__0.44
1990-99___|__0.57_____|__0.60
2000-09___|__0.75_____|__0.81
1970-2009_|__0.48____|__0.53
That in turns results in the following ECS and TCR estimates, for HadCRUT4:
Interval____|__ECS__|__TCR
1970-79___|__1.40_|__1.01
1980-89___|__1.86_|__1.38
1990-99___|__1.92_|__1.62
2000-09___|__1.98_|__1.32
1970-2009_|__1.92_|__1.36And for BEST:
Interval____|__ECS__|__TCR
1970-79___|__1.70_|__1.23
1980-89___|__2.10_|__1.56
1990-99___|__2.04_|__1.72
2000-09___|__2.13_|__1.42
1970-2009_|__2.12_|__1.51From these figures I would find it difficult to argue the slight plateau in temperature increase. One obvious factor is that the difference in ECS or TCR calculated for different periods is entirely a function of differences in temperature. That temperature differential was greatest in the 2000s. Had the temperature differential in the 2000s been at the average value, the ECS calculated would have been 1.2% higher, a difference reasonably attributed to the "hiatus". Further, the RCP 4.5 forcings from CMIP 5 used in the method over estimate forcings in the last 2-4 years of the 2000s, so that there use would underestimate climate sensitivity. This is an indirect consequence of the "hiatus" in that lowered temperaures in those years are partly a consequence of the reduced forcings.
All in all, the temperature difference due to the hiatus may account for a 2% understatement of ECS, suggesting your insight was more perceptive than I allowed.
-
Andy Skuce at 11:42 AM on 30 July 2014State Department cuts through the acid political environment on oceans and climate
The science is not yet definitive, but there have been some big die-offs of scallops and oysters offshore British Columbia, warming and acidifying waters appear to be prime suspects.
Mystery surrounds massive die-off of oysters and scallops off B.C. coast
-
One Planet Only Forever at 11:33 AM on 30 July 2014Rupert Murdoch doesn't understand climate change basics, and that's a problem
Donny, My apologies for the lack of thought flow in the opening of my comment. It should have been:
"Please elaborate on what you consider to be the uncertain or doubtful aspects of the rather thoroughly researched and presented information about the accumulation ..."
I am genuinely interested in any new information or thoughts you can share.
-
Tom Curtis at 08:21 AM on 30 July 2014State Department cuts through the acid political environment on oceans and climate
Further to my post @3, here are pictures of reef growth near a volcanic vent in New Guinea, along with a map of local ocean pH:
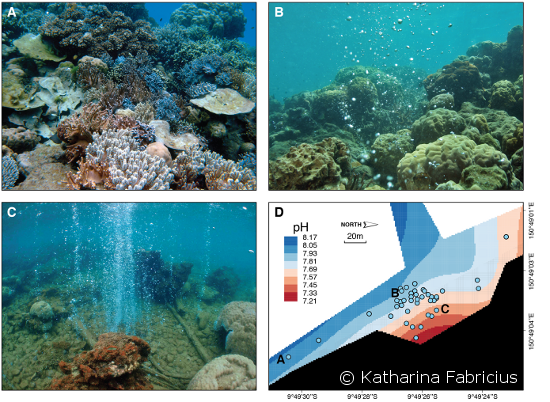
(Source)
Frame B corresponds to the ocean pH projected by the end of this century with BAU.
The volcanic vents have existed long enough that any preexisting adaptive mechanism would have been able to kick in. Never-the-less, there is a substantial reduction in coral diversity with low pH, and an almost complete absence of branching corals. The idea that vulnerable organisms will simply adapt to low pH is already refuted in reality by their failure to do so in situations of already existing low pH.
-
Tom Curtis at 08:09 AM on 30 July 2014State Department cuts through the acid political environment on oceans and climate
Russ R @1:
1) When CO2 is dissolved in sea water, its tendency to acidify the water is buffered by other chemical compounds, including Aragonite (CaCO3). Those compounds are replenished by weathering, which increases with increased temperature. For most periods in the past the two are balanced.
If you have a very rapid increase in CO2, the buffering agents will be exhausted allowing a far greater drop in ocean pH (ocean acidification). An equivalent increase over a long period will allow an increase in weathering that limits the fall in pH. Therefore ocean pH in times of high CO2 concentrations in the past will have been much higher than they will be if we achieve the same levels over the next century.
Further, with slow increase of atmospheric CO2, there is a build up of aragonite. That is, while ocean pH is lower, aragonite concentrations are also higher which makes shell building easier at a given pH level. In constrast, with a very rapid rise in CO2 concentration, both pH and aragonite concentrations fall, with both effects making shell building harder.
2) The organisms and species alive today are not the same as their ancestors in the distant past. They have evolved for different conditions, including for higher ocean pH. Potentially, given sufficient energy, mechanisms existed to build shells in the past with lower pH, but those mechanism would have been energetically expensive, and cannot be presumed to have been preserved in situations with high pH.
Assuming that because ancesttors of modern species were capable of forming shells survived with low pH in the past, their descendants can do so today is like assuming that because humans are descedant from brachiating apes, we can swing through the trees in a jungle as rapidly as a chimpanzee or orangoutang. It simply does not follow.
Potentially, the ability to construct shells with low pH could evolve again. Evolution, however, is a process that occures over tens of thousands of years - far to slow to help species at risk over the next couple of centuries.
-
scaddenp at 07:49 AM on 30 July 2014State Department cuts through the acid political environment on oceans and climate
Sure and freshwater molluscs can survive with pH as low as 5. However, the problem is the rate of change. OA requires higher energy levels from organisms to do calcification and that requires adaptions. When OA is happening 100x faster than it has for millions of years, then you have a problem. Previous rapid changes in OA (ie the PETM) nearly wiped out corals.
Like just about everything with climate change, if it happens slowly then it doesnt cause a problem. It is the rate of change, especially compared to rate at which adaption can occur, that it is the issue.
-
Russ R. at 07:16 AM on 30 July 2014State Department cuts through the acid political environment on oceans and climate
I have a problem with the theory that molluscs and corals are suddenly at risk from ocean acidification due to CO2 at 400ppm (though I don't doubt that they are threatened by many other man-made risks).
These two life-forms evolved over the last half billion and quarter billion years respectively.
- http://en.wikipedia.org/wiki/Mollusca#Evolution
- http://en.wikipedia.org/wiki/Coral#Evolutionary_history
Over almost all of that time period, atmospheric CO2 levels were much, much higher than they are today.
"Simple chemistry" would imply lower pH levels in the geologic past, far below what we're likely to cause with CO2 emissions. And yet, molluscs and corals survived and are still with us.
I can't explain it.
Moderator Response:(Rob P) Actually the basics are rather straightforward. As far as many marine calcifiers are concerned, it is calcium carbonate saturation state that poses the strongest control on shell building - not the excess hydronium ions (low pH). Carbonate ions are one of the building blocks of calcium carbonate shells/skeletons, and one of the chemical reactions that takes place when CO2 dissolves into seawater is the lowering the carbonate ion concentration (technically activity).
Change in atmospheric carbon dioxide on geological time scales allows enhanced chemical weathering of rock to supply carbonate and bicarbonate ions back to the ocean. Furthermore, the total dissolved inorganic carbon (DIC) in the ocean undergoes a large increase due to the increased weathering that accompanies the ramped-up hydrological cycle (lots more rain dissolving lots more minerals into the ocean).
The net effect is an ocean very hospitable to calcification despite the low pH. The Cretaceous Period (the 'K' symbol in your graphic) is a classic example. Cretaceous is derived from the Latin word for chalk, as in the huge chalk deposits that formed during that time. These chalks deposits, such as the White Cliffs of Dover, are of coccolith shells - tiny marine plankton that thrived in the Cretaceous. Ginormous shellfish, Rudists, were the dominant reef builders of that time too.
During times of geologically-rapid increases in CO2, such as now, the ocean carbonate system can't keep up and the oceans become corrosive. Carbon dioxide dissolves rapidly in the ocean, but there is an insufficient increase in the rate of chemical weathering because it takes millennia for the enhanced rainfall to flush sufficient carbonate & bicarbonate ions back into the oceans. The sum effect is that ocean pH and calcium carbonate saturation decline in tandem.
This is why ocean acidification (corrosive seawater) only develops with geologically-rapid increases in atmospheric CO2, but doesn't otherwise. I've simplified this a bit, e.g. leaving out dissolution of carbonates on the ocean floor during periods of lowered atmospheric CO2, but that's the general picture. SkS will have rebuttals to this common misconception in the near-future.
-
VictorVenema at 05:57 AM on 30 July 2014Challenges in Constraining Climate Sensitivity: Should IPCC AR5’s Lower Bound Be Revised Upward?
Tom, you are right, the computation uses the temperature difference and not the energy increase. Does it really just use the temperature difference at the end of the time series? A method that would use the full temperature signal might be less sensitive to natural variability.
-
MA Rodger at 03:12 AM on 30 July 2014Nigel Lawson suggests he's not a skeptic, proceeds to deny global warming
Ken in Oz @7.
If we shift from surface temperatures to Ocean Heat Content as the measure of global warming, we are still at odds with Lawson of Blaby. In his appearance on BBC Radio 4 back in February he contradicted Prof Brian Hoskins by insisting that any rise in OHC was but speculation.
Of course this wasn't the only point that his Lordship got wrong. And that was why in my own complaint to the BBC over his appearance I pointed out that almost everything he said was woefully wrong.
So if he is continually and systematically wrong with everything he says, that makes two reasons why Lawson would surely deny he is a denier.
-
One Planet Only Forever at 23:50 PM on 29 July 2014Rupert Murdoch doesn't understand climate change basics, and that's a problem
Donny@38,
Please elaborate on what aspects of the rather thoroughly researched and presented information about the accumulation of total heat content of the planet continuing to rise as the cooler than neutral Tropical Pacific ocean during the period since 1998 has led to more heat capture in the ocean depths, and that a lower global average surface temperature has also been produced by the 'temporary' cooling effect of that cooler Tropical Pacific surface. Note thta the swing of the average surface temperature of the Tropical Pacific from La NIna to El Nino is about 4 degrees C which clearly can have a significant effect on the temporary values of a global average (that global average has been increased by less than a degree so far).
It would also seem that the recent very high monthly global surface temperature averages could be correlated with the slight warming of the Tropical Pacific that has recently occured. Using the NASA GISTEMP data set, the global average of 12 months ending in March 2014 was a match for the highest that occured during the massive El NIno event of 1997/98. And the highest 12 month averages due to the 1997/98 event were in Aug and Sep of 1998, months after the end of the El Nino condition (As can be seen in the NOAA history of the ONI the 97/98 El Nino event ended when the April/May/June average surface temp of the Tropical Pacific droped to less than 0.5 degree C above the long trem average from its peak of 2.4 C above the that average). And the 12 month averages ending since March 2014 have been increasing. And the coming potential El Nino has barely reached a neutral El Nino/La Nina state.
I am also very interested in best understanding what is going on. And so far I find the explainations developed to date indicating the warming has not stopped, that the global average will continue to increase as CO2 increases, to be quite 'compelling'. But I am open to input that would help me even better understand things.
p.s. I am fairly certain that the most likely cause of reluctance to accept the unacceptability of human activity that produces excess CO2 is a desire to benefit from activity that would lead to excess CO2 being produced. That powerful desire can affect a person's 'scientific objectivity'.
-
scaddenp at 12:50 PM on 29 July 2014Nigel Lawson suggests he's not a skeptic, proceeds to deny global warming
Ken,"As an aside, how do models include oscillations like ENSO? Random but bounded by statistical likelihoods of strength, duration and change? "
ENSO is an emergent feature in the models. It may be more accurate to say the the models demostrate ENSO-like features. I understand that they still leave a lot to be desired. eg see here.
-
Tom Curtis at 12:34 PM on 29 July 2014Nigel Lawson suggests he's not a skeptic, proceeds to deny global warming
johnthepainter@6, the video I embedded is the current annual series from the BEST website. It's URL on Youtube is:
https://www.youtube.com/watch?v=ts0OVXLY5yE
It was published in February of this year, whereas the one you link to was published in July of last year. Therefore I must presume the video to which I linked to be the more accurate of the two.
As to matching the graph, the video shows the annual average surface temperatures. In the graph, that is shown by the thin black line, which indeed matches the video. You were probably looking at the 10 year moving average (in red).
The high temperatures in the 18th century are irrelevant. They are based on solely western europe and east coast of the US stations in the first case, and on western europe alone in the second. In the both cases they rely on approximately thirty thermometers, or which (in the first case) just three were in the US (see graphs below). They are strictly regional temperatures and provide almost zero information about actual global temperatures.
As I noted in my previous post, I do not think any global instrumental temperature series prior to 1880 is realiable enough to be scientifically usefull. They simply record too little of the lands surface temperature to be reliable.

-
Ken in Oz at 12:15 PM on 29 July 2014Nigel Lawson suggests he's not a skeptic, proceeds to deny global warming
Two communications problems -
Surface air temperatures as the measure of global warming. I think heat content is a more direct measure of actual change to the climate system, with a trend showing less variability. I'm interested to know how much variability within heat content estimates and what physical processes drive it.
The broad misunderstandings tha projections/predictions based on an average of many models and model runs where reality will look like some of the model runs but will never look like that smoothed average. The expectation that failure of reality to follow that smooth average is portrayed as a failure of reality to follow prediction. I understand about short term variation vs longer term trend, but arguments such as Lawson use only work because it's not broadly understood.
I understand reality will look most like the model runs that put oscillations like ENSO in the right places but for most people, who get their information via media interpretations that may or may not include biases as well as simple failure of journalists to be well informed, the idea of "IPCC prediction" that has "failed" can look compelling. I like the analogy of the "prediction" of summer being warmer than winter based on an planetary tilt theory having a smooth transition, one day warmer than the one before, and a cool few weeks in spring 'proving' the prediction and theory is wrong... is clearly wrong - but analogy is less than best and only works in some contexts, such as a lecture without the media's requirements for brief (one or two lines) and clear and unambiguous content.
As an aside, how do models include oscillations like ENSO? Random but bounded by statistical likelihoods of strength, duration and change?
-
johnthepainter at 10:44 AM on 29 July 2014Nigel Lawson suggests he's not a skeptic, proceeds to deny global warming
Tom, the video shown doesn't match the BEST graph: some of the early temperatures in the video are higher than present-day ones, which is not true in the static graph. But they did another one covering the same period in which the modern ones are highest: https://www.youtube.com/watch?v=DHKGbxfiJ-k
I can't account for the difference.
-
scaddenp at 09:48 AM on 29 July 2014We're coming out of the Little Ice Age
Donny, estimates of forcings operating from AR4 below:
and for the current best estimates with error bars of forcing now, see:

Solar and volcanic are clearly natural but not long term players. Again, see the WG1 for estimates of forcings at play during LIA and for how the model perform.
-
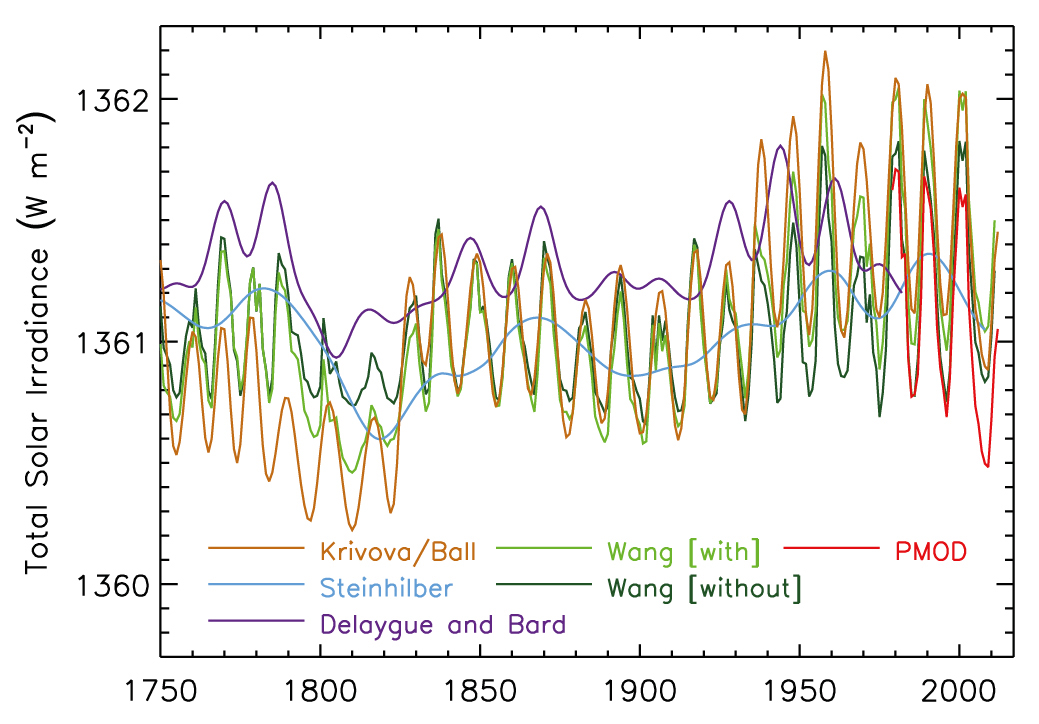
Tom Curtis at 09:47 AM on 29 July 2014We're coming out of the Little Ice Age
Donny @69, a forcing is the change in net energy flux at the top of the atmosphere. The Sun provides essentially all of the energy that warms the Earth, but is very constant. Over the solar cycle, it changes its output by only around 0.1%, so the change in forcing is small. Short term (decade to millenia) changes in solar output in addition to the solar cycle are not much larger. More importantly, the greatest solar output in this century was acheive around 1958, with a slight decline thereafter, becoming more rapid over the last decade. Therefore the change in solar ouput, ie, the solar forcing, since 1950 has been very close to zero, and perhaps slightly negative.
-
Tom Curtis at 09:39 AM on 29 July 2014Nigel Lawson suggests he's not a skeptic, proceeds to deny global warming
Roger D @4, the IPCC conclusion is that humans are responsible for 50% plus of global warming since 1950. In fact, they think that humans are responsible for around 100%, indeed, possibly more than 100% of warming since 1950 as shown in this IPCC figure, but allow with very low probability that it could be as low as 50% due to uncertainty:

ANT is anthropological, OA is Other Anthropological, ie, anthropological other than greenhouse gases, and NAT is Natural.
From a survey of climate scientists, it has been determined that the mean estimate of anthropological contribution since 1850 is 80%, with most of that coming since 1950. Prior to 1940, natural contributions dominate but anthropogenic factors still make a substantial contribution. Further, from 1850 to 1910, natural factors overwhelmed the then relatively weak anthropogenic forcing to cause a net cooling.
-
Donny at 09:39 AM on 29 July 2014We're coming out of the Little Ice Age
How can you say there are no solar forcings today?
-
Donny at 09:37 AM on 29 July 2014We're coming out of the Little Ice Age
Scaddenp. ...
Are you suggesting that there are no natural forcings now?
-
Roger D at 08:20 AM on 29 July 2014Nigel Lawson suggests he's not a skeptic, proceeds to deny global warming
Donny - others with more detailed knowledge can add to my 'answer', but i believe the IPCC has done your "survey" already by literature review and determined that responses from experts attribute from more than half to more than 100% of the observed global average temperature increas to anthropogenic sources. Also, I suspect there are better ways to look at the problem than simply projecting a post LIA temperature trend into the 1900's and assuming the difference between that and observed is anthropogneic, if such a projection even made sense.
-
scaddenp at 08:19 AM on 29 July 2014Nigel Lawson suggests he's not a skeptic, proceeds to deny global warming
Donny, I have replied to you here which is the appropriate thread. Please also read the main article. You can use the Search function on top left page to find appropriate places for comments.
-
scaddenp at 08:17 AM on 29 July 2014We're coming out of the Little Ice Age
Replying to comment from here.
Donny, first point of call for any question like this has to be IPCC WG1. You want the chapter of paleoclimate, and eg Fig 5.7.
Do you accept the physics law of conservation of energy? Assuming you do, then warming of the surface is a change in the energy flow. Apart from ocean-atmosphere heat exchanges, then warming or cooling are due to changes in forcings. These can be natural or man-made. To accept the idea that "half the change" is natural, then you need evidence that there is a natural forcing, operating since LIA, of about the same magnitude as anthropogenic forcing. That evidence is tough to find.
Instead LIA (which is much more pronounced in NH) is adequately accounted for by changes in volcanic and solar forcings, certainly not operating today.
-
Tom Curtis at 08:10 AM on 29 July 2014Nigel Lawson suggests he's not a skeptic, proceeds to deny global warming
Donny @1, with several crucial caveatts, your answer is given by the BEST land temperature index:

The caveats are that prior to 1880, thermomeeter records are largely restricted to those from Europe, and from the East coast of North America. That makes the record a regional rather than a global record, which accounts for the very large fluctuations in the record prior to 1880, and hence for the short term rapid trends. For that reason, I agree with the many scientists who think the land temperature index is insufficiently reliable prior to1880 to be considered a true global index. The area of coverage by BEST is shown in this video:
-
Donny at 07:43 AM on 29 July 2014Nigel Lawson suggests he's not a skeptic, proceeds to deny global warming
Could someone tell me what the rate of warming was, over land, in (10 year? ??) increments starting with 1800? I assume the earth has been warming since the little ice age then began to warm faster as we began to dump c02 into the atmosphere. I am wondering how much faster it is warming now.... compared to how fast it was warming before the increased co2. It seems like it would be an easy survey to do with climatologists just asking them what percentage of the warming do they feel is man made. ... it seems to me if we are warming twice as fast as we were. .... then half is natural and half is man made.
-
scaddenp at 07:05 AM on 29 July 2014There is no consensus
Well the questions Physicsprof thought interesting would mostly be case of RTFM, so no surprize that not much discussion of them. LC&C are very familiar with the content of the IPCC WG1. What is more surprizing is why these questions were there at all. It does not seem reasonable to me that anyone in APS who is questioning the consensus on climate change would not have read the document.
-
Maggnum at 04:59 AM on 29 July 2014Climate models accurately predicted global warming when reflecting natural ocean cycles
@mammelE @58 - one of the best explanations I have ever read. Unless you strenuously object, I will use that on occasion.
-
Rob Honeycutt at 02:13 AM on 29 July 2014There is no consensus
From what I gathered from people who were at that workshop, the APS board had a clear understanding of the situation ahead of time. It sounded like this was more about giving certain "skeptics" a chance to vent ahead of updating the APS position statement.
I would guess the framing document was a way of pulling up questions that "skeptics" put forth, though knowing those questions have been already answered to full satisfaction by the IPCC.
I agree with Philippe. This doesn't strike me as a reasonable list of questions, except to those who don't have a full grasp of the scientific evidence on climate change. It's a list of talking points that have been addressed, repeatedly, in full.
-
WRyan at 00:35 AM on 29 July 20142014 SkS Weekly News Roundup #30B
Haha. Yeh, I was somewhat bemused by that part of the article. But I have some sympathy for Oreskes. She worked as a geologist in Australia before she became a science historian and I expect that was an overwhelmingly male-dominated field of work, probably with a very macho culture. That might have left her with a fairly unsympathetic view of people in the physical sciences.
Personally, I was once part of a postgraduate electrical engineering program where there were 73 postgraduate students with a grand total of two of them being women.
-
PhilippeChantreau at 00:25 AM on 29 July 2014There is no consensus
I guess one could stretch the argument that, if APS revises isstatement, the consensus amongst scientists (not clkimate scientists) could be weakened and perhaps that's why PhysicsProf brought it up here. I am still unimpressed by the contents of that "framing document." I disagree that it resembles scientists asking questions in a sincere effort to understand. The arguments in it are well examined in the IPCC report. All of them are the object of current research and an abundance of litterature exists on them. Quite frankly, it reads more like a gish gallop and does not carry the to me the impression of sincerity that PhysicsProf advertises. I do not find that expressing this constitutes condescension.
-
joeygoze9259 at 00:21 AM on 29 July 2014Is a Powerful El Niño Brewing in the Pacific Ocean?
I think it is a lesson here, now in July, how cautious one needs to be about predictions. Statements made in April indicating how data is "stongly hint[ing]" about the size of the future El Nino are appearing to be inaccurate. Now in July, with ONI reported by the NOAA at .2, strong El Nino looks to be off the table with an event more in line with 2004 or 2009 (years where ONI was .2 at this time and El Nino started in September).
Moderator Response:(Rob P) - See also El Niño in 2014: Still On the Way?. An event like 2009 would put El Niño (if it occurs that is) down as an extreme one. We'll have to wait and see.
The immense build-up of heat in the equatorial ocean, followed by a strong decline, is something not observed before. Uncharacteristic behaviour often leads to new insights into how something works.
-
Tom Curtis at 20:04 PM on 28 July 2014There is no consensus
PhysicsProf @628:
1)
"How are IPCC confidence levels determined?"
As with many of the questions in the framing document, this question merely demonstrates the authors of the questions simply could not be bothered doing their homework:
http://www.ipcc.ch/pdf/supporting-material/uncertainty-guidance-note.pdf
2)
"What caused the 5% increase in confidence from 2007 to 2013?"
There is a whole chapter of the latest IPCC report on this topic, which apparently the framers of the question could not bother to read. Here is the summary:
"Combination of Evidence
Human influence has been detected in the major assessed components of the climate system. Taken together, the combined evidence increases the level of confidence in the attribution of observed climate change, and reduces the uncertainties associated with assessment based on a single climate variable. From this combined evidence it is virtually certain that human influence has warmed the global climate system. Anthropogenic influence has been identified in changes in temperature near the surface of the Earth, in the atmosphere and in the oceans, as well as changes in the cryosphere, the water cycle and some extremes. There is strong evidence that excludes solar forcing, volcanoes and internal variability as the strongest drivers of warming since 1950. {10.9.2, Table 10.1}"If that is not clear enough, let me spell it out. The attribution is for anthropogenic warming since 1950, ie, 60 odd years ago. The most commonly cited frequency for major oceanic fluctations is 60 years. A 60 year cycle will not raise temperatures over a full cycle. Therefore oceanic fluctuations are eliminated as a significant factor. Net volcanic foring and solar forcing since 1950 have been negative, or nearly so. Therefore they are not the cause of recent trends. That leaves anthropogenic factors as the dominant (>50%) cause of the warming. That conclusion is further supported by fingerprint arguments, and more detailed attribution in a host of areas. The increase in confidence comes because, firstly, at time extends to 60 years the potential role of oceanic cycles minimizes; and as we continue through the very low activity of the current solar cycle, the potential that it was the Sun further minimizes.
3)
"There also was a discussion (p 11) of the uncertainty of ocean heat flux data being 10-20% (or 20 W/m2) versus the change in global heat flux due to AGW since 1900 being less that 2 W/m2 (a factor of 10 less)."
From the relevant chapter of the IPCC:
"3.4.2.3 Net Heat Flux and Ocean Heat Storage Constraints
The most reliable source of information for changes in the global mean net air–sea heat flux comes from the constraints provided by analyses of changes in ocean heat storage. The estimate of increase in global ocean heat content for 1971–2010 quantified in Box 3.1 corresponds to an increase in mean net heat flux from the atmosphere to the ocean of 0.55 W m–2. In contrast, closure of the global ocean mean net surface heat flux budget to within 20 W m–2 from observation based surface
flux data sets has still not been reliably achieved (e.g., Trenberth et al., 2009). The increase in mean net air–sea heat flux is thus small compared to the uncertainties of the global mean. Large and Yeager (2012) examined global ocean average net heat flux variability using the CORE data set over 1984–2006 and concluded that natural variability, rather than long-term climate change, dominates heat flux changes
over this relatively short, recent period. Since AR4, some studies have shown consistency in regional net heat flux variability at sub-basin scale since the 1980s, notably in the Tropical Indian Ocean (Yu et al., 2007) and North Pacific (Kawai et al., 2008). However, detection of a change in air–sea fluxes responsible for the long-term ocean warming remains beyond the ability of currently available surface flux data sets."First note that the increase in ocean heat content is tightly constrained. As it happens the total Earth surface change in heat content from 1971-2010 was to 274 [196-374] zetajoules. That equates to a forcing of 0.42 [0.3-0.54] W/m^2 averaged over that period. 93% of that warming was in the ocean. Over that period, solar forcing was net negative, volcanic forcing was net negative, and oceanic fluctuations cannot give the ocean heat, merely shift it around. That leads to the IPCC conclusion that it is "very likely" that anthropogenic factors have "made a substantial contribution to upper ocean warming" using a method independent of observation estimates of the value of individual fluxes.
However, the IPCC quote properly refuses to specify the contribution form the magnitude of any individual flux, or combination thereof because the evidence on individual fluxes is not exact enough. This, quite frankly is kindergarden stuff. If we have a pool being filled from three different sources, each of which varies substantially from minute to minute in its outflow, but the volume of water in the pool increases steadilly, we know the net flow into the pool is positive and the average flow per minute even though we may be completely in the dark as to which source provides the greatest contribution in any given minute.
4) As shown above, the questions raised by you echoing the framing document have been more than adequately answered by the IPCC already. It is sufficient response to all of them (and all the questions in the framing document I have read) to simply reply, read the IPCC report. Of course, the original framers of the questions obviously have read sufficient of the report to present facts out of context, and frame questions in such a way as to create maximum confusion, even though a simple reading of the report already answers all the questions.
I emphasise "original" because it is quite possible, indeed probable if they are competent, that the APS committee has just presented a document of denier talking points so that said deniers cannot reasonably complain their points have not been addressed.
PS: @623 you wrote ' "you're a denialist"--because Holocaust imagery is always in good taste" '. Everybody else will have noted that you are the only person invoking the Holocaust here. The will probably recognize that if you call Paul tall, that does not prevent you calling Mary tall as well, and that in no way implies they have the same gender. Likewise, if some people have called people who doubt the history of the Holocaust on unreasonable grounds "Holocaust deniers", that I call people who doubt AGW on unreasonable grounds "AGW deniers" in no way implies that the latter have offensive views on the Holocaust - only that they deny AGW on unreasonable grounds. My language is not limited by your determination to use the taking of offense as a rhetorical tactic.
PPS: This is all well of topic on this thread, and I expect any reply on any of these issues (or other questions) to be in an appropriat thread. Not doing so is a vioation of the comments policy and should result in your comment being summarilly deleted.
-
PhysicsProf at 15:04 PM on 28 July 2014There is no consensus
"How are IPCC confidence levels determined?"
"What caused the 5% increase in confidence from 2007 to 2013?"
How is the persistent factor of 3 uncertainty in climate sensitivity consistent with the IPCC confidence levels?
How long must stasis exist before a firm declaration of a problem with the models?
There also was a discussion (p 11) of the uncertainty of ocean heat flux data being 10-20% (or 20 W/m2) versus the change in global heat flux due to AGW since 1900 being less that 2 W/m2 (a factor of 10 less).
I guess these would be a starting point....
-
scaddenp at 14:22 PM on 28 July 2014There is no consensus
Well I havent read every line the workshop transcript but it certainly looked to me like the questions likely of interest to L,C&C were being addressed. Got an example of a particularly interesting question that you feel was not addressed?
-
PhysicsProf at 14:13 PM on 28 July 2014There is no consensus
Of course the framing document is not a position paper expressing skepticism on climate change. But they are serious questions that good scientists are asking. The IPCC report makes strong statements and the APS committee is inquiring into the basis of those statements. The 2007 APS statement on climate change is one of the pillars of the scientific consensus on climate change. That position is being reviewed by this committee. I think they are asking good questions. I would assume there are good answers and that is why I asked if they had been addressed. But so far I only hear defensive responses that don't address substance. If all you have is condescension, I am clearly in the wrong place for information.
-
Tom Curtis at 13:46 PM on 28 July 2014There is no consensus
KR @624:
"Why would you treat an unapproved draft as the opinion of the APS?"
Particularly as it is not a draft, but a "framing document" that may have deliberately set out to encapsulate "skeptical" arguments without either endorsing those arguments or even agreeing that they are sensible, but merely in order garner responces to what are considered to be contrary opinion.
-
KR at 13:31 PM on 28 July 2014There is no consensus
PhysicsProf - If and when the APS releases an updated statement, it might be worth commenting upon it to the APS. Right now, it's silly to claim that a draft in progress, particularly with biased committee membership, is the opinion of the society as a whole.
Why would you treat an unapproved draft as the opinion of the APS?
-
Tom Curtis at 13:09 PM on 28 July 20142014 SkS Weekly Digest #30
In the spirit of the Toon of the week, we have this gem from XKCD:
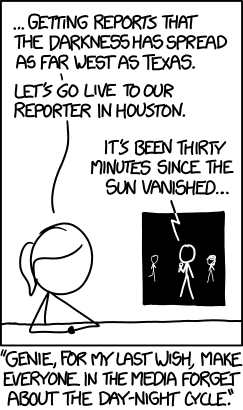
The first wish probably gave us AGW "skeptics" ....
-
PhysicsProf at 12:50 PM on 28 July 2014There is no consensus
So I gather the answer to my question is no, there hasn't been an article addressing the concerns raised by the American Physical Society. While Linzen, Curry and Christy were part of the actual workshop, my understanding was the framing document was from the APS without the input of the three. I did read the whole 573 pages of the workshop which was pretty fascinating but most of the questions in the framing document weren't directly addressed. What interests me is the current discussion feels like politicians slamming each other rather than scientists analyzing a problem ("this is all a hoax"--because scientists love secret meetings to fool the public; or "you're a denialist"--because Holocaust imagery is always in good taste). What I liked about the APS document was it asked serious questions a scientist rather than a politician would ask seeking to understand the basic science involved.
-
Tom Curtis at 12:40 PM on 28 July 2014Rupert Murdoch doesn't understand climate change basics, and that's a problem
Donny @38, read carefully the five "certainties" listed by Mancan. They are in fact sufficiently close to indisputable that calculating a probability of error for them is pointless. The only quibble on that point is that proposition (4) says that increasing CO2 "will warm the planet", but that is only true ceterus paribus. They also do not say very much about global warming as a problem for humans to sovlve. They jointly insist, for example that ceterus paribus, and with increasing CO2, temperatures will rise but do not quantify the increase from BAU by 2100. For all these certainties, that increase could be statistically indistinguishable from the preindustrial temperatures. They insist that warming will alter weather (better: climate), but no not indicate whether that alteration will be good, bad or neutral for humans, our society or the environment.
Unfortunately, if you cannot agree with these certainties, you are deeply in denial about climate science. Having agreed to them, however, implies nothing about future policy. Other, quite solid, but not so certain statements do imply a lot about policy. But if you cannot agree to even such basic propositions as the five given by Mancan, there is no hope in actually discussing the evidentiary merits of that science.
-
DSL at 12:28 PM on 28 July 2014Rupert Murdoch doesn't understand climate change basics, and that's a problem
Donny, you say this: "I am surprised to see a site with this kind of name be full of so many absolutely non scientific commentary and or mindsets."
And then you follow it with this:
"I am starting to doubt our understanding of how much c02 actually does effect temperature. I feel like the recent pause in warming doesn't sit right with my expectations"
This site is here just for you to work through your doubts and "feelings." So do it, and bring the evidence — on the appropriate threads, of course.
-
Donny at 11:05 AM on 28 July 2014Rupert Murdoch doesn't understand climate change basics, and that's a problem
Mancan. ...
Don't you think there may be some variables in all those "certainties" that you are listing? Maybe Murdoch thinks that the climate systems are extremely complex and to say that everything is decided in the CC debate may be a little premature.
I have a degree in environmental biology so I am by no means an expert in climate change. ... However I follow the debate closely and have enough science background to understand that the lack of having proper controls while experimenting in nature is a real problem. Thinking that you have a set of truths like your 5 can take away your scientific objectivity. I am surprised to see a site with this kind of name be full of so many absolutely non scientific commentary and or mindsets.
I am starting to doubt our understanding of how much c02 actually does effect temperature. I feel like the recent pause in warming doesn't sit right with my expectations. So I am looking back at what I assumed to be true and re questioning everything. .... and assuming nothing.
Moderator Response:[PS] This would be best discussed under a more focussed topic. eg here. " I feel like the recent pause in warming doesn't sit right with my expectations". Perhaps you havent read enough climate science to have very accurate expectation then? Try the appropriate sections of the IPCC WG1 report and bring questions to the appropriate topic.
-
Ken in Oz at 09:49 AM on 28 July 2014Climate data from air, land, sea and ice in 2013 reflect trends of a warming planet
I should say that I don't think the most serious impediments to action on climate are down to failure to communication of the science. My wish list on that front isn't going to turn the tables.
It may well be that more of the public demanding action is what overcomes the resisting inertia, but I think it's failures of politics, which sees people in positions of trust and responsibility putting their perceived role as advocates for agendas and interests that they support and that support them - their 'side' - ahead of their broader and longer term responsibilities that prevents such a public groundswell. As it prevents serious and effective policy action.
Rejection of mainstream science is given a stamp of respectability and authenticity when it comes from those with established power and influence - from those who are perceived to be essential to our own bit of economic security and prosperity. When the public is mislead and misinformed by those we should be able to trust that groundswell of public demand for appropriate action is inhibited. Better, more compelling communication that targets politicians and community leaders will lead to greater community acceptance of both the reality of the climate problem and of roads to solutions.
-
Paul R Price at 08:26 AM on 28 July 20142014 SkS Weekly News Roundup #30B
On the Oreskes and Conway Washington Post article.
O&C have done great service in their Merchants of Doubt research and many of the "14 concepts that will be obsolete after catastrophic climate change" hit the target but one sticks out like a sore thumb as being dead wrong. Apparently along with "Fugitive emissions" one of the great evils contributing to catastrophic climate change is "Physical scientists" (I kid you not) who are described as:
The practitioners in a network of scientific disciplines derived from the 18th-century natural philosophy movement. Overwhelmingly male, they emphasized study of the world’s physical constituents and processes — the elements and compounds; atomic, magnetic and gravitational forces; chemical reactions; flows of air and water — to the neglect of biological and social realms, and focused on reductionist methodologies that impeded understanding of the crucial interactions between the physical, biological and social realms.
This is laughably absurd, it's just nonsense. It does not take too much knowledge of climate literature, both science and policy, to realise that the problem lies with special interests and competitive national interests, all at the expense of long-term global well being (yet O&R obscured these under "Market failure"). It is certainly not the physical scientists that bear blame for doing their job. How can O&R get this so wrong?
O&R's dig smacks of the Pielke Jr [dis]Honest Broker schtick of blaming the scientists, its very disappointing coming from them as historians of science.
Among the academics my own reading of conferences, research and policy documents is that it is the social sciences especially those in policy and in economics who have failed far more than the physical and biological scientists. After all the latter groups report the observations and best explanations whereas resolving the problem is all about how humans respond, which is the area where social scientists are supposed to be expert. But no, blame the poor physical scientists, next O&R'll be saying it's a conspiracy.
And what is this 'overwhelmingly male' quip? There seem to be a great many excellent women climate scientists, well represented on Twitter for example. Very odd to be demeaning them in the group. I don't get the gender comment. It might make sense if they were talking about climate disinformers who are predominantly older, white, rich, educated and male, but physical scientists? Puzzling.
Having nailed the Merchants of Doubt and their special interest funders showing how they to ensure that policy and politicians and economists stay on board the fossil fuel supertanker O&R somehow themselves come over all MsofD themselves and blame the scientists. 'Climate denial' doesn't even make the article's list.
Irony level seems high.
-
Chris Crawford at 00:49 AM on 28 July 2014Climate models accurately predicted global warming when reflecting natural ocean cycles
Thanks for explaining it to me, Bob.
Prev 724 725 726 727 728 729 730 731 732 733 734 735 736 737 738 739 Next


