


 Arguments


Recent Comments
Prev 774 775 776 777 778 779 780 781 782 783 784 785 786 787 788 789 Next
Comments 39051 to 39100:
-
barry1487 at 13:05 PM on 26 January 2014Australia’s hottest year was no freak event: humans caused it
Bruiser,
the solar exposure data is only 24 years long. It's possible that there have been previous years with more solar exposure (but lower national average temperature). So in order to test your hypothesis I did a state by state comparison. Using your methods (spatially similar), most states experienced the warmest years when solar exposure was not at the highest, and some states were warmest in a year when solar exposure was about average.
I agree that solar exposure should have some influence and that other factors are at play. But I think positing that solar exposure is the 'dominant' factor based on such a cursory analysis isn't convincing, particularly when belied by a slightly more granular look. We must admit that what we have attempted is a tiny fraction of the work done for formal studies, like the one mentioned in the article above, so neither of us should be jumping to conclusions.
There are way too many variables in our climate to settle on a single cause for any particular year.
Strongly agreed. The same point is made in the article above.What caused these extreme temperatures? Climate scientists have a problem: because climate deals with averages and trends, we can’t attribute specific records to a particular cause.
But our research has made significant headway in identifying the causes of climate events, by calculating how much various factors increase the risk of extreme climate events occurring.
This is probability analysis. The authors state,
We found that human influence increased the odds of setting this new record by at least 100 times.
Your approach is different. You are looking at attribution. Strange then, that you, me and the authors all agree that that is not possible for a specific year.
-
michael sweet at 11:28 AM on 26 January 2014There's no correlation between CO2 and temperature
tkman0,
Your description seems about right to me. At the surface (where we live) CO2 causes warming. In addition to the angle of emission, energy emitted upward is usually reabsorbed by another CO2 molecule at a higher altitude. This enhances the warming. Since the troposphere is cooler the higher you go, the higher molecule emitts less energy. As CO2 concentration in the atmosphere increases, the hight in the troposphere where the energy can escape to space becomes cooler. This is the basis of the greenhouse effect. This post on hte greenhouse effect might help a little.
The stratosphere is also cooled as you describe. This is one of the key predictions of greenhouse theory and demonstrates that the warming is caused by increased greenhouse gases and not the sun. There is no significant transfer of energy from the stratosphere to the troposphere so the cooling effect in the stratosphere has no significant temperature effect at the surface of the Earth. This effect was predicted decades ago.
Most of the energy that reaches the outer edge of the atmosphere reaches the troposphere. Half of the difference between the 1347 and the about 270 w/m2 at the surface is caused by the fact that half the Earth is in darkness all the time (the night side) so you have to devide 1347 by 2. Much of the rest of the difference is due to the fact that the remaining 675 W/m2 is a square meter perpendicular to the sun and the surface of the Earth is round so most does not receive the light directly. About 1/3 of the light is reflected by clouds. Scientists studying climate (the IPCC) have measured all this. While some energy is emitted from the upper atmosphere by CO2, the net effect on the surface of the Earth is warming. Much of the reflected energy and the energy emitted from the stratosphere has always been emitted. It is the changes in energy flux casued by changes in CO2 that we are interested in. Those energy fluxes cause the surface warming.
-
Rob Honeycutt at 11:03 AM on 26 January 2014There's no correlation between CO2 and temperature
tkman0... It sounds like your denier-guy has a bunch of accurate facts but is interpreting entirely the wrong way.
For one, the IPCC isn't getting things "spectaculary wrong." They're merely putting out a report on the current science. If he wants to claim the IPCC is misinterpreting the research, I would have to say, I don't hear a lot of climate researchers jumping up and down about these supposed errors.
Your denier-guy correctly states that there are many forcings that act on the climate system. I'd have him watch Richard Alley's lecture "The Biggest Control Knob" which explains the science of why CO2 is the biggest (but not only) factor controling global temperature.
Another weird one here: "This causes the oceans - when they get warmer - to release massive quantities of CO2 (and O2 etc)." Etc, etc.
He's getting his knickers in a knot merely because he doesn't understand that CO2 can act as a feedback (as with ocean warming/glacial-interglacial cycles) but can also act as a forcing (as with burning fossil fuels).
-
bruiser at 11:00 AM on 26 January 2014Australia’s hottest year was no freak event: humans caused it
@Barry - Hi Barry, I have not looked too closely at other years. My original point was and remains that the average temperatures across Australia should have been a new record based on levels of solar radiation alone. The major climate influences, IOD, ENSO and SAM all favour a drier South-eastern Australia. There are way too many variables in our climate to settle on a single cause for any particular year. Blaming the Australian 2013 record temperatures on AGW flies in the face of a very obvious and dominant natural cause.
Cheers,
Bruiser
-
tkman0 at 08:54 AM on 26 January 2014There's no correlation between CO2 and temperature
Also have another one I'd like answered:
"If you take an atom of CO2 in the lower atmosphere and it absorbs energy and reradiates it - molecules can be modelled as radiating energy in all 360 degrees. Part of that energy gets radiated back to the earth (around 36% in the lower troposphere) and part gets radiated to space. (I'm simplifying, ignoring the convective, conductive etc elements of energy transfer between atoms, reradiation etc).
As you ascend the atmospheric column ipast the troposphere, several things happen.
a). The arc of reradiation to the earths atmosphere decreases (to a very small number - less than 1%). And the amount reradiated to space increases. (Virtually all).
b). The contribution of convection, conduction decrease as well to almost zero, and the contribution by radiation dominates (due to concentration of molecules, primarily).
So, by the time you get to the outer atmospheres, CO2 is no longer acting to warm the planet. In fact in the outer atmosphere, the amount of energy absorbed from IR emitted from the eart is for all intents and purposes - zero. Instead, in the outer atmospher, CO2 is energized (and in fact is almost always a plasma in some strata) by much more energetic radiation. And CO2 serves to reradiate this energy back into outer space.
This is proven born out by the fact that the energy density of solar radiation at the outer edge of the atmosphere is roughtly 1347 per meter square. And the aereal density at the earth's surface is much less than a quarter - the rest of the energy (simplification) is reradiated to space.
So in fact, by the outer atmosphere, CO2 is acting to COOL the planet.
In the previous thread, I provided links to the study by Nasa that confirmed this finding, and confirmed that they would have to reconsider the NET effect of CO2 on global warming (warming in the low atmosphere, cooling in the high atmosphere)."
Moderator Response:[TD] First, he needs to revisit his geometry; CO2 molecules would have be to pretty darn high for "nearly all" of their emitted radiation to go to space. Here is one explanation of how CO2 cools the stratosphere while warming the troposphere: "Stratospheric Cooling and Tropospheric Warming."
-
tkman0 at 08:50 AM on 26 January 2014There's no correlation between CO2 and temperature
Ive been debating a climate change denier for a while on a website, and he stated this and I was looking for a fair rebuttal:
"
I return to the fact that you should not make the assumption that I know nothing about climate warming - and you would learn more if you asked questions about what my beliefts are.
Carbon is only one of MANY forcing elements in climate. And the IPCC has been spectacularly wrong on many of them - and even admitted the same. Such as, for example the importance of aerosol formation on clouds. The importance of ionizing radiation for aerosol formation.
Finally, I return to a question I asked several weeks ago.
When the temperature of the ocean increases, the solubility of gasses decrease - something known as Henry's law or Boyles law. This causes the oceans - when they get warmer - to release massive quantities of CO2 (and O2 etc).
This is known fact.
The opposite is in fact, not proven. In other words given increased CO2, AGW says that ocean temperatures increase.
The observable fact is that increasing temperatures correlates with increased CO2 concentration. But it doesn't say a damn thing about causation.
Can you restate my point here so that I can confirm you understand it?"
Moderator Response:[TD] See the post "CO2 is Not the Only Driver of Climate," noticing the relative contributions of various forcings. By "ionizing radiation" I'm guessing that he/she means cosmic ray influence on clouds; see "It's Cosmic Rays." Notice there are multiple tabs--Basic, Intermediate, and Advanced.
Regarding oceans: Of course climatologists know that the CO2 absorbing capacity of the oceans decreases as the oceans warm. However, oceans continue absorbing until they reach a fairly high temperature. And a counterforce is that the oceans also absorb more CO2 as the amount of CO2 in the atmosphere increases. Climatologists figure all that into their calculations. We know that currently the oceans continue to absorb, not emit, CO2, because (a) the oceans continue to acidify (i.e., become less alkaline) as a consequence of their CO2 absorption, and (b) the oceans absorb the bulk of CO2 from human activities, along with all the natural emissions of CO2: See here and here.
Causality of CO2 versus temperature was established when the mechanisms were understood (via experimentation) back in the 19th through mid 20th centuries. Observations of global temperatures confirming those theoretical projections were made decades later, when global observations were sufficiently capable. The exact mechanism by which CO2 warms the oceans was determined later, but again with experimentation.
The fact that temperature increase causes CO2 increase in no way undermines the fact that CO2 increase causes temperature increase; see "CO2 Lags Temperature" and also "Warming Causes CO2 Rise."
-
Stranger8170 at 08:40 AM on 26 January 20142014 SkS Weekly News Roundup #4B
It's very upsetting when you realize that certain vested interests keep alive bogus ideas because of their deep pockets and nothing else.
Where can I send a donation to help promote the AGW message? I've spent a lot of time at blogs making the same repeated general defenses against their zombie science. Since I’m a mile wide and a foot deep when it comes to the science, I think I might serve the cause more by helping in financial ways.
-
It’s all a Question of Balance
#4, Kiwiiano:
Interesting question!
Let’s assume that all types of coal have an average energy content of roughly 25 megajoules per kg.
To release 300 trillion watts of heat from coal burning would therefore take 3 x 10¹⁴ / 2.5 x 107 = 12,000,000 kg or 12,000 tons of coal every second.
That equals about 1 billion tons per day or 365 billion tons per year, about 50 times more than the actual global coal consumption! And that’s just the energy imbalance. The net anthropogenic forcing is 3 or 4 times higher.
Needless to say that the sceptical argument "It’s waste heat" is hard to take seriously for anyone who have bothered to learn a little about the subject!
-
william5331 at 04:46 AM on 26 January 2014More global warming will be worse for the economy, says Copenhagen Consensus Center
As dire as these predictions are, they may be highly optomistic. Over the past few years we have had little rumbles in the agricultural production of Northern Hemisphere countries (and Australia, this year, by the way). The Jet stream reminds me of a top that is slowing down and wobbling, just before it falls over. In the past with the continents, basically in the same positions that they are now, there were trees right up to the shores of the Arctic ocean. If our climate shifts rapidly or even worse, if it flickers back and forth between the present situation and the new one, with climate zones radically shifted northward in the new one, we will have massive crop failures. You can fill in the rest of the scenario following even one year of crop failure.
-
Phil at 00:53 AM on 26 January 2014Newcomers, Start Here
Zinckidd @236.
Coming to this a bit late, sorry - hope you're still reading ...One point that follows on from DSL's is why, if your friend is right, is there no Climate Change equivalent of Edward Snowden ? Now whatever you think of him, you cannot deny that the CIA and NSA managed to employ someone who, through the courage of their convictions, eventually blew the whistle on what he saw as a wrongdoing (at considerable personal cost). How come, given the size that the "Climate Change grant funding conspiracy" would have to be (and the number of years it would have to have been in action) why has no-one blown the whistle ?
Another point concerns the "ClimateGate" emails. Deniers trawled those email for evidence of wrongdoing and found only a few instances of anything of interest, all of which, under closer examination turned out to nothing more than unfortunate turns of phrase that sounded damming only when taken out of context. But there was nothing at all in the entire archive to suggest a link (either real or imagined by the researchers themselves) between funding and the results they obtained. -
barry1487 at 00:06 AM on 26 January 2014Australia’s hottest year was no freak event: humans caused it
Bruiser, I rechecked the 2013 solar exposue map against annual values for various locations again and you are quite right. The colour bands do not match the local values. I will email BOM about it.
2Mj/sq M/day is an enormous amount of additional energy if you accept the calculation that just 0.4 W/sq M is sufficient to cause the decline in arctic ice. (energy required to melt 290 cubic Km of ice).
How then would you explain that 4 out of 7 states had warmest years when before 2013, when solar exposure was not highest (in the capitals)?Following are the warmest years by state, and solar exposure data value (Mj/sq M/day) for that year, ranked from highest, per single locational in the capitals, then record solar exposure (2013) in bold. Period is 1990 - 2013 incl. which is all the solar exposure data we have.
NSW/ACT - 2009
Sydney (Botanic Gardens) - 16.3 (15th) - 18.8
Canberra (Botanic Gardens) - 17.6 (10th) - 19.3
TAS - 2007
Hobart (Botanical Gardens) - 14.1 (11th) - 15.0
VIC - 2007
Melbourne (Botanical Gardens) - 16.1 (4th) - 16.9
QLD - 2005
Brisbane (Botanic Gardens) - 19.4* (3rd) - 20.1
* 2005 is missing December solar exposure data for all locations, but it is very high the other 11 months.If solar exposure is the dominant influence, and you are happy to extrapolate by single locations at the capitals, then why do these results not correlate? Why is annual solar exposure 2 Mj/sq M lower than the record for Sydney and Canberra during NSW/ACT warmest year? Why did Hobart's annual solar exposure rank 11th during Tasmania's warmest year?
(I used different locations in the cities for this post. It was usually airports for my previous post, which is why some values are different. Selected Botanic Gardens this time because that was a common location that had full data in each city, and this time counted 2005 as 3rd highest solar exposure for each capital. That estimate and location changes make no difference to the point.)
-
kanspaugh at 23:42 PM on 25 January 2014Answering questions about consensus in a MOOC webinar
The question about the authors surveying only climate science journals kills me. Should fossil fuel trade magazines have been included? How about "Crackpot Quarterly"? / / When it comes to this question of whose opinion about climate change is worth considering, one might reflect upon the implications of the recent survey that discovered, among those who self-identify as Republican, almost twenty percent more believe in demonic possession than believe in anthropogenic global warming. Millions believe that Hell exists, that Satan lives there, that He periodically sends evil demons to earth to displace our souls from our bodies, THAT they believe. But the idea that dumping billions of tons of heat-retaining gas into the atmosphere will eventually warm that atmosphere? I mean come on, that's really far fetched . . .
-
Micawber at 22:37 PM on 25 January 2014It’s all a Question of Balance
The analysis of heat balance is fine. However, the ocean does not boil dry because it is heated from the top.
Ocean surface buoyancy is pulled in two directions. Seawater density decreases with increasing temperature but decreasing salinity. Tropical evaporation takes heat from incoming radiation, puts water vapour into the atmosphere, and produces brine that sinks and carries heat downwards.
Zonal Walker and meridional Hadley cells carry water vapour away from the equator. The result is that the ocean surface has a buoyant brackish layer increasing to tropical warm pools, and polewards. The Arctic Ocean has more freshwater from runoff and icemelt than any other Ocean per unit volume. Moreover, evaporation increases by 7% per degC temperature increase while precipitation increases by 2-3% per degree. There is therefore a positive feedback through atmospheric humidity.
Ocean heat trapping, poleward transport of heat and nutrients has been buffered until recently by basal icemelt according to a recent paper:
http://www.ocean-sci-discuss.net/11/47/2014/osd-11-47-2014-print.pdf
I take this paper very seriously because it is based on actual fieldwork observations to oceanographic standards. It also shows that heat in the oceans is very hard to extract. The prognosis is that ocean warming will continue to accelerate.
The problem should properly be addressed by extensive near-surface fieldwork particularly on meridional transects. This cannot be done by satellite observations. They cannot do plankton tows by satellite.
There has been a well-funded denier lobby to convince the public that AGW is a scam.
The result is that field research is being discontinued everywhere as SKS readers know well.
US, Australia, UK have all reduced budgets. UK ocean research budget was slashed a year ago.
Canada is only the latest casualty. This alarming video should be widely read and discussed:
Silence of the Labs http://www.youtube.com/watch?v=Ms45N_mc50Y -
bruiser at 21:03 PM on 25 January 2014Australia’s hottest year was no freak event: humans caused it
Hi Barry, My check of values against the map found only one where the actual record was within the correct colour band; some were over 2MJ above the displayed range. 2Mj/sq M/day is an enormous amount of additional energy if you accept the calculation that just 0.4 W/sq M is sufficient to cause the decline in arctic ice. (energy required to melt 290 cubic Km of ice).
Diurnal variation has interested me for a few years. For example, if you plot the data for Melbourne, you get a steady decline. However, the Melbourne weather station is situated at a busy city intersection. I plotted the data for Laverton on the same graph and there is a great correlation until about 1964 when there is a steady roll-off in the Melbourne values. No such decline occurrs for Laverton - suggesting that the Melbourne site was affected by some form of development.
-
michael sweet at 19:41 PM on 25 January 2014More global warming will be worse for the economy, says Copenhagen Consensus Center
My understanding is that in addition to the economic injustices described above, economic bean counters often count damage from AGW as enhancing economic activity. Say Hurricane Katrina causes $100 billion in damage to houses. This is not counted as part of GDP. People come in and rebuild half the houses destroyed at a cost of $50 billion. This is counted as an increase in GDP. People end up with houses worth $50 billion less than they started with and GDP increases $50 billion. If damage from AGW counted against GDP we would already see measurable affects to lower GDP. Is this understanding correct?
-
Glenn Tamblyn at 16:25 PM on 25 January 2014It’s all a Question of Balance
HK
Interesting analogy. This is also why I used the Sydney Harbour analogy. Something visual, visceral and imaginable.This could be extended to your body-of-water of choice.
Here is another one, Take this heat and imagine it was all going into just the air - I know that is unphysical but it is still informative.. 4 Hiroshima bonbs per second equals a temperature rise for the atmosphere of 1.6 Deg C/year.
-
adamski5807 at 15:52 PM on 25 January 2014More global warming will be worse for the economy, says Copenhagen Consensus Center
what do we exactly mean when we say economic growth? Growth of what? The problem with capitalism' is that short term profits always out trumps long term outcomes, as externalities are never factored into"free market" calculations.
here are some suggestions to begin the long path in address this that you wont see discused in our media or implemented by our so called leaders and "captains of industry" unless we force them.
five-economic-policy-changes-for-2014-that-could-boost-employment-and-reduce-climate-disruption
-
jja at 15:39 PM on 25 January 2014More global warming will be worse for the economy, says Copenhagen Consensus Center
Tom@4
Agreed. on almost all points.
when you say "we" you are referring to a large body of individuals, some of whom are type-1 error avoidance biased and others are type-2 error avoidance biased.This is the origin of the conflict of the discussion.
Anyone of reputation in the field of economics or evnironmental studies who believes that a 4C rise in temperatures in the next 60 years won't cause negative economic growth should be disregarded as an ideological actor and not worth listening to.
This, of course, assumes we aren't taking fault with the concept of GDP as a measure of prosperity nor of the abject failure of assigning value as one attempts to substitute for massively expanding desertification, the collapse of the amazon rainforest, the burning of the boreal forests, global-scale extinction events of niche species, fishery collapses and the probability that these feedbacks herald at tipping-point mechanism that will result in a 350 year feedback loop that will eventually result in a p-tr event global extinction.
-
Tom Curtis at 14:40 PM on 25 January 2014Three perfect grade debunkings of climate misinformation
Poster @20, Jan 1997-Dec 2013 is 17 years. As Warren Hindmarsh made a claim of "...a halt in the warming over the last 17 years or so..." I am required to use a 17 year interval to test his claim. So yes, 17 years is a cherry pick, but it was Warren Hindmarsh's cherry pick, not mine.
-
From Peru at 13:56 PM on 25 January 2014More global warming will be worse for the economy, says Copenhagen Consensus Center
oops!
I should have written:
"if you have a wealth of 10 000 $ and lose 5 000 $ you have a relatively bigger damage (half your wealth) than losing the same 5000 $ out of lets say, 100 000 $ ("just" a 5% loss)"
-
Poster9662 at 13:53 PM on 25 January 2014Three perfect grade debunkings of climate misinformation
Tom Curtis Apologies but could you explain what appears (note I say appears not is) a contradiction in your post @10 above. With regard to a pause or hiatus or whatever in global temperatures you state "Warren Hindmarsh @9, it is fairly easy to debunk the two fictions you mention by simply pointing out that they are fictions. This can be seen easilly for the satellite data on the SkS trend calculator. Just set the platform to UAH, and the start year to 1997.0 and you will see the trend is 0.93 +/- 0.208 C/decade. The central estimate, therefore is strongly positive, and while negative trends are not excluded, neither are trends 50% stronger than those predicted by the IPCC. Calling such a trend "a halt in the warming" at best shows a complete lack of understanding of the meaning of error bars"
I may well have misunderstood but from what you write it seems you are advocating starting at 1997 to "properly debunk the fact that accurate satellite measurements have shown a halt in the warming over the last 17years or so?"
You then write "Some people have misrepresented the ARGO data by only showing the 0-700 meter Ocean Heat Content, ie, by excluding 65% of the data. Excluding data like that because you do not like what it shows is fraudulent. Arguable, so also is the massive cherry pick involved in selecting 1997 (a very strong El Nino year, with temperatures far above trend rates) as a start year for your comparison."
This suggests that picking 1997 as start year is somewhat fraudulent and is seemingly at odds with your earlier comment. I expect I have misunderstood and apologies in advance if I have but would you clarify?
-
From Peru at 13:45 PM on 25 January 2014More global warming will be worse for the economy, says Copenhagen Consensus Center
The (social) discount rate (ignoring risk) is given by the Ramsey rule:
r = δ +γ g
Where:
- r is the discount rate,
- δ is the so-called "impatience rate",
- g is the growth rate of comsumption (a.k.a. "economic growth") and
- γ is a proportionality constant called "relative aversion to intertemporal inequality"
δ for intergenerational matters must be zero (unless you value future generations less than the current one, a completely immoral prejudice), leaving the discount rate just as a function of economic growth.
A positive intergenerational discount rate makes sense if and only if you assume that future generations will be richer than the current one, because a given damage is less serious if your wealth is bigger (i.e if you have a wealth of 10 000 $ and lose 5 000 $ you have a relatively bigger damage (half your wealth) than losing the same 500 $ out of lets say, 100 000 $ ("just" a 5% loss)).
This is however a really bold assumption. No one knows for certain what the future wealth of people will be, and if Climate Change is really as serious as the evidence suggests, the economic growth could be offset by a growing economic climate-related damages.
Now "growth" is a few % of GDP. When climate damages approach, as a fraction of GDP, that number, overall economic growth indices will have an ominous "-" sign, and the discount rate given above will be negative.
Will that happen? I don't know, but I strongly suspect that it will. What do you think?
-
Doug Hutcheson at 13:25 PM on 25 January 20142014 SkS Weekly Digest #3
Composer99, you have my heartfelt agreement. As a writer, I squirm at the times I have hit 'Submit', before noticing the typos. An 'Edit' feature would be sheerest delight.
-
Tom Curtis at 13:11 PM on 25 January 2014More global warming will be worse for the economy, says Copenhagen Consensus Center
jja @3 the discount rate accounts for several things. One is the pure rate of prefference for present with respect to future gains. To the extent that that is rational, it is based on an estimate of the probability that we will survive to enjoy the future gains. A pot of gold now is twice as valuable as four pots of gold in 40 years if we only have a 12.5% chance of surviving the 40 years to recieve the gold. There is, of course, more to it than that, but that is the gist. Increasing the discount rate to account for this factor represents an implicit devaluation of future generations, and is morally objectionable.
In addition, however, there is a discount to allow for the average expected rate of return. That is, if we invest a trillion dollars now to mitigate global warming, would we have gained more if we had instead invested in economic growth? Low discount rates (3% or less) are generally justified on this basis.
There is a problem with even this. It assumes ongoing economic growth with unmitigated global warming. Given the ecological effects likely with unmitigated global warming, that is far from a certain proposition. Indeed, if we were certain that unmitigated global warming would reverse economic growth (and we are not), that would require a negative discount rate.
-
jja at 12:50 PM on 25 January 2014More global warming will be worse for the economy, says Copenhagen Consensus Center
It is a distinct moral failure to use a positive discount rate when weighing the economic costs of mitigation and adaption as compared to the current economic benefits of fossil fuels and future climate cost impacts.
These people have no love for their children or grandchildren.
They also have no concept of what the gross societal impacts will be from CURRENT CO2 atmospheric levels. The most recent reports indicate that subtropical low clouds/fog will dissapear as the earth warms, and that our 2XCO2 Equilibrium Climate Sensitivity is closer to 4.3C. This means that we will pass the atmospheric threshold of 2C by 2100 within the next 10 years. It also means that we will likely suffer a catastrophic global economic collapse within the next 50.
This economic collapse will destroy future economies and proves that the current A2r emissions pathway we are on deserves a NEGATIVE discount rate when weighing the the economic costs of mitigation and adaption as compared to the current economic benefits of fossil fuels and future climate cost impacts.
A more realistic analysis of the current trajectory would prove that, even without a negative discount rate, the current global carbon budget, in terms of societal costs, is actually about equal to the global annual GDP. -
Tom Curtis at 12:02 PM on 25 January 2014It’s all a Question of Balance
Nichol @5, not only is the slight decrease in entropy caused by organizing a small amount of matter at the Earth's surface made possible by the very large energy flow from very low entropy (sunlight) to a very high entropy sink (space, at a temperature of about 3 K); but life works to increase the overall entropy at the Earth's surface. Life mixes layers, transfers energy from warm daytime to cool night times and in other ways acts to increase entropy at the surface more than the decrease involved in its existence. From a thermodynamic point of view, life is just a means of maximizing entropy faster.
-
Tom Curtis at 11:56 AM on 25 January 2014It’s all a Question of Balance
Glenn, a fantastic article. Thankyou.
-
From Peru at 11:56 AM on 25 January 2014More global warming will be worse for the economy, says Copenhagen Consensus Center
I just wonder what is the chance that the damages due to climate change , as a % of global GDP, will at some point be greater than the so-often mentioned GDP growth , resulting in a shrinking GDP that, among other things, imply a negative discount rate.
Have anyone predicted a global-warming driven global recession?This kind of recession would be, unlike the 1930s and late 2000s ones, not a temporary one driven by a reversible process (a financial crisis), but one driven by an irreversible increase in costs (climate-related damages) that might last centuries if not millennia.
-
denisaf at 11:26 AM on 25 January 2014It’s all a Question of Balance
This article provides insight into how the greenhouse gas emissions from the use by industry of fossil fuels have disrupted the delicate heat balance. The feedback from global atmospheric warming will only slightly act to restore the balance. Reduction of the rate of emissions from fossil fuels (the popular anthropocentric antidote) will, at best, slow down the rate of warming. Knowledge of what has gone wrong is interesting but it is a diagnosis of the terminal illness of our civilization.
-
Nichol at 10:26 AM on 25 January 2014It’s all a Question of Balance
Excellent description! We are not in a static equilibrium, but in a highly dynamic one. The example of the see-saw by plg is a static equilibrium. It is difficult to think of a proper analogue of such a really dynamic equilibrium.. but let me try.
I like to compare the earth system a bit with standing under a shower. The sun showers light onto us all the time, but the resulting heat is radiated away like the water runs down the drain. If you stand on the drain so not enough water can run away, you can make a big mess.
Or we can think if a small stony river, meandering through a flat land. You can stand in the middle and lots of water comes towards you, but all of it passes by. If you start playing with the stones, you'll see that you can build a small dam that gently pushes the water to the left or right. You'll be surprised with the force that the water can be made to hit the river bank. It will even slowly change the course of the whole river. That is because you're playing with the precise balance of all that water coming, and going with great force. You only need to divert a small part of the energy sideways to get a big change.
-
Nichol at 10:06 AM on 25 January 2014It’s all a Question of Balance
Slightly off topic, though related. But fun.
Here's a fun theory from a physicist that has been looking at the second law of thermodynamics, the one about entropy. He concludes that on a planet that has such a huge throughput of energy, both coming in, and going out .. you would expect that entropy can locally increase on earth. And that is exactly what happens when life evolves, and what life does.
https://www.simonsfoundation.org/quanta/20140122-a-new-physics-theory-of-life/
-
gws at 08:24 AM on 25 January 2014Mitigation Mosaic: How small steps can make a difference
Great post, Baerbel!
There is a new, useful overview of Germany's overall path here.
-
Kiwiiano at 05:33 AM on 25 January 2014It’s all a Question of Balance
Thanks for that HK, I've always felt that Hiroshima bombs as an index was unnecessary scare-tactics because of the burden of radiation, blast destruction, etc we associate with nuclear explosions. What would the heat gain equivalent expressed in gigatonnes of coal burning/hour rather than kilotonnes of TNT exploding? That might capture the feeling of inexorable increase better, although it's still going to produce numbers that are hard to grasp.
-
One Planet Only Forever at 05:03 AM on 25 January 2014More global warming will be worse for the economy, says Copenhagen Consensus Center
These evaluations are not as helpful as they could be. A recognition of the unacceptability of creating any impact or potential impact on others, particularly future generations, is required for humanity to develop a sustainable better future for all life on this amazing planet.
As compelling as these evaluations appear to be, they are still fundamentally flawed in a fairly obvious way. The situation is far less acceptable than is being presented. The evaluations ignore the blatant illegitimacy of one group getting benefit at the expense of others. They identify that nations benefiting less from unsustainable and damaging activities suffer more. However, they ignore the unfairness of prior generations benefiting at the expense of future generations. Some of them probably even ‘discount the costs faced by future generations’.
Investors comparing their options will discount future potential costs because, from their perspective, money earned sooner is worth more than money earned later. That can be a legitimate way for an investor to choose between options when they will be the ones suffering any and all consequences of their decision and actions. It is unacceptable to extend that type of evaluation to this type of an issue. It is inappropriate to weight the benefit that one group of people get against the consequences faced by another group (a future generation).
That type of evaluation continues to be used to build false justifications for all types of unsustainable and damaging activities. Obama mentioned it as a fundamental consideration regarding the potential approval of the Keystone XL Pipeline. They really did the math of what they think future generations will face, discounted it, and then compared it to what they thought the benefit would be for a portion of the current generation. The Alberta and Canadian Governments used exactly the same unacceptable evaluation as justification for approving the expansion of the admittedly damaging Shell Jackpine Oil Sands operation.
Until these erroneous methods of 'determining and assigning value' are ended, the socioeconomic system will continue to develop unhealthy unsustainable and damaging economic activities, activities. The greedy among us will never stop trying to get away with benefiting unacceptably and illegitimately. It needs to be harder for them to 'get popular support' for suggestions that unsustainable and damaging activities people enjoy benefiting from are 'justified'. And they really should not be able to have any ‘value’ obtained from an unsustainable and damaging activity.
For humanity to have a future, it is essential that actions by one person or group are not allowed to potentially negatively impact others, particularly not impact future generations. And they should not be able to benefit in a way that all others cannot also benefit from, forever. Until that fundamental requirement is globally achieved we will continue to see the success of leaders in industry, finance and politics whose actions are ultimately unsustainable and damaging.
Greed and the actions it can motivate people to try to get away with are not good, but they can be ‘popular’, The potential popularity of inconsiderate attitudes and actions is the fundamental problem.
-
One Planet Only Forever at 03:33 AM on 25 January 20142014 SkS Weekly News Roundup #4A
Wol @2.
A more realistic way to look at the population issue is to recognize that it is the number of people whose lifestyle leads to the highest consumption and impacts that must be reduced.
That is essentially what the point of Kyoto was all about. It was going to require the highest per-capita consumers and impacters to change their ways and help the less fortunate become more fortunate without becoming big per-capita consumers and impacters.
-
One Planet Only Forever at 03:26 AM on 25 January 20142014 SkS Weekly News Roundup #4A
Wol @2.
Overpopulation is a concern, but it has nothing to do with the fundamental lack of sustainability of human activity based on the consumption of non-renewable resources.
There is no future for attempts to get benefit from the consumption of non-renweable resources. Eternal full-recycling of such resources would have a future. Burning them definitely doesn't.
-
GRLCowan at 01:23 AM on 25 January 2014Three perfect grade debunkings of climate misinformation
I will not tie the battle to mitigate global warming to the battle to legalize nuclear power. Mitigating global warming is to important to waste political capital by tying it to a method that is political poison, and probably unnecessary.
No, it's necessary. Nuclear power is political poison exactly to the extent that it deprives governments of fossil fuel income (64 gigatonnes CO2 worth to date, according to Kharecha and Hansen). Any highly effective global warming mitigation method will excite the same sort of opposition.
-
Composer99 at 00:55 AM on 25 January 20142014 SkS Weekly Digest #3
Since these are open threads, I'm going to put a plug in for adding a post-submission "Edit" feature for commnets the next time a change to the commenting user interface is considered.
-
barry1487 at 00:24 AM on 25 January 2014Australia’s hottest year was no freak event: humans caused it
Bruiser, thanks for the link.
I can confirm that all the capitals and about 20 other stations I checked all had record-breaking solar exposure. I think it's safe to assume I didn't just chance upon the outliers. So I checked the colour maps against the values and they are a good fit. The problem, I realize, is that the resolution of the colour maps is too coarse. The difference between average and record-breakers is 1-2 Mj/sq/m, but the colour maps are in increments of 2 Mj/sq/m (annual), and 3 Mj/sq/m (long-term average). So I withdraw the earlier comparison. I could find no national average data, so can't crunch the numbers.
I checked the warmest years for each state. 3 broke records in 2013, 4 were warmest in previous years. Of the 4 states that were warmer prior to 2013, solar exposure ranked 3rd for two of them, 8th for another, and 13th for NSW. This is based on the solar exposure data for one location in each capital. The SE data is only 24 years long, 1990 to present. Heavy caveats are applied. My extrapolation was spatially similar to yours (1 data point per state for me, 9 data points for the nation for you).
With less than 50% correlation between highest solar exposure and warmest years for state based on limited data, solar exposure does not seem to be a dominant influence. I checked the diurnal record for the full period (from 1910). The trend is downwards. Nghts have warmed faster than days, indicating solar influence is not the dominant driver of rising temps, although this says little about the record 2013. The diurnal trend is more consistent with GHG forcing.
Of the last 4 warmest years nationally, 2005 and 2013 were close in highest solar exposure and ENSO neutral. The next two warmest years (1998 3rd, 2002 4th) were El Nino years with average solar exposure (as best I could tell). We do not have solar exposure records prior to 1990.
That's the best I could do with the data and time available. If I had national solar exposure data, I could make a better comparison with the global temperature record to check for correlation. From limited data (I checked temp record with solar exposure from a small number of stations - the capitals) the correlation does not seem to be strong. For example, while Darwin Airport had it's 3rd highest solar exposure of the 24-year record in 2006, that year saw the 18th highest temperature in the same period, same location. I may do more work when I have time - like plotting and comparing time series of both indices for various locations. But check it out more thoroughly for yourself if you feel inclined.
Barry.
-
Dikran Marsupial at 19:43 PM on 24 January 2014Global warming theory isn't falsifiable
My theory that Tom could give a good answer was not falsified, thanks Tom!
The thing that I would point out is that the attempts to falsify the models never seem to mention the decline in Arctic sea ice, which is much more obviously wrong in the models than the tropical trophospheric hotspot (both of which the climate modellers are well aware and quite happy to discuss). I wonder why that might be ;o)
Falsifiability is a useful concept in science in the same way that frequentist hypothesis tests are, both have severe limitations and both are widely misunderstood. Used properly, however, they are both good methods of providing basic sanity checks that help us not to jump to conclusions (i.e. they help us to be self-skeptical - which is the most important form of skepticism, if you haven't got that, you haven't got any other sort!).
-
ajki at 18:24 PM on 24 January 20142014 SkS Weekly News Roundup #4A
Meanwhile in the arctic region...
The Arctic Frontiers conference was held in Tromsö, Norway, this week. Irene Quaile from Deutsche Welle covers this event on her blog, starting with "Arctic Frontiers: Humans in the Arctic".
While the arctic regions are undergoing much more of a change than other regions as a result of global warming, a kind of unwillingness to deal with the problems can be noticed, states Quaile in her recent blog "Climate Change: Arctic in denial?" where she cites Kari Marie Norgaard (Professor of Sociology at the University of Oregon) and Per Espen Stoknes (Associate Professor at the Center for Climate Strategy of the Norwegian Business Institute NBI) who are currently studying this phenomenon.
-
denis.boarder at 15:51 PM on 24 January 2014Three perfect grade debunkings of climate misinformation
Tom... many thanks. I appreciate your time. Will have a good read.
-
Tom Curtis at 14:59 PM on 24 January 2014Three perfect grade debunkings of climate misinformation
denis.boarder @16, the comment is basically correct right up to the last two sentences. Specifically, the three dominant short term fluctuations that influence Australian climate are:
The Southern Annular Mode (SAM), which strongly influences whether the southern states (Western Australia, South Australia, Victoria and Tasmania) will have wet or dry winters.
The Indian Ocean Dipole (IOD), which influences spring (from memory) rainfall in the southern states, and summer rainfall in the top end (ie, northern Australia, particularly northern Western Australian and the Northern Territory).
The El Nino Southern Oscillation (ENSO), which influences eastern state rainfall and temperatures, particularly Queensland and New South Wales.
The last two sentences in the comment, however, are simply false. The person writting the comment appears to have assumed global warming is supposed to cancel the effects of the drivers of weather. That is a logical absurdity equivalent to assuming that because global warming is supposed to make things warmer, each night must be warmer than the preceding day.
Rather than cancelling the effects of existing drivers of weather, global warming modifies those effects. Thus warmer tropical waters results in more rainfall IOD positive states with more rainfall in northern Australia than past IOD positive states, in IOD negative states with more rainfall than past IOD negative states. The result is a clear positive trend in northern Australian rainfall:

It is interesting in this respect to compare 2013 with 1919. Both years were significantly dryer in northern Australia than were surrounding years, consistent with your commentors claims - but the rainfall anomaly for 1919 was -129.35 mm, compared to -33.56 mm in 2013. That is a difference of almost a 100 mm, and is inexplicable on the comment author's theory that its just weather, but is predicted as a consequence of global warming.
Likewise, the SAM varies as a partern of weather, but global warming predicts that on top of that there will be a long term trend to more positive SAM conditions:
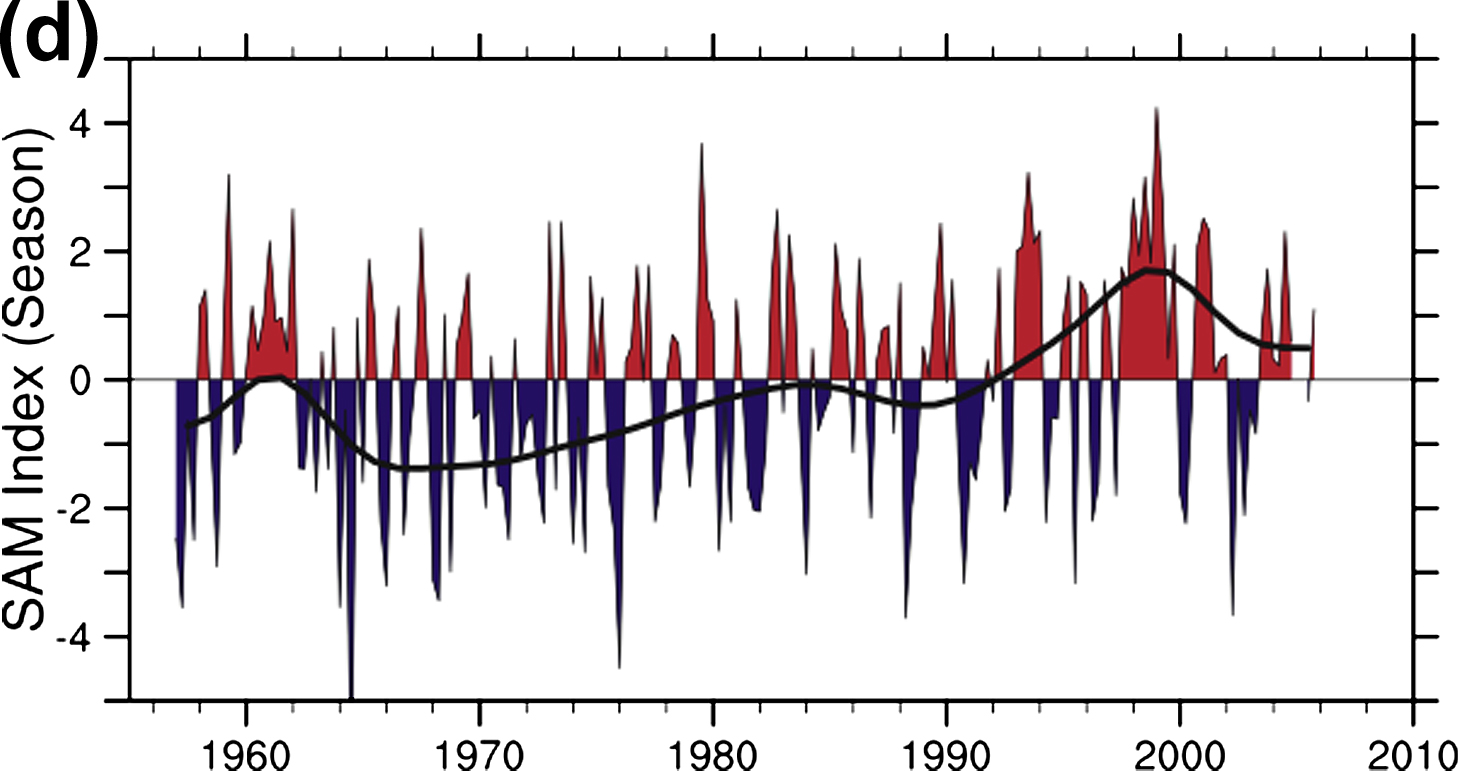
(Updated graph available here.)
It is that trend, explicable, and indeed predicted as a consequence of global warming, but inexplicable in terms of the SAM which explains southern Western Australia's long term drying trend:

Note that the SAM was positve negative in 2013 (see updated chart in link), which explains why 2013 was wetter than most recent years in WA. It does not explain why it was dryer than average, or why a wet year in the 2000s is about as wet as a dry year in the early 1900s.
Similarly with ENSO, it was the strong La Nina which explained the record breaking floods in Queensland and Victoria in late 2010 and early 2011 (although not why they were record breaking); but it does not explain why the record broken for flood effected area in Queensland was set only in the preceding March during an El Nino event.
-
Wol at 14:51 PM on 24 January 20142014 SkS Weekly News Roundup #4A
>>The only sustainable future for humanity or an economy...........<<
The fundamental problem for climate change, resources, biodiversity etc etc is overpopulation. That is the ONLY thing that matters.Some are keen to say that population is forecast to stabilise at 9Bn plus, but nobody seems to address the question of whether even *that* number is remotely sustainable. Bear in mind that everyone would like to see the developing countries attaining a high standard of living.
Various estimates of sustainable population have come up with hugely differing results, but almost all put the number way below 9Bn IF a more equal standard of living is taken as read.
Taking action on carbon without addressing the real problem is like running up the down escalator without first pushing the "Stop" button.
-
denis.boarder at 13:02 PM on 24 January 2014Three perfect grade debunkings of climate misinformation
Can anyone help?... (Not sure if this is the right area to ask this question)
I would appreciate an opinion on the following comment posted in response to Graham Readfearn's recent Guardian blog. Having found information on ENSO, SAM and IOD I must admit I struggle to understand the relationships, specifically in response to the assertion below.
The Comment
Australian weather is not about ENSO on its own there are the SAM and the IOD These tend to reinforce each other depending upon their Phase. Australia has just experienced a multi year strong La-Nina which was not reinforced either by the SAM or the IOD. The La-Nina ended in 2012 every time we swing from a strong La-Nina we often experience a strongly positive SAM this keeps the usual west east weather patterns and cold fronts well to the south, similarly the OID is keeping WA dry and the northern Monsoon season has been delayed and mild. This is the exact opposite of AGW predictions, as the earth warms the Monsoon season is supposed to extend in duration and latitude. We are witnessing the weather not AGW, the last time something similar happened was in 1919. -
Tom Curtis at 09:52 AM on 24 January 2014Three perfect grade debunkings of climate misinformation
franklefkin @13, it is true that I chose the only satellite index with global coverage. However, Warren referred to "... accurate satellite measurements ..." (note the plural), which appears to indicate that both satellite records show the pattern. His claim is false, therefore, if either does not. Therefore showing UAH was sufficient to show his claim to be fiction. Had he specified the RSS record only, then his claim would have been true, but massively cherry picked and misleading.
Of course, it is possible that by "accurate satellite measurements" he meant "those, and only those, satellite measurements that make my statement true"; ie, that he was obliquiely cherry picking. In that case I misinterpreted him and his first claim was true but a massive cherry pick.
Unfortunately, while it is possible to interpret Warren as saying something true (though cherry picked as to source), or something not cherry picked as to source beyond the limitations to satellites, but false - we cannot be so charitable with you. You want his claim to refer to both satellite records so that it is only a limited cherry pick, but also to only refer to the RSS so that it is true. Alternatively, you want his claim to refer to both, but for a conjunction to be true when one of the conjuncts is false.
You compound the irrationality by concluding "...but the question asked was about the satellite records, not about a highly accurate satellite record" when Warren in fact specified "accurate satellite records" (my emphasis in both quotes).
-
scaddenp at 09:34 AM on 24 January 2014Three perfect grade debunkings of climate misinformation
Well I would say that there are several ways to "proper" debunk the "hasnt warmed x years". Firstly by pointing out that 17 years is a cherry pick - start with monster El Nino and end with ESNO neutral. Compare with using 16 years and 19 years. Second there is "accurate satellite measurements" - accurate according to who? Both UAH and RSS struggle with the numerous issues associated with drift and extracting LTT. The recent Cowtan and Way paper points the way to disintangling drift but hasnt been done to my knowledge. If you overlay the records, you will see that the satellite records for lower troposphere have a much stronger response to both La Nina and El Nino than the surface temperature record. Does the lower troposphere really react that differently to the surface or is that an artifact? Either way take "accurate" with a grain of salt. How do you think those temperature records (and subquently the trends) are going to react to the next El Nino or do you think such events are gone for good? (Look at past records for ENSO index for this).
Finally temperature trends are very noisy and that is why climate is defined on a 30 year trend. Less noisy is the OHC and to the oceans is where most heat is going. No sign of a pause in global warming there.
-
Tom Curtis at 09:30 AM on 24 January 2014Global warming theory isn't falsifiable
jacklongley @1, falsifiability is a strange concept of limited use in science, despite its popularity. The reason is that when we test any hypothesis, we must make background assumptions both about other conditions, and about how our instruments work. These background assumptions then form auxilliary hypotheses which are tested alongside the hypothesis we actually desire to test. As a consequence, if our test gives a negative result, we do not falsify any individual hypothesis (including the one we wanted to test). Rather we falsify the conjunction of the hypotheses. We show that not all of them can be true together. This is known as the Duhem-Quine Thesis, after its two independent "discoverers".
To illustrate this, consider Dikran Marsupial's test of "global climate change theories" from 2 above. He claims that a centenial negative trend in temperatures would falsify the theory. Of course, if that centenial trend coincided with a 50% reduction of solar physics, the theory would not be falsified. Dikran is quite aware of this, and covered himself with the auxilliary clause that the trend occured "in the absence of any other change in the forcings that could explain it".
In very simple theories, we can radically reduce the number of auxilliary hypotheses making the particular hypothesis of interest more amenable to falsification in a "crucial test". We can also vary our experimental methods so that we are testing the theory with different auxilliary hypotheses. Thus, for very simple hypotheses, we can reduce the impact of the Duhem-Quine Thesis, but we can never entirely avoid it.
Because AGW is a complex theory with many auxilliary hypotheses, it is difficult to develop "crucial tests", ie, any individual test that will show it to be false. In fact, in the very short term it is impossible. What we can do is develop "crucial tests" for important elements of the theory, but not for the whole theory at once. We can also measure relative likilihood with respect to competing theories. Doing so, we can show that AGW easilly is a superior theory to its competitors. But we cannot pick a single experiment to falsify the theory, so you will not find much discussion of falsification with respect to AGW.
When you do, it is often for critics of AGW who take a farcically simplistic view of falsification to declare that "AGW is falsified". Spencer and Christy played this game for a while, declaring the UAH satellite temperature index falsified AGW. Then (on several occasions) they were embarrassed when it was shown that their auxilliary hypothesis that they had eliminated all significant errors from their temperature record was what was false, and that UAH tends to confirm rather than falsify AGW.
Lucia Liljegren has played a similar game, several times declaring that the recent temperature record falsifies IPCC predictions. She has neglected, however, the IPCC auxilliary hypothesis of neutral ENSO conditions*. She has merely falsified the conjunction of hypotheses that (CO2 forcing is increasing & climate sensitivity is in the IPCC range & ENSO fluctuations do not effect global temperatures & ....). As her third, tacit, auxilliary hypothesis is known to be false, her results are massively uninteresting. (She also uses a very simplistic definition of falsification in which events with a 1in 20 probability of occuring in a theory are supposed to falify the theory; something Popper would have considered ludicrous.)
Despite the limitations of the Duhem-Quine Thesis, it is possible to extend the emperical content of theories, and the climate science community is doing just that with the theory of AGW. They are going to extraordinary lengths to do so. Because of the complexity of climate science, in some areas that is difficult and slow going. It is very noticable, however, that it is the people rejecting AGW, the Republicans in the US, the Harper government in Canada, who are defunding research. They are so confident in their position, it appears, that they dare not put it to empirical test.
There is a lot more that could be said on this very interesting subject, but I am out of time, and this post is long enough as is. I'll respond later if you want to explore the subject further.
(* The IPCC auxilliary hypothesis is not that ENSO does not effect temperatures, but that ENSO fluctuations cannot be predicted except in the very short term, and so cannot be included in IPCC projections. That does mean that IPCC predictions in the short term cannot be properly tested unless the effect of ENSO is removed from the temperature record. Lucia does not do that, thereby assuming as a tacit auxilliary hypothesis that ENSO does not effect global temperatures.)
-
It’s all a Question of Balance
Excellent summary of the basics, Glenn. This is really what the disruption of the climate boils down to. Your conclusion is pretty much the same as James Hansen’s when he wrote that the global energy imbalance gives us the most fundamental information about the state of the Earth’s climate.
I’ve tried to come up with different ways of visualising this. The four Hiroshima bombs per second (almost five if the imbalance is 0.6 watt/m²) should be well-known by SkS readers, but there are less destructive but still very striking ways this energy could impact us.
Imagine that all this energy (300 trillion watts in total if 0.6 watt/m²) is focused on melting ice. If the temperature of the ice is -10°C, then heating it to 0°C will require 21 Joule/gram, and then we need additional 334 Joule/gram to melt it, or 355 Joule/gram in total.
That should translate to 73 gigatons or about 80 cubic kilometres of melted ice every day, or a gigantic ice cube with sides measuring 4.3 kilometres! That ice cube would be almost as tall and have roughly three times the volume of the famous mountain Matterhorn in the Alps. And the flow of melt water from all that ice (845.000 cubic metres per second) would equal the discharge of four Amazon rivers!
Just an alternative to the four or five Hiroshima bombs! Maybe someone could make an illustration based on this idea?
-
franklefkin at 09:02 AM on 24 January 2014Three perfect grade debunkings of climate misinformation
Tom Curtis,
Warren had asked about satellite measurements. You cherry picked UAH instead of RSS. His (Warren's) question was about 17 years, so he picked the time frame.
Since you dismissed his question by stating it was false, I just pointed out it was actually correct. You may be (most likely are) correct about the deficeincies of RSS, but the question asked was about the satellite records, not about a highly accurate satellite record.
Prev 774 775 776 777 778 779 780 781 782 783 784 785 786 787 788 789 Next


