


 Arguments


Recent Comments
Prev 800 801 802 803 804 805 806 807 808 809 810 811 812 813 814 815 Next
Comments 40351 to 40400:
-
chriskoz at 18:46 PM on 28 November 20134 Hiroshima bombs per second: a widget to raise awareness about global warming
I have a simple question which I guess should go to Bob,
SkS and Guardian setup the widget to count from 1998.
However some other blogs e.g. this one managed to set the count from 1970. I cannot find the UI settings to change that parameter. Where is the setting for the starting year and can you set it to any year of your choice? Then, how does the widget calculate the baseline #HBs to start counting from? Based on the heat uptake history from some known publication, e.g. Nuccitelli 2012?
Moderator Response:[Bob] Any host can choose any start date (starting from 1970) when they configure the widget for their own web site or blog.
-
macoles at 17:24 PM on 28 November 2013Climate Bet for Charity, 2013 Update
Am I misunderstanding something?
The bet is that the absolute 2011-2020 decade average will be warmer than the 2001-2011 decade average. The graph is showing the derivative of the decades (progressively averaged to date). The bet isn't will 2020's decadal warming rate be higher than 2010's warming rate.
Unless January 2001 has the exact same absolute temp as January 2011 then ploting the warming rates side by side isn't going to tell you much.
-
scaddenp at 16:53 PM on 28 November 20134 Hiroshima bombs per second: a widget to raise awareness about global warming
Okay, earth retains heat, but in practical terms the effect is that surface radiation is increased. Elsewhere ("its not bad"), is probably best place to discuss this but I would contend that your belief that this much energy doesnt matter is completely uninformed by science. Sealevel rise doesnt matter? Or by what have you convinced yourself that Dai doesnt matter?
-
jyyh at 15:40 PM on 28 November 2013Will extreme weather like super typhoon Haiyan become the new norm?
I'm getting 180-190 mph limit for category 6 here, http://erimaassa.blogspot.fi/2013/11/haiyan-scale.html
I think there is a need for a consistent scale of above 11 beauforts, since i think the ocean water-atmosphere exchange should increase even though the height of the waves do not. Do stronger hurricanes produce saltier rain than the lesser ones? In the grand scheme of things this likely isn't very notable effect but locally it might be, not to talk anything about the devastation caused by the tropical cyclone itself. My 6$ isn't much but it should be enough for some water proof cloth for a shelter or rain water collection. on B.Gates income that would be some 10M$, and he does a lot of charity, but every little bit may help.
-
Tom Curtis at 15:19 PM on 28 November 20134 Hiroshima bombs per second: a widget to raise awareness about global warming
chriskoz @15, that is a very narrow definition of harm. Never-the-less you raise a valid point. Not all harm comes from the flows of energy per se, and therefore the inverse of entropy is a limited measure of potential harm. Life, for instance, is not just a heat engine, but also a complex set of chemical reactions in solution. As a result temperatures significantly below freezing, by freezing the solvent (ie, the liquid in which the chemicals are dissolved) prevents the continuation of life. As a result, a massive loss of energy from the Earth's surface as in a glaciation, is also harmful.
Never-the-less, to the extent the gain of energy is harmfull, it is largely due to the loss of entropy with that gain. And given the destructive nature of the units in the widget - atomic bombs, hurricanes, earthquakes, lighting strikes, 6,900 tonnes of dynamite (a Big Ben full) - are all destructive, there is no question that the widget emphasizes the destructive nature of the energy. It does so regardless of the intentions of the creators of the widget simply because of the chosen units. And given that, the issue of entropy is central as to wether the widget, in an attempt to communicate one part of the science very clearly inadvertently misleads on another.
In passing, by the way, I think you seriously underestimate the destructiveness continuing high frequency rain of nuclear weapons. A rain of atomic bombs at 4 per second means that everywhere on Earth, on average falls within the area of total destruction from an arial blast twice a year. Continued over a century (the minimum time frame for potential ocean anoxia) that would certainly exterminate all surface life. If bombs falling over the ocean detonated at 250 meters depth (or the bottom, whichever is deeper), it would also exterminate most ocean life, including all corals. In all, it would release 40,000 times the energy of a total nuclear exchange (at slightly higher entropy). It would only avoid ocean anoxia because it would create a nuclear winter sufficient to bring back, in all probability, snow ball Earth.
-
Terranova at 14:40 PM on 28 November 20134 Hiroshima bombs per second: a widget to raise awareness about global warming
scaddenp @ 18
The earth does not receive extra energy due to GHGs, but it does retain energy due to GHGs. But, no, at this point I do not find it neither scary, nor much less worrisome. And, the Stern Report is frought with issues that need to be addressed before it can be taken seriously.
-
Tom Curtis at 14:23 PM on 28 November 2013Climate Bet for Charity, 2013 Update
Rob, a small point. You say that the losers money will be donated to "a charity of the winner's choice". In contrast, Pierre Gosselin writes:
"As mentioned above, the charity organisation is yet to be chosen, but will (1) be one that both sides agree on, (2) help children in dire need (3) have low overhead and (4) be international."
You may wish to clarrify that point.
Further, who counts as a winner? Specifically, as denier bets are only a fraction of pro-science bets:
1) do all pro-science pledgers cound as winners (should they win), with loser bets assigned pro-rata?
2) Or is it first come, first served, with bets paired of based on time of reciept so that later betting pro-science winners are not counted as winners?
3) Or is it just handled en masse, with choice of charity decided by a committee,
4) or by the two principles (you and Pierre)?
Or is some other method used.
Further, will the "warmer" side only pay an amount equal to the "cooler" sides commitments in the event that the temperatures are cooler? Pierre seems to indicates as such. If so that makes the former question even more consequential, for with choices (1), (3) and (4) those betting for warmer will only need to pay a fraction of their commitment. In the case of (2), early betters will pay their full commitment, but late comers will not need to pay (if betting stays as it is).
The upshot is that only if Pierre is right about the paltry betting by "coolists" limiting the commitment of "warmists"; and further only if method (2) is used, does he have reasonable grounds for nolonger taking "warmist" bets. In all other cases, his refusal to take more bets looks like an attempt to limit the embarassment of "coolists" from their lack of conviction in their beliefs.
-
Terranova at 14:18 PM on 28 November 20134 Hiroshima bombs per second: a widget to raise awareness about global warming
Add an option to that widget that shows the known human contribution in percentage to "heat" gained.
-
scaddenp at 14:15 PM on 28 November 20134 Hiroshima bombs per second: a widget to raise awareness about global warming
you are entitled to your opinion, but are you also claiming that the extra energy being received by earth as a result of increased GHG is not scary? What do you think of the numbers in the Stern report?
-
Terranova at 14:05 PM on 28 November 20134 Hiroshima bombs per second: a widget to raise awareness about global warming
TC @ 14
That was well written.
Cook and Lacatena,
I do not like the Hiroshima bomb connection. I am convinced it is meant to create a state of fear within the ignorant. This only leads to further divisiveness amongst the very people you should wish to make think about what is happening in the natural world. The math to compare the energy generated by an atomic bomb in a localized area to the energy received by the Earth from the sun every second of every day is not that difficult, and not at all that scary to someone with a working science background.
-
mrkt at 10:43 AM on 28 November 2013Climate Bet for Charity, 2013 Update
Just a small point - your current 'decadal running average' should run October 2003 through September 2013 (rather than October 2004) to cover a full 10 years.
P.S. I truly appreciate all the work done by the contributors to this site.
-
barry1487 at 10:37 AM on 28 November 2013Climate Bet for Charity, 2013 Update
Rob... although bets are closed, I posted just now to encourage Pierre to reopen them til 2015, to reap as much money for charity as reasonably possible. I made a $100 bet for a warmer decade. By his reckoning, reading the last comment there, I'm backing a losing proposition. Maybe he'll take me up :-)
-
Rob Honeycutt at 10:02 AM on 28 November 2013Climate Bet for Charity, 2013 Update
barry... I'm assuming we will look at how the numbers look at the end of the decade. At that point, what was the 2001-2010 average might have been adjusted one way or the other. I would assume the most recent data at that time would be the most accurate.
I don't think it's going to be a problem either way. I think the end result will be the same. The latter part of this decade is likely to see some significant El Nino action, and with that a large change in surface temps that will bring the trend up to something close to the longer term trend.
Again, the only caveat might be a major low latitude volcanic event.
-
barry1487 at 08:38 AM on 28 November 2013Climate Bet for Charity, 2013 Update
"Just to clean things up a little, here is how I would suggest is the most accurate way to track the bet. The 2001-2010 decadal average is set in stone."
Does this apply if both records are adjusted in the future such that the 2001 - 2010 values change?
-
Rob Honeycutt at 07:10 AM on 28 November 2013Climate Bet for Charity, 2013 Update
Composer99... I'm actually more pessimistic about that potential. If this decade doesn't show warming in the surface temperature record, that is more likely to mean that the next decade will show an even more rapid rise in temps. And, in the meantime, that means that we'll see even more delay in taking action to reduce FF consumption.
I'm actually quite confident that we'll see a rise in surface temps by the end of the decade. It's not much of a risk, IMO, when you're betting on the side of basic physics.
-
Composer99 at 06:05 AM on 28 November 2013Climate Bet for Charity, 2013 Update
Arguably, if this decade ends up not being as warm - surface temperature wise - as the last decade, we all win.
-
william5331 at 04:17 AM on 28 November 20132013 SkS News Bulletin #18: Warsaw Climate Talks
As usual, the solution is blindingly obvious and painfully simple.
Adopt Jim Hansen's Climate Change Solution, namely tax and dividend. This will remove investment from fossil fuels and direct it toward renewables as investors try to avoid a hair cut that would be inevitable if they stuck with their fossil fuel shares. Long before there was price parity for electricity generated by FOS vs REN, investment would shift. With the increased competition to get a share of the REN market, as we mounted the learning and volume curves, prices would drop for Renewable energy. Soon coal, oil and gas would be feed stocks for industry and as such would last for thousands of years instead of tens of years. The Keling curve would switch from 8 up and 6 down each year to 6 up and 8 down. How do you overcome vested interests, though. Read the book on the hockey stick by Mann to see what lengths these venal old men are willing to go to to scupper any reduction in their ill gotten gains. The first step is to have the tax payer fund election campaigns and outlaw any corporate contributions. Sound expensive??? It would be a drop in the bucket compared to what this corrupt system is costing and will cost in the future.
-
John Hartz at 01:27 AM on 28 November 20132013 SkS Weekly Digest #41
@ W P Sokeland:
What type of article do you wish to post? Is it a news article? An original article written by you?
-
JasonB at 00:37 AM on 28 November 20134 Hiroshima bombs per second: a widget to raise awareness about global warming
Tom@14,
Here's an interesting statistic. Global warming is causing the Earth's surface to accumulate energy (heat) at 248 times the rate at which the total human population is consuming food energy. Put another way, global warming is storing 4.14 minutes worth of the total human food energy consumption every second. That is an impressive figure. But does it scare you?
Actually, I think that's an excellent comparison. Thinking about it like that made me go "Wow!". Perhaps that could be added to the widget as well. (Another one: the Earth is accumulating energy at a rate 15 times the total rate used by all of human civilisation combined.)
But I think "scare" is misplaced. In the Catalyst example I showed, the host wasn't trying to scare anybody, she was trying to help conceptualise the enormous quantity of energy involved. I also don't share your concerns with comparing high-entropy energy with low-entropy energy — nobody is seriously going to look out their window and wonder where all the mushroom clouds are, are they? Is anybody actually going to mistake one for the other?
The planet is accumulating heat at a rate of 0.5 W/m2 over the entire surface area of the earth. But the surface area of the Earth is very hard to visualise, so it's natural to try to scale down that area to something that you have a hope of visualising. But any attempt to do that will necessarily lead to the problem you describe. What is better? Describe the rate of accumulation averaged over an area too large to visualise, or averaged over an area that gives you a chance of visualising it? I quite liked all of the different representations, as well as yours, because it helps to put it into perspective. But if changing the entropy is not allowed, then we're stuck with 0.5 W/m2 over the entire surface area of the earth, which I don't find much easier to grasp than "2.5x10¹⁴ Watts". Seriously, how do you envisage 2.5x10¹⁴ Watts without putting it terms of something you're familiar with? And how do you do that without running afoul of your entropy concern?
-
jzk at 00:37 AM on 28 November 2013Oceans heating up faster now than in the past 10,000 years, says new study
CB @4,
The abstract does not mention the global nature of the cited periods, but the editor's summary does:
"Rosenthal et al. (p. 617) present a temperature record of western equatorial Pacific subsurface and intermediate water masses over the past 10,000 years that shows that heat content varied in step with both northern and southern high-latitude oceans. The findings support the view that the Holocene Thermal Maximum, the Medieval Warm Period, and the Little Ice Age were global events, and they provide a long-term perspective for evaluating the role of ocean heat content in various warming scenarios for the future."
-
wpsokeland at 00:01 AM on 28 November 20132013 SkS Weekly Digest #41
John Hartz,
I have an article I would like to post. Please send me an email address where I can send it to you for your approval.
Thanks, W P Sokeland
-
martin3818 at 23:38 PM on 27 November 2013Book Review: Global warming and oceans, a 21st century perspective
... and it costs 150 US$ !!!
It does sound fascinating and should you be willing to pass on your free review book, I would be very interested.
-
mspelto at 23:13 PM on 27 November 2013No, Greenland Wasn't Green
The statement "So not only was Greenland already mostly covered in ice when Europeans settled there" is too vague. There is literature that can quantify this much better indicating the maximum retreat in the Holocene was before 4000 BP and the margin retreat was on the order of 10-15 km, which compared to the whole ice sheet width is quite small indeed.
http://www.sciencedirect.com/science/article/pii/S0031018212800101
http://www.sciencedirect.com/science/article/pii/S0277379112004209
http://www.glyfac.buffalo.edu/Faculty/briner/buf/pubs/Briner_et_al_2010.pdf
-
chriskoz at 22:45 PM on 27 November 2013No, Greenland Wasn't Green
Glenn@5,
...he was a Property Developer
Doe you have a reference to that? Half joking, half seriously, I've heard all sorts of stories who he was (warrior, killer, outcast) but this one looks as your invention unless you prove otherwise...
-
chriskoz at 22:24 PM on 27 November 20134 Hiroshima bombs per second: a widget to raise awareness about global warming
Tom@14,
Your closing comment "its [decreased Earth's overall entropy harm] is far less than suggested by the atomic bomb analogy" is highly subjective and depends on the definition of "harm".
I can define harm as: "destructions of entire ecosystems, e.g. from phytoplankton decline and ocean anoxia" which is quite possible scenario in BAU, similar to that experienced by Earth in PETM. With such definition of harm, I argue that 4HB/s fired sequentially and evenly in round robin fasion over land surface would not be hamful to ocean ecosystems at all. Therefore your comment is wrong.
But that's not my point here. My point is that while I agree with you in general, I note that in your closing comment you're comparing the "harm" of high and low entropy events, which is not comparable per se without context, according to your own discourse above. Therefore you are contradicting yourself here.
Personally, I think the HB analogy is directed at non-scientists, therefore its scientific accuracy is not important here. It's meant to say: "have you realised, this is a lot of heat? If not you'd better learn more about it". As such, it is less "scary" than my example above.
-
Kit at 21:54 PM on 27 November 2013A Miss by Myles: Why Professor Allen is wrong to think carbon capture and storage will solve the climate crisis
Ha, I'll be sure to mention you next time I see him! Apologies, though, I assumed you had access to the journals - happy to forward you a copy if you're interested.
As with anything, the degree of actual risk involved depends on the measures put in place to mitigate that risk. Perceived risk is about how that actual risk is communicated. The public (in the UK anyway) are against fracking because the perceived risk is high, primarily because of the stories coming out of the USA of contaminated drinking water. In this instance, because of light regulations in the US, fracking *has* been a high risk activity. The industry effectively got up to full-steam before any environmental impact research was carried out, and that is only now beginning to catch up. CCS would be different (one hopes!), since the research is ongoing before an industry establishes itself and will inform regulators and operators of the requirements to avoid and mitigate.
Fracking also has a hard sell because it is a deliberate fracturing of the rock, whereas the last thing you want when you're storing CO2 is to do anything of the sort! Fracking is therefore inherently risky at the start of a project, particuarly if the subsurface geology is not well characterised. CCS projects, on the other hand, are designed to be 'safe' because any leakage goes against the aim of the project, and there would likely be stiff penalties for allowing CO2 to escape - the framework for this is already in place in the EU under the CCS Directive, I believe. Therefore, confidence should be high that CO2 storage is a safe thing to do. Pressure maintenance is, of course, an issue and actually forms part of the basis for my PhD. Pressure can be relieved or maintained at a level that will/should not induce any/significant siesmicity (through water production, say) and once the injection wells are shut off then pressure will dissipate through time as CO2 dissolves into the water, mineralises, and migrates laterally in the subsurface. Careful also about scale - hydrocarbon fields are only a fraction of the size of the formations intended for CO2 storage.
However, as you say, the public equate fracking and CCS as the same thing. Communicating that they are different, with different levels of risk is clearly a challenge. In the UK, CO2 storage will be offshore, so less of an issue here but there is already opposition to it in parts of Europe unfortunately!
-
Dikran Marsupial at 20:01 PM on 27 November 2013Global warming since 1997 more than twice as fast as previously estimated, new study shows
SASM, note section 2.2 of that paper investigates ocean circulation, which is the main difference between the Arctic and Antarctic that I mentioned. Even if the greenhouse effect has the same direct effect on both poles, you still need to consider the transport of heat around the globe. If there was no transport of heat by ocean and atmospheric circulation there would be no need to make climate models (GCM stands for General Circulation Model).
As I also pointed out, CO2 is not the only forcing that affects global and regional temperatures, so to expect a simple relationship between CO2 and temperature (especially over short timescales less than 30 years or so) is unreasonable.
The really big point that was missing from my answer to your question was of course ice-albedo feedback. Any summer melting of sea ice in the Arctic exposes dark ocean water, which absorbs far more sunlight than the bright ice that is now gone, so any warming there tends to be amplified.
-
scaddenp at 18:50 PM on 27 November 2013Global warming since 1997 more than twice as fast as previously estimated, new study shows
SASM - your paper is complimentary. It looks at why Antarctica is colder than the Arctic. You will find similar papers over in the "Antarctica is gaining ice", No 10 of popular myths. The paper I stumbled on at looks at the role of the ACC in why SSTs are different between hemispheres under the same forcings which I thought was closer to your question.
-
Glenn Tamblyn at 17:57 PM on 27 November 2013No, Greenland Wasn't Green
"men will desire much the more to go there if the land has a good name"
Yeah. Lets never forget he was a Property Developer
-
Tom Curtis at 16:12 PM on 27 November 20134 Hiroshima bombs per second: a widget to raise awareness about global warming
Here's an interesting statistic. Global warming is causing the Earth's surface to accumulate energy (heat) at 248 times the rate at which the total human population is consuming food energy. Put another way, global warming is storing 4.14 minutes worth of the total human food energy consumption every second. That is an impressive figure. But does it scare you? Probably not. The reason is that human food consumption is a difuse energy. Because it is scattered across all continents, and over seven billion people, it is not concentrated enough to do harm. It has high entropy.
In that respect, the energy accumulation due to global warming is more like food consumption, and less like atomic bombs (or hurricanes, or earthquakes). Indeed, the energy accumulating from global warming has a much higher entropy than that found in food. Atomic bombs have very low entropy. As a result, the energy in atomic bombs are capable of doing a lot of work, by rearranging buildings, cars, bridges, and humans. An equivalent amount of energy with very low entropy would not do the same damage.
To illustrate this, consider that the kinetic energy of the first kilometer of the Earth's atmosphere is approximately 7.1*1022 Joules, or about 1 billion atomic bombs. That is two atomic bombs per square kilometer of the Earth's surface. That does not trouble us for the energy is diffuse and disorganized. It has very low entropy. Where the energy gathered into a pinpoint and then allowed to expand outwards in all directions, it would be as devestating as an atomic bomb. But because it is diffuse it is no more dangerous than a summer breeze.
That is the difference between low entropy and high entropy energy - and the energy accumulated at the surface of the Earth has very high entropy. That is why the widget is scientifically misleading. It compares very high entropy energy to very low entropy energy. Without explanation, casual observers (the people at whom the widget are aimed) will assume the energy accumulated also has the properties of all its comparators, ie, the raw destructive power from the very low entropy. However it does not. A moments thought shows that it does not have the destructive force of a billion atomic bombs rained down on the Earth's surface per decade. And people who have that thought will feel misled by the analogies used.
Finally, although the energy accumulating at the Earth's surface is high entropy, never the less it is decreasing the Earth's overall entropy. It is not harmless. Very far from it. But its harm will be played out over decades and is far less than suggested by the atomic bomb analogy.
-
One Planet Only Forever at 16:01 PM on 27 November 2013Carbon Emissions on Tragic Trajectory
Replying to SkepticalinCanada @12,
I am also a Canadian. Unfortunately, Canada is a collective, and has not had enough collective popular support for the 'giving up of opportunity to benefit from unsustainable and adamaging pursuits that can be gotten away with', to get leadership that leads all of the population toward development of a sustaianble better future for all.
Individual action is important, but keeping 'those who do not care' from getting away with 'what they wish to be free to do', is what is required. The leadership of Canada has never meaningfuly forced the required change of attitude on that uncaring part of the Canadian population ... so 'Canada' does not care.
-
John Hartz at 15:17 PM on 27 November 2013Global warming since 1997 more than twice as fast as previously estimated, new study shows
StealthAircraftSoftwareModeler:
The curent and operative SkS Comments Policy can be accessed by clicking on the "Updated Comments Policy" link found immediately above the Comment edit box and below the "Post a Comment" header.
You will be better able to interact with SkS authors and readers on this comment thread if you focus your comment on specific issue and do not engage in polemics. Having said that, dialoguing on comment threads on SkS and other websites may not be the best way for you to learn about climate science. There are other options such as signing up for an oline course or reading a textbook on the subject.
-
StealthAircraftSoftwareModeler at 14:33 PM on 27 November 2013Global warming since 1997 more than twice as fast as previously estimated, new study shows
Scaddenp @75. I took a quick look at the abstract (all I can read) and this looks interesting and seems to support what you and Dikran were saying. Thanks for digging it up for me. I’ve done some searching and found this: LINK. This proposes a different mechanism than the paper you found.
Moderator Response:[RH] Hotlinked URL that was breaking page format.
-
StealthAircraftSoftwareModeler at 14:10 PM on 27 November 2013Global warming since 1997 more than twice as fast as previously estimated, new study shows
Opps. Cut and paste error. Delete the redundant second paragraph in 76.
-
StealthAircraftSoftwareModeler at 14:08 PM on 27 November 2013Global warming since 1997 more than twice as fast as previously estimated, new study shows
John Hartz @74: I am really trying hard to get this. I’ve gone and read several different Comment Policies in SkS, one from John Cook back in Nov 10, 2009 and one that I found in the article about the Dunning-Kruger effect. For the record, I don’t see a link to the Comment Policy from the main menu links and one must search for it. Between reading these policies, and examining my posts, I think I may have figured out the secret decoder ring of what you call sloganeering. I’ll try harder in the future to avoid it.
Moderator Response:[JH] Repeated text deleted per author's request.
-
scaddenp at 14:04 PM on 27 November 2013Global warming since 1997 more than twice as fast as previously estimated, new study shows
On an other track completely, I found this paper ("Interhemispheric asymmetry in transient global warming: The role of Drake Passage") on why models end up with interhemispheric assymetry in warming. The writers note the attribution to land-ocean differences between the hemispheres and Arctic sea ice melt, but also point out the role of the Antarctica Circumpolar Current in isolating Antarctica by running the models with and without a landbridge across the Drake Passage.
-
Andy Skuce at 11:53 AM on 27 November 2013A Miss by Myles: Why Professor Allen is wrong to think carbon capture and storage will solve the climate crisis
Kit, thanks for your comment and I would refer readers here to Kit's blog VitaminCCS (good name!) which appears to be a useful resource on CCS (and say hello to Stuart Haszeldine for me, the last time we met was in a pub in Glasgow some 33 years ago).
Unfortunately, I can't comment on the paper you linked to because it is paywalled (at a cost of $35), but from your description of it, I don't doubt that the Duke paper we cited may well have unresolved uncertainties over natural baselining. Many of the disputes about methane and other contamination of aquifers due to fracking have similar problems. I do think that many of the contamination reports in movies like "Gasland" are exaggerated. But not all of them are. For example, a recent paper by Jackson et al looks very convincing to me.
Even if the aquifer contamination hazards of fracking and CCS are shown to be low, public opinion is likely to take some convincing. The difficulty that gas production companies have had in starting exploration projects in France, England, Quebec and New Brunswick are bellwethers of what CCS projects can expect in the future. Let's not forget that the quantities of water that are injected in fracking operations, although large, are much smaller than the liquefied gas amounts in CO2 sequestration projects. The injections of frack fluid are also short term to fracture the reservoir, after that the focus is on withdrawing fluid from the subsurface layer, reducing pore pressures as the gas is produced. In contrast CCS projects will continue to inject huge quantities of fluid over time, raising or maintaining pore pressures.
This will lead not only to a higher propensity to leak or flow into other geological layers, but also a larger tendency to trigger earthquakes, because pore pressures will be elevated for longer. It may well be the case that most CCS sites will not leak much CO2 back to the atmosphere, but actual and perceived risks of CCS projects will be greater, I think, than for fracking projects, especially at the massive scale that is required of CCS to make a dent on global GHG emissions.
-
Kit at 10:37 AM on 27 November 2013A Miss by Myles: Why Professor Allen is wrong to think carbon capture and storage will solve the climate crisis
Andy, RE: Hazards, be careful of the conclusions of the Duke paper on potential environmental impacts of CO2 on shallow aquifers by Little and Jackson. See comments made by Gilfillan and Haszeldine here: http://pubs.acs.org/doi/abs/10.1021/es104307h Specifically, they concluded that CO2 could elevate concentrations of metals above USEPA guidelines in the aquifers studied, failing to stress that natural concentrations in these aquifers already exceeded the USEPA values, and secondly that in several cases metal concentrations were lower aith reaction with CO2, but they chose not to highlight this. Much research has been done in this area, and is ongoing, and most of it concludes that there is a overall lack of concern with regard to "contaminating" water supplies.
In any event, while the risk of CO2 leaking is definitely there, it is very unlikely that leakage would actually occur in the vast majority of storage projects. Four mechanisms are employed in a typical storage site (residual, stratigraphic, solution and mineral trapping) to ensure CO2 is permanently locked away. Public opinion is strongly against CO2 storage where the risks are poorly communicated, and I think your section on "Hazards" could be improved to communicate that the risks are nothing like what you are implying. Perhaps I have read it wrong, but given this is my area of specialty in CCS, if it doesn't read right to me, then Joe Public isn't likely to find comfort in it either!
-
nigelj at 10:17 AM on 27 November 2013No, Greenland Wasn't Green
The vikings saw a few green coastal areas, but obviously not the interior and its vast scope. The term greenland was wishful thinking, or ignorance, or a marketing ploy to attract people.
What caused the medieval warm period of europe? Presumably it could happen again, and seems to have had a reasonably rapid onset. Imagine if this was overlaid over human induced warming. This could have unpredictable and unwanted consequences to say the least.
-
Tom Curtis at 07:43 AM on 27 November 2013No, Greenland Wasn't Green
There is already extensive discussion of the Viking settlement of Greenland in comments here, and especially here, starting with the comments of Spoonieduck and leading on to extensive rebutals. Sufise it to say that the evidence supports the claims that:
- At the time of Norse settlement, as now, Greenland was less green (verdant) than either Iceland or Norway, so the name "Greenland" had a substantial marketing element, as noted in the saga.
- Greenland in limited areas then, as now, could support a small scale pastural industry, with some growth of vegetables and grains in gardens.
- Despite this, the settlements could not survive without extensive fishing and sealing, some of the products of which were traded to Iceland and Norway for grain, grain products (beer) and wood.
- Evidence from Norse settlement does not support claims that Greenland was warmer in the MWP than in the current decade, although due to some Norse harbours being bound by ice until recently, it was warmer than in the mid twentieth century.
As a minor point, the blog above appears to have already replaced the former content at the first link in my post (as is intended), but the update information has not been updated.
-
Slioch at 07:15 AM on 27 November 2013No, Greenland Wasn't Green
The history of the Greenland settlements is described in some detail in chapters 7&8, pages 211-276 of Jared Diamond's book 'Collapse - How societies choose to fail or succeed' published 2005 by Penguin.
Diamond states that:
"According to the sagas and medieval histories, around the year 980 a hot-blooded Norwegian known as Eric the Red was charged with murder and forced to leave for Iceland, where he soon killed a few more people and was chased out to another part of Iceland. Having ended up, there too, in a quarrel and killed still more people, he was this time exiled entirely from Iceland for three years ...
... Eric ... spent the next three years exploring much of the Greenland coast, and discovered good pastureland inside the deep fiords. On his return to Iceland he lost yet another fight, impelling him to lead a fleet of 25 ships to settle the newly explored land that he shrewdly named Greenland."
-
meb58 at 06:49 AM on 27 November 20134 Hiroshima bombs per second: a widget to raise awareness about global warming
...and all of earth's systems seem to be connected via rubber bands; each in synchronous tension...until, when a few very important rubber bands become stretched to their yield point! Snap! Letting the huge wound up flywheel spin out of control.
Apologies for the non-scientific perspectives.
-
jdixon1980 at 03:29 AM on 27 November 20134 Hiroshima bombs per second: a widget to raise awareness about global warming
meb58 @11 "huge metal disk" is itself a famous metaphor for climatic inertia; see the 1979 "Charney Report":
"[T]he ocean, the great and ponderous flywheel of the global climate system, may be expected to slow the course of observable climatic change. A wait-and-see policy may mean waiting until it is too late."
http://www.skepticalscience.com/nrc-report-on-ocean-heat.html
-
meb58 at 01:43 AM on 27 November 20134 Hiroshima bombs per second: a widget to raise awareness about global warming
I am an avid reader here, though I rarely comment...I'm not a scientist per se. But one of the comments above really caught my attention with regard to the 4 hiroshima bombs; that the scale of eath's systems can absorb this kind of heat - with consequences of course. The eye openner here is analogoous to spinning a huge metal disk...it takes an awful lot of energy to get it going but once in motion watch out. This makes me think that even the most current radical measures to reduce warming won't be enough to slow warming...?
-
JasonB at 01:32 AM on 27 November 20134 Hiroshima bombs per second: a widget to raise awareness about global warming
As I mentioned on another blog recently, there is another precedent for the Hiroshima as a unit of energy that appeared on our national broadcaster a month before the original discussion: YouTube
At the 9:50 mark, the host says:
With such a huge area alight, a massive amount of energy was released into the atmosphere.
In fact, in the peak 10 minutes of flaming, more energy was released than the Hiroshima atomic bomb.
The reason is because people have an idea of what an atomic bomb looks like. We’ve all seen footage of them on TV, and pictures of the devastation they caused. We have some idea of the awesome amount of energy involved. And equating ten minutes of that fire to one Hiroshima atomic bomb emphasises just how big that fire was.
So Australia’s national broadcaster had already, without fuss, used the Hiroshima atomic bomb as a unit of energy to try to help people conceptualise something that is inherently hard to grasp.
For some reason my comment on that blog post about this prior art was ignored. Instead now there are additional comments relating to this widget and stolen SkS forum messages. Go figure.
-
Magma at 00:37 AM on 27 November 2013No, Greenland Wasn't Green
From the 13th century Saga of Eric the Red (Eiríks saga rauða):
In the summer Eirik went to live in the land which he had discovered, and which he called Greenland, "Because," said he, "men will desire much the more to go there if the land has a good name."
-
Doc Snow at 00:06 AM on 27 November 2013Will extreme weather like super typhoon Haiyan become the new norm?
"(The possible exception is disasters in the US, which seem never to be the fault of the victim.)"
Just sayin', but there was an awful lot of blaming (or at least stigmatizing) the victims around Katrina. And of course the 'God's fury' loons came out of the woodwork for Sandy as well, New York being in their eyes a Sodom on the Hudson.
But (slightly closer to the topic at hand) I wonder about even the presumption that warnings lag greatly in all developing nations. For example, the Christian Science Monitor reported that:
www.csmonitor.com/World/Latest-News-Wires/2013/1113/Typhoon-Haiyan-Was-the-government-prepared
Moderator Response:[JH] Unnessecary white space deleted.
-
Kevin C at 20:24 PM on 26 November 2013Help make our coverage bias paper free and open-access
I've just asked the publisher for an update on the open access process. Hopefully I'll have more information tomorrow.
-
Ruurd Lof at 17:06 PM on 26 November 20134 Hiroshima bombs per second: a widget to raise awareness about global warming
@Dana1981 Thanks for the link to the original discussion. I missed that one.
-
Tom Curtis at 14:33 PM on 26 November 2013Most of the last 10,000 years were warmer
As noted above, I have overinterpreted the data available to me. This is always a risk when interpreting scientific data as a non-expert. In particular, not being expert I have not always read the range of scientific papers on a subject to put the particular papers on which I rely into context. In this case I accepted too readilly the data from Langen and Vinthner, (2009), or more properly, their webpage on that paper. Prompted by Foster/Wright above, I have since looked at a greater range of the literature and found a significantly more southerly source of Greenland precipitation in most papers (again without claiming an exhaustive search, so I may be missing something. There are three key papers in this reassessment.
1) Johnsen et al (1998) find that most of Greenland precipitation, particularly on the west coast comes from "the subtropical part of the North Atlantic Ocean", with the best modelled results with an assumed source close to weather ship E (Echo), ie, just north of the Mid Latitude High:

(Source)
2) Of particular interest in this discussion is Werner et al (2001), which examines source water for precipitation in both Greenland and Antarctica. The find the only overlapping source for Summit at Greenland, and Vostok in Antartica is the tropical Indopacific, which provides just 10% of Greenland's precipitation, but 44% of Vostoks. Polar Seas provide 15% of Greenlands moiture, and the North Altantic 28%. In all, 72% comes from the extratropical NH, and the remainder from the tropics, with none from the SH.

3) Also of interest is Sodemann et al (2008a), which discusses the sources of winter precipitation in Greenland. In particular, the examine the effect of the North Atlantic Oscillation (NAO) on the sources:
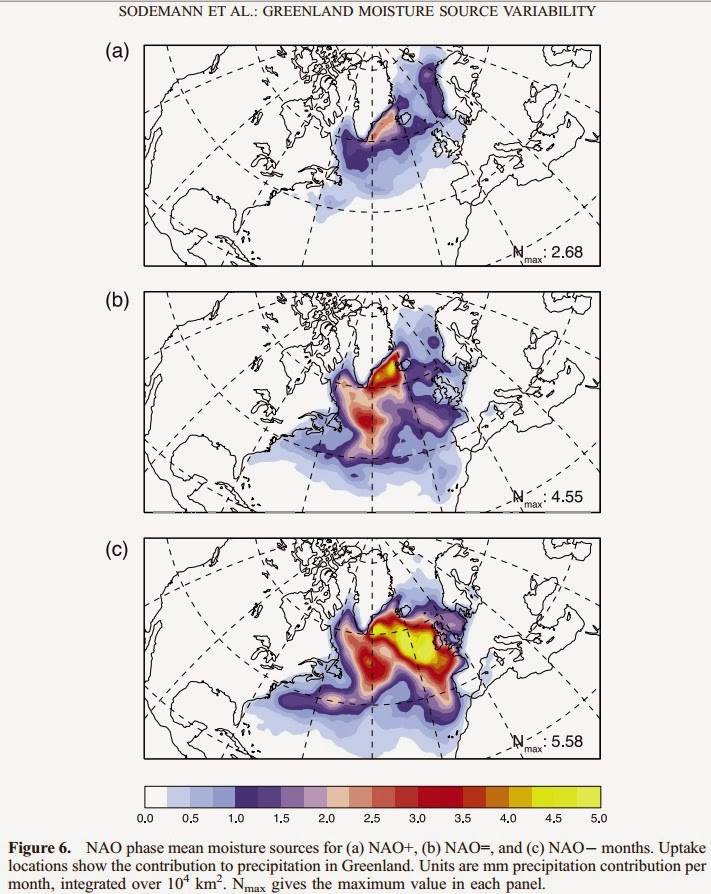
Again, the dominance of the North Atlantic as a source is evident; but so to is the large shift in source with a shift from postive to negative NAO.
Overall, a clear picture that most precipitation from Greenland comes from the extratropical North Atlantic and Polar seas. There is almost no moisture from the SH, and none from the SH extra-tropics. There is an almost complete divergence between sources for Greenland and Antarctic ice, showing that neither can be considered a global proxy. Further, Greenland ice shows a significant shift in source based on dominant weather states (NAO) making it even less suitable as a global proxy.
So, while my over interpretation has lead to a clear error in relationshipt to the dominant source of Greenland precipitation by placing it to far north, it does not effect the conclusion that Greenland ice cores are a regional, not a hemispheric or global proxy. Curiously, the 44% contribution from tropical waters to the Vostok precipitation makes it, though clearly not a global proxy, a significantly better approximation than Greenland ice cores.
Prev 800 801 802 803 804 805 806 807 808 809 810 811 812 813 814 815 Next


