


 Arguments


Recent Comments
Prev 803 804 805 806 807 808 809 810 811 812 813 814 815 816 817 818 Next
Comments 40501 to 40550:
-
Kevin C at 17:32 PM on 17 November 2013The Other Bias
Penchant: The numbers are right. In our paper we also look at the effect of bias on the significance of the trends, which is maximised for 1997/1998. The suggestion that trends starting in 1997/1998 are most misleading is based on this result.
Lay people do seem to have an instinctive grasp of the idea that longer term trends carry more information, and so 'misleadingness' needs to be evaluated against this. Lacking a cognitive model of how people evaluate trend claims the 'impact on significance' metric was the best we could do.
-
Kevin C at 17:27 PM on 17 November 2013The Other Bias
WebHubbleTelescope:
There are two impacts of the HadSST3 corrections compared to earlier versions which only handled the 1942 discontinuity - the sharp correction in 1945, and the more gradual recent bias. In this article I mainly focus on the second.
I also managed to identify the post-war spike by the trivial method of comparing colocated coastal land and SST measurements. The results give a surprisingly good fit to the HadSST3 adjustments, barring a scale factor. The gradual change over the past couple of decades is far harder to check, although I may have picked up a weak echo of the signal in the constrast between sea-lane and non-sea-lane temperatures.
-
chriskoz at 17:20 PM on 17 November 2013Super Typhoon Haiyan: Realities of a Warmed World and Need for Immediate Climate Action
hank_@2,
You are wrong. The factual reality is that, no one has shown that model's predictions about future storms are accurate or wrong because no statistically signifficant data exists. In other words, the factual reality is: "we don't know". That's quite different to your SkS comment policy violating answer "NO".
Application of simple boolean logic in both statistics as in this example, as well as in everyday life, usually leads to illogical conclusions. In order to say "no" to any theory or claim, you have to present a proof that the claim is false. The fact that we cannot measure some claim (like in case of cyclones, we don't have enough data to show any statistically significant trend - the trend could be positive AWA negative with data we have), means that "we don't know".
-
barry1487 at 17:10 PM on 17 November 2013Super Typhoon Haiyan: Realities of a Warmed World and Need for Immediate Climate Action
A quick review of recent papers and AR5 suggests that storms of this intensity have very likely increased in the North Atlantic and other ocean areas, except for the North West Pacific (the Philippines is in the western Pacific Ocean).
Eg,
This additional homogenization step is found to measurably reduce LMI trends, but the global trends in the LMI of the strongest storms remain positive, with amplitudes of around +1 m s−1 decade−1 and p-value = 0.1. Regional trends, in m s−1 decade−1, vary from −2 (p-value = 0.03) in the western North Pacific, +1.7 (p-value = 0.06) in the South Indian, +2.5 (p-value = 0.09) in the South Pacific, to +8 (p-value < 0.001) in the North Atlantic.
http://journals.ametsoc.org/doi/abs/10.1175/JCLI-D-13-00262.1
While there is much uncertainty outside the North Atlantic, there is some confidence that Major Cyclone intensity has increased over the last 50 years or so globally, even while the total number of storms has not changed or decreased.
Why is it important to determine if this storm was 'unprecedented'?
-
Tom Curtis at 16:43 PM on 17 November 2013Super Typhoon Haiyan: Realities of a Warmed World and Need for Immediate Climate Action
hank_, with regard to (1), the intensity of a storm can be measured in various ways. As measured by central pressure, Haiyan was exceptional but not unprecedented, being equal 21st of Western North Pacific cyclones (typhoons). That is with an estimated low pressure of 895 hPa. However, one storm chaser in Tacloban measured pressures as low as 972 hPa before his barometer was destroyed.
As measured by windspeed, Haiyan had the highest windspeeds at landfall of any tropical cyclone. Jeff Masters shows this chart of windspeeds at landfall:

However, Tropical Cyclone Haiyan was not the strongest cyclone measured. Unfortunately lists as to which were stronger vary, and measurements prior to 1970 are known to be biased high, so it is unclear whether Haiyan was the second strongest measured, or only the fourth. So, again, exceptional but not unprecedented.
However, on (2) you are simply wrong. Elsner et al (2008) show a trend to increasing frequency of the 95 percentile of storms with increasing SST which is statistically significant (see table 1). More recent studies have been a little ambiguous, but it is evident that the answer to your question, is either "yes", or (at best for you) "it is not yet clear".
-
chriskoz at 16:27 PM on 17 November 20132013 SkS Weekly News Roundup #46B
"Majority of red-state Americans believe climate change is real", even in "red" states like TX & OK.
That's very interesting news. Apart from being an indicator of a success in climate science communication (of which we at SkS play proud role), it may herald the change of mind in some politicians there. I predict that many hardcore flat-earth denialists will start to convert to at least "lukewarmemrs", as their political expedience dictates. Just like Tony Abbott in Australia converted recently, as described in "Abbott's response to the climate challenge". And, like Tony's predecessor John Howard has been converting, according to his own admission recently, that only his "gut feeling" and "political climate" drive his knowledge about the world.
-
chriskoz at 16:11 PM on 17 November 20132013 SkS Weekly News Roundup #46B
hank_@1,
It'd be far more beneficial if you, instead of comlaining that "something obvious" was not mentioned, you'd actually explained what it was exactly, and even better provided the link, yourself.
I, for example, don't know what you talk about from your description, but I'd like to know that news. -
Morgan Wright at 16:06 PM on 17 November 2013Antarctica is gaining ice
Thanks for the graph showing that ozone has not lowered since around 1988, backing up my argument, that it cant be the cause of south pole cooling.
I also read the Lazarra paper you cited, in which he shows that the south pole winter temperatures are decreasing slightly as the south pole summer temperatures increase slightly, but that neither of which is statistically significant. So let's just say the south pole is staying the same, i.e. not warming.
Now, let's iron this whole thing out. South pole, not warming. Rest of earth, warming. The earth is a heat engine where most solar forcing is in the tropics, heated tropical air moving toward the poles, cold air returning toward the tropics to be heated again. So the earth is a heat engine, like a Sterling Engine, and it operates on the difference in forcing at the equator vs the poles.
So, the south pole is not changing, the equator is getting warmer, so the heat engine is getting stronger. That's why there is more polar easterly wind around Antarctica. That's why there is more antarctic sea ice. Has nothing to do with ozone which is just a stupid theory. Drop it. Let's never mention the word ozone again. There is no UV in Antarctica in the winter, almost none in the spring or fall. I'll give you the summer, which is when no sea ice forms. So, ozone has nothing to do with it. Time to burn the straw man.
OK I'm done with this. Case closed. Forget ozone forever, ok?
-
robert_13 at 15:59 PM on 17 November 2013CO2 lags temperature
Isn't CO(2) currently leading temperature and doesn't this reversal of temperature leading CO(2) to CO(2) leading temperature a strong indicator that current global warming is human-caused? If this is true, why do we need such complicated explanations of past natural changes to justify current conclusions about AGW? Why isn't this reversal of which initiates the feedback loop a major indicator that the current situation contrasts with natural climate change because it is human-caused?
-
adelady at 14:42 PM on 17 November 2013Global warming since 1997 more than twice as fast as previously estimated, new study shows
Great work, guys. Made me think.
We're perfectly OK acknowledging the differences in tables and graphs when someone asks directly why there is any difference at all between temperature measurements and trends from different organisations. See, look here, this crowd do it one way and these people do it another way and it's all perfectly reasonable that they come up with differing results. And everybody nods wisely.
As soon as this question is no longer front and centre, we blithely discuss "slowdowns" and "pauses" and heat sinks and various climate mechanisms as though the measurements and trends are entirely reliable, a mere background for other discussions. We should remind ourselves constantly that knowing about these features of the records is not like knowing times table or basic algebra as the unerringly solid foundation for simple calculations. We learn those things so that we don't have to think about them. These things do have to be thought about.
Keeping this work in the foreground for the next while should force us to keep the whole picture more comprehensively in mind.
-
chriskoz at 14:33 PM on 17 November 2013Deconstructing former Australian Prime Minister John Howard's 'gut feeling' on climate change
I just want to make a note how valuable is a contribution to this discussion by Tom Curtis. To those who know Tom, my remark may sound trivial, however in this case Tom's posts made a particularly big, positive difference. His training in in ethics, logic and epistemology really paid off: we now have the factual standard of the article lifted and the reality of Howard's double standard & hypocrisy explained. (Not that I disregard other commenters but Tom realy stands out here).
Now compare the logical standard above with that of Vincentrj, who is trying to make Argument from ignorance in order to confuse us, and he didn't even explain how his troll relates to the topic at hand. The difference in standard of discussion is so enormous that there simply cannot be any rational discussion, as Tom rightly asserts @30.
-
hank_ at 14:31 PM on 17 November 20132013 SkS Weekly News Roundup #46B
No mention of the major 'about face' by the Japansese in regards to their CO2 reduction commitments? That was more of a shock than either the Canadien or Aussi stories.
Moderator Response:[JH] The news about the Japanese decision will appear in the next issue of the Roundup.
-
Andrew B at 14:30 PM on 17 November 2013Free computer game - World at the Crossroads
This game should allow you to decomission power plants ahead of schedule when you're playing as leader of the world. This will allow you to adjust your energy portfolio as soon as it is economically possible to do so.
There should also be thorium-based molten salt nuclear reactor technology available, since in reality it represents a fairly inexpensive path to abundant, cheap power that doesn't come with the risk meltdowns. It should be available as early as the 1980s, depending on your research priorities.
In general, the game seems to overstate the risk associated with nuclear power. To date, in the entire history of commercial nuclear power, there have been three notable nuclear accidents, Three Mile Island, Chernobyl and Fukushima. Of those three, only Chernobyl resulted in fatalities. The fatalities that accident produced, according to best estimates, numbers in the tens (I think the figure is between 40 and 70). This comes to .7-1.2 deaths per year worldwide for the entire nuclear industry. That's better than just about any other form of energy produciton.
It would also help if the game writers cleaned up their economics a little bit. A few things I noticed:
- I think what they're calling "income" is actually tax revenue.
- A trade surplus when you play as an individual nation is shown as slows GDP growth GDP/capita growth. This is backwards. What would actually slows economic growth is saving unspent tax revenue.
- The game makes dubious assumptions about what precipitates a financial crisis. The model they use assumes that negative GDP growth causes a financial crisis when in fact negative GDP growth is the result of financial crisis. As we recently witnessed, a financial crisis is perfectly capable of taking place during periods of economic growth (and subsequently bringing them to an end).
-
hank_ at 14:27 PM on 17 November 2013Super Typhoon Haiyan: Realities of a Warmed World and Need for Immediate Climate Action
The two things we have to ask ourselves about this storm are;
1)"Was the intensity of this storm in the area in question 'unprecedented'?"
and 2) Has the frequency of storms of this magnitude increased over the past 60 or so years?"
At this point the answer to both questions is clearly "NO" "no".
Moderator Response:[JH] The use of "all caps" is prohibited by the SkS Comments Policy. Please read the policy and adhere to it.
-
Debunking 97% Climate Consensus Denial
Ironbark - My apologies, I may have in haste misread your post. Regarding the details of attribution, there is a lot of work ongoing, see here.
Regarding the basics of human influence being the dominant factor in warming, no, there isn't much research going on - as that's been very well established.
-
Debunking 97% Climate Consensus Denial
Ironbark - As the paper itself clearly states:
This result is expected in consensus situations where scientists '...generally focus their discussions on questions that are still disputed or unanswered rather than on matters about which everyone agrees'
It's been researched for over 150 years, and as per the observed consensus, the basic outline of AGW is no longer a question that requires discussion.
-
John Hartz at 14:12 PM on 17 November 2013Deconstructing former Australian Prime Minister John Howard's 'gut feeling' on climate change
Vincentrj:
Please note that posting comments here at SkS is a privilege, not a right. This privilege can be rescinded if the posting individual treats adherence to the Comments Policy as optional, rather than the mandatory condition of participating in this online forum.
Please take the time to review the policy and ensure future comments are in full compliance with it. Thank you for your understanding and compliance in this matter.
-
John Hartz at 14:08 PM on 17 November 2013Deconstructing former Australian Prime Minister John Howard's 'gut feeling' on climate change
All:
Vincentrj's most recent comment was off-topic and was therefore deleted. DSL's response to it was also deleted.
-
Ironbark at 12:48 PM on 17 November 2013Debunking 97% Climate Consensus Denial
Given the low number of articles found which express the IPCC position (i.e. that humans are responsible for most of the recent warming), does this paper support the proposition that the extent of attribution is not a widely researched question?
-
grindupBaker at 12:42 PM on 17 November 2013Southern sea ice is increasing
For anybody who likes a relaxing assimilation of some information there's a lecture by Dr. Sarah Gille on the Antartctic ocean, apparently her specialty, on the web at time of my comment. Discusses the contraction that's happened causing cooler oceans near South Pole but warmer at slightly higher lataitudes. Also, a polar atmosphere lecture by Dr. Dan Lubin.
-
barry1487 at 12:15 PM on 17 November 2013Super Typhoon Haiyan: Realities of a Warmed World and Need for Immediate Climate Action
"However, models suggest more frequent and intense storms in a warmed world."
Is that right? I have often corrected 'skeptics' when they announce that more frequent storms is a climate prediction under a warm world, linking them to RealClimate, here and the IPCC reports, saying that storm intensity is predicted to increase, not frequency.
AR5 (14.6.3)says:
While projections under 21st century greenhouse warming indicate that it is likely that the global frequency of tropical cyclones will either decrease or remain essentially unchanged, concurrent with a likely increase in both global mean tropical cyclone maximum wind speed and rainfall rates, there is lower confidence in region-specific projections of frequency and intensity. Still, based on high-resolution modelling studies, the frequency of the most intense storms, which are associated with particularly extensive physical effects, willmore likely than not increase substantially in some basins under projected 21st century warming.
As far as I understand the matter, the sentece would be more accurate if it had gone thus; "...models suggest more frequent intense storms in a warmed world."
-
Tom Curtis at 12:05 PM on 17 November 2013Antarctica is gaining ice
Morgan Wright @204:
1) Of recent papers on Antarctic temperatures all that I have checked show warming. These include not only Steig et al, and O'Donnell et al, but also:
Muto et al (2011), which shows warming of 1 - 1.5 C in East Antarctica, most of which has been in the last two decades.
Bromwich et al (2013), which shows "Central West Antarctica [to be] among the most rapidly warming regions on Earth".
Screen and Simmonds (2012), which shows mid tropospheric warming and stratospheric cooling over all of Antarctica, with the stratospheric cooling being concentrated in Spring and Summer.
Schneider et al (2010), which shows a 0.1 C per decade trend averaged over all of Antarctica, with warming strongest in the pensinsular, and second strongest in the West Anarctic spring.
And finally, because your initial comments regarded the South Pole, we have Lazzara et al (2012), who show a cooling trend at the South Pole till about 2000, and a rapid warming trend thereafter:

It should be noted that when the data is extended to include 2012, the trend of the full data sets becomes positive (as previously noted).
So, there is little doubt from recent literature that Antarctica is warming, with most of the warming being in the last two decades, and in West Antarctica. If you have a paper published in the last 5 years that disputes that, I would be interested to see it - but I see no reason to reject recent studies in prefference to older studies, particularly given that the older studies are now obsolete due to the recent rapid warming trend.
2) You are simply wrong about ozone. Ozone has never fallen noticably below 100 Dobson Units in the period of observations:
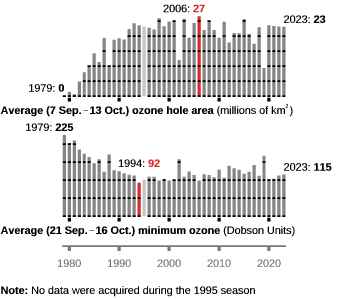
Your repeated errors on simple matters of fact are very damaging to your case.
You are also wrong to claim the effect cannot occur because it happens in winter when the sun does not reach the pole. That is first, because the effect occurs in the Autumn when sea ice is growing, but when the sun can still reach the pole. It is also because the ozone hole often extends beyond the Antarctic Circle, which together with its high altitude ensures sunlight reaches regions of depleted ozone long after the pole falls into shadow at the surface.
I will respond to your other points later.
-
LuisC at 10:48 AM on 17 November 2013Free computer game - World at the Crossroads
Meh, I guess I can just play it in Safe Mode. No big deal. Great game, by the way!
-
grindupBaker at 09:59 AM on 17 November 2013Global warming since 1997 more than twice as fast as previously estimated, new study shows
Passing ironic that my simple-minded note that OHC is the future and my lukewarm kudo for the sterling poster (actual posters) historical GMST (a "global warming" proxy) work drew only #39 Poster with an even more nebulous proxy that assumes I'm so ignorant that I think oceans at 0-4 Celsius will expand hugely if warmed a tad. I've done the simple math in the first few hours I first looked at this topic in spring. My moderation-resistant on-topic asides are Prof Muller BerkeleyEarth shows a smoother increasing temperature & derivative land-only data mean (? I've no time to study his available RMS? software) and that I disagree with Bert #43 about "venomous response" because I can only see this brilliant satellite infill analysis to correct (and warm-up) the data in recent years as increased polar warming renders simple interpolation (even modelled type) imprecise as being a much more accurate multi-sensor trick to hide the decline in polar GMST measuring quality that has evidently been happening with interpolation, so I see no basis for attack on the work or on my comment here for that matter.
-
Paul Pukite at 08:49 AM on 17 November 2013The Other Bias
TC,
I am looking at a very restricted interval during the war. KevinC posted this chart below in a previous SkS article which shows that ships were not using trailing buckets as long as U-boats were on the loose :

My point is that this interval is exactly coincident with the only residual epistemic noise spike that I see when comparing my model to the data.
I am not certain which time series deal with this correctly.
-
Morgan Wright at 08:26 AM on 17 November 2013Antarctica is gaining ice
Most papers on the subject state that the south pole, and much of Antarctica, are cooling. Study the following chart from NASA:
http://www.hyzercreek.com/nasa2005.jpg
The original explanation of how ozone is causing the south pole to cool is wrong, since the ozone level is not changing, (it is already at zero), and yet the south pole is cooling. Your attempt to tweak the ozone hole explanation with a new twist also does not work...you say the ozone fails to absorb UV in the stratosphere, causing more sea ice to form in the winter. This is impossible, because there is no sunlight at the south pole in the winter, and therefore no UV.
http://i.imwx.com/web/multimedia/images/blog/antarctica_wind_pattern.jpg
Listen to me closely. Look at the above link and notice that the vortex has its center over the south pole and is blowing outward, not inward. Polar cooling of the air in winter causes high pressure which sends frigid air north along the surface. At the pole the air has almost no angular momentum, so as it moves north it will not spin as in a vortex. Rather, as the air moves north, the west-to-east rotation of the earth underneath it becomes increasingly fast, making the air blow to the west relative to the earth even though the air itself has little motion. These are referred to in the literature as polar easterlies. They are not really a cyclone because they are caused by the rotation of the earth, not conservation of angular momentum. 200 miles from the pole the earth is rotating around 50 MPH but 1000 miles from the pole the earth is rotation 250 miles per hour. You can see the winds can become frighteningly fast fairly quickly.
The colder the pole, the stronger the high, and the faster the northward motion of the air, and the sooner it can get north before picking up angular momentum from the friction against earth's surface. Therefore, the colder the pole, the stronger the polar easterlies will be. The increase in the polar easterlies is caused by increasing cold. Therefore, the increase in sea ice is caused by increasing cold at the pole. Therefore, we need to know why the pole is getting colder. It's not a straw man to mention the O3 hole, since we need to know whether it's cooling due to the ozone hole, or whether it's cooling because AGW is a false hypothesis.
This web site is for skeptics of skeptics. All the skeptics are saying the antarctic sea ice is increasing because it's getting colder down there, and there is no AGW. Skeptics of skeptics are saying.....Some are saying, ok the south pole is getting colder but it's from the ozone hole. Some (this OP) are saying it's not even getting colder, the sea ice is from the wind, and part of that explanation is to pretend the wind is coming from the wrong direction and saying the south pole is a low pressure vortex. We need to iron this out.
-
Cosmic rays fall cosmically behind humans in explaining global warming
Well, it only confirms what Richard Alley told us 4 years ago, doesn’t it?
Since a huge increase in cosmic rays didn’t have a noticeable impact on climate 40,000 years ago the conclusion from CERN isn’t very surprising. Unless of course, the assumed link between cosmic rays and the beryllium-10 isotope is wrong.BTW, is Dimethylamine somehow related to Dimethyl sulphide? James Lovelock (the guy behind the Gaia hypothesis) has proposed that Dimethyl sulphide emitted from some marine algae play an important role in cloud formation over the oceans.
-
Timothy Chase at 08:08 AM on 17 November 2013The Other Bias
Kevin C., somehow it escaped me that you are the Kevin Cowtan that coauthored the paper with Robert Way. Congratulations! I am looking forward to reading the paper.
-
LuisC at 07:19 AM on 17 November 2013Free computer game - World at the Crossroads
None of that worked. I can run it only when the computer is in Safe Mode. I can't even established user rights on my own computer because of the disgusting piece of garbage that is Windows 7.
'2. On some computers the game may be blocked by an antivirus software (it was necessary to mark the file as "allowed" and everything run fine).'
How?
-
folke_kelm at 05:45 AM on 17 November 2013Cosmic rays fall cosmically behind humans in explaining global warming
HK@12
It is necessary to test hypotheses in realistic experiments. So i do not think it is a waste of time what they have done at CERN. You must know that they did not only test Svensmarks hypothesis of cosmic rays seeding cloud condensation nuclei, but also other factors which may have influence on seeding clouds.
There is a (in my onpinion) very important article in Nature 17.oct 2013 vol 502 Almeide et Al.
Molecular understanding of sulphuric acid-amine particle nucleation in the atmosphere
doi:10.1038/nature12663
They find a natural presence of Dimethylamine dwarfing cosmic rays in their effect on cloud nucleation. This is a direct result from the CLOUD experiment at CERN.
-
Timothy Chase at 05:13 AM on 17 November 2013The Other Bias
WebHub Telescope, the issue of switching from intake water to buckets is covered here:
What caused such a dramatic drop in SST in 1945? In the wartime years leading up to 1945, most sea temperatures measurements were taken by US ships, who measured the temperature of the intake water used for cooling the ship's engines. This method tends to yield higher temperatures due to the warm engine-room environment. However, in August 1945, British ships resumed taking SST measurements. British crews collected water in uninsulated buckets. The bucket method has a cooling bias.
A new twist on mid-century cooling
Posted on 2 June 2008 by John Cook
http://www.skepticalscience.com/A-new-twist-on-mid-century-cooling.html... and as you indicated it is a 1940s issue.
The problem involving the switch to buoys is more recent. It is introduced here:
Ships and buoys made global warming look slower
26 November 2010 by Michael Marshall
http://www.newscientist.com/article/dn19772-ships-and-buoys-made-global-warming-look-slower.htmlMet Office to revise global warming data upwards
Leon Clifford, 26 Nov 2010
http://www.reportingclimatescience.com/news-stories/article/met-office-to-revise-global-warming-data-upwards.htmlThe issue is identified here:
Kennedy, J. J., R. O. Smith, and N. A. Rayner. "Using AATSR data to assess the quality of in situ sea-surface temperature observations for climate studies." Remote Sensing of Environment 116 (2012): 79-92.
http://hadleyserver.meto.gov.uk/hadsst3/RSE_Kennedy_et_al_2011.doc... and receives some mention here:
Kennedy J.J., Rayner, N.A., Smith, R.O., Saunby, M. and Parker, D.E. (2011b). Reassessing biases and other uncertainties in sea-surface temperature observations since 1850 part 1: measurement and sampling errors. J. Geophys. Res., 116, D14103, doi:10.1029/2010JD015218
http://www.metoffice.gov.uk/hadobs/hadsst3/part_2_figinline.pdfAdditionally, NASA's approach uses a method of interpolation, and the somewhat more sophisticated kriging used in this more recent paper, which doesn't infill from satellite data per se, but uses how satellite data and surface temperatures are correlated over the ranges for which surface temperature measurements are available to infill where they are absent, appears more accurate.
Please see:
Global Warming Since 1997 Underestimated by Half
Filed under: Climate Science Instrumental Record — stefan @ 13 November 2013
http://www.realclimate.org/index.php/archives/2013/11/global-warming-since-1997-underestimated-by-halfFor more information on the new paper, might try:
Coverage bias in the HadCRUT4 temperature record
Kevin Cowtan and Robert Way
http://www-users.york.ac.uk/~kdc3/papers/coverage2013/... and in particular, the background:
http://www-users.york.ac.uk/~kdc3/papers/coverage2013/background.html
-
Timothy Chase at 04:03 AM on 17 November 2013The Other Bias
The third paragraph states, "One source of bias - due to poor observational coverage - has been discussed in our recent paper, although it was reported back in 2009, and it was addressed by NASA as long ago as 1987."
"Our recent paper" is hyperlinked to the main page of Skeptical Science. I believe you mean to link to:
Coverage bias. The HadCRUT4 and NOAA temperature records don’t cover the whole planet. Omitting the Arctic in particular produces a cool bias in recent temperatures. (e.g. Hansen et al 2006, Folland et al 2013). The video avoided this problem by using GISTEMP. However the issue affects the Foster and Rahmstorf analysis of the other records.
Has the rate of surface warming changed? 16 years revisited
Posted on 21 May 2013 by Kevin C
http://www.skepticalscience.com/has_the_rate_of_surface_warming_changed.html... although:
The 2012 State of the Climate is easily misunderstood
Posted on 24 October 2013 by MarkR
http://www.skepticalscience.com/2012_soc_misunderstood.html... may also be of some value.
-
Paul Pukite at 04:00 AM on 17 November 2013The Other Bias
Kevin, The bias that you have isolated accurately is the one during WWII. I agree that a measurement error of about +0.1C occurs between 1940 and 1945. It is not clear whether the time series such as GISTEMP actually correct for this. I have been doing my own time-series "reanalysis" via what I refer to as the CSALT model. This recreates the temperature record via non-temperature measurements such as CO2, SOI, Aerosols, LOD, and TSI (thus the acronym).
What I find is that there is a significant warming spike during the WWII years which I correct below. The amount of correction is 0.1C, and when I apply that the model residuals trends more to white noise over the entire record.

-
Timothy Chase at 03:10 AM on 17 November 2013The Other Bias
Just below Figure 1 a paragraph begins "The UK Met Office have developed a very sophisticated analysis to address these biases."
"very sophisticated analysis" is hyperlinked to the main page of Skeptical Science. Two places that seem more appropriate are:
First Look at HadCRUT4
Posted on 18 April 2012 by dana1981
http://www.skepticalscience.com/first-look-at-hadcrut4.htmlHadCRUT4: A detailed look
Posted on 22 May 2012 by Kevin C
http://www.skepticalscience.com/hadcrut4_a_detailed_look.htmlThe second seems especially relevant. I would leave Figure 1 as is, then hyperlinks "more complex" in the caption to figure 1 to the first and "a very sophisticated analysis" to the second.
I believe this would go a long way to addressing the concerns wili expressed in comment 3.
-
DMarshall at 02:50 AM on 17 November 2013Trenberth can't account for the lack of warming
Mods,
Please note that the link to the Trenberth paper is broken and should point to
http://www.cgd.ucar.edu/staff/trenbert/trenberth.papers/EnergyDiagnostics09final2.pdf
-
michael sweet at 01:23 AM on 17 November 2013Deconstructing former Australian Prime Minister John Howard's 'gut feeling' on climate change
Vincentrj:
Just because you are only recently interested in climate change does not mean that it is a new scientific endeavor. The theoretical basis of AGW was mature in 1896 (that's 117 years ago) when Arhennius published his predictions for temperature increase worldwide from increase in CO2. Arhennius correctly predicted approximately how much the temperature would go up, greater increase in winter than summer, greater increase at night, greater increase in the Northern Hemisphere (especially the Arctic) and greater increase over land than water. These points were dismissed at the time but were confirmed experimentally in the 1980's and 90's as temperatures finally increased enough to go above the noise. Your objection to long time periods having to pass to confirm predictions have been met by waiting long enough. Exactly how long do you need to trust these validated predictions? Obviously furthur increases in temperature will have greater effect. That cannot be measured until we wait for them to occur. Scientists did not come to a consensus until the 1960's that AGW would be a problem and it was the 90's before the data was confirmed to be above the noise. The reason so many disciplines are in agreement is that they have had over a century to review the data. We are now 20 years past what any resonable person would call confirmed data and you want to delay because scientists are all in agreement? Do you also think the world is flat since that is no longer debated?
Many scientits understand AGW well. The reason scientists agree is that the data is overwhelming in support of AGW theory. Only those who are unwilling to objectively look at the data are outside the consensus. The scientific debate now concerns how bad the problem will be, what can be done to lessen the damage and how long we have before the damage is irreparable.
It strikes me that you are making an argument from ignorance. Since you do not know what the data is you claim no one else does. In fact, others have put in more time and effort and understand the data. Do you intend to perform your own brain surgery when you need it or will you obtain expert help on such a specialty subject?
-
Tom Curtis at 00:39 AM on 17 November 2013Deconstructing former Australian Prime Minister John Howard's 'gut feeling' on climate change
DSL @29, Vincentrj's "tone" is not reasonable just because he uses no pejoratives while suggesting, in effect, that climate scientists are involved in a tacit conspiracy to misrepresent research findings so as to defraud the public. The slander involved still makes his post obnoxious. Further, given that his argument is, in effect, that AGW must be doubtfull because the scientists who study it overwhelmingly report evidence that confirms it, I doubt sincerely he is capable of rational conversation on the topic.
-
DSL at 00:23 AM on 17 November 2013Deconstructing former Australian Prime Minister John Howard's 'gut feeling' on climate change
Vincentrj, I appreciate your reasonable tone.
It seems odd to me that the basis of trust should be the degree of debate. That seems a sure-fire way to end up never agreeng with a proposition. No debate? Don't trust it. Lots of debate? Too much uncertainty.
There is an overwhelming consensus on heliocentrism, therefore . . .
The greenhouse effect has been instrumentally measured from surface, inferred from satellite instrument, lab tested bajillions of times, etc. . . . so there's no debate, therefore . . .
The strength of CO2 as a greenhouse gas is established. There's no debate because no one is interested in debating. In feedbacks, there's plenty of debate. I suggest you make some distinctions and point out just where you think there's no debate and to the detriment of trust in science.
As for the complexity, it's not true to say that no one person can grasp it. It is true to say that no one person can grasp it all at once. So what? The same can be said of the human body. If we don't trust science when it addresses complex systems, science dies as a way of understanding things. Are you down with that? Or do you have a replacement -- something simpler?
-
Vincentrj at 00:02 AM on 17 November 2013Deconstructing former Australian Prime Minister John Howard's 'gut feeling' on climate change
The leader of the Liberal opposition party in Australia prior to the election of John Howard as Prime Minister, was Dr John Hewson, an economist.
Just a few days ago I heard John Hewson expressing his views on anthropogenic climate change, on an ABC program called The Drum.
What fascinated me is that his reasons for believing that our CO2 emissions are putting us at great risk of calamity, are the same reasons that cause me to be skeptical about the issue.
Dr Hewson claimed that on most matters involving complex research, scientists are always in some disagreement, expressing different opinions and interpretations of the evidence and the data. However, on the subject of Anthropogenic Global Warming, all the scientists working in the various fields related to climate change are in agreement.
Since this agreement, or consensus, is almost unprecedented in the world of science, or at least in the sphere of new research, it therefore follows that the climate scientists must be right, was his line of reasoning.
However, my line of reasoning, if it is indeed true that there is a genuine consensus among climate scientists, is that something other than science must be going on here, considering the enormous complexity of the numerous forcings or influences on climate, and their interactions.
In other words, if the subject being investigated is relatively straightforward, there might be no good reason to doubt a consensus of opinion among scientists working in the field. To do so might reasonably fit the description of denial.
However, as I understand, the field of climate science involves 20 or 30 different disciplines. There are elements of chaos that have to be dealt with, a lack of reliable historical data relating to climate change in the past and a lack of meteorological data on extreme weather events in the past.
Furthermore, because of the long time-spans involved, theories and predictions cannot be verified using practical, physical models of the earth's climate. It would therefore seem to me that the situation is ripe for continual differences of opinion among scientists working in the various disciplines.
Since there doesn't appear to be much difference of opinion, despite the enormous complexity of the subject, I think alarm bells should be ringing. Setting aside conspiracy theories, could there be some rational explanation for this apparent consensus of opinion, or this lack of the usual disputation among scientists.
For example, is the subject so complex that no single person can grasp the whole of it, just as no single person, however brilliant, could prove the theory of AGW fallacious? Perhaps the options are basically, either continual squabbling and differences of opinion at taxpayers' expense (because the climate research centres are usually government funded), or a tacitly understood agreement that a consensus of opinion is the best approach in order to maintain funding for the research centres and to provide effective advice to governments that at least gives the governments a chance of initiating effective action to reduce CO2 emissions.
-
Bart Verheggen at 23:17 PM on 16 November 2013Global warming since 1997 more than twice as fast as previously estimated, new study shows
Jos Hagelaars made a figure comparing these new Cowtan and Way data to the CMIP5 model ensemble (and to HadCRUt4 for reference).
Blogpost: http://ourchangingclimate.wordpress.com/2013/11/15/cowtan-and-way-global-average-temperature-observations-compared-to-cmip5-models/
Figure: http://ourchangingclimate.files.wordpress.com/2013/11/cowtan_way_hadcrut_rcp85-jos-hagelaars-2013.png
-
Morgan Wright at 23:09 PM on 16 November 2013Antarctica is gaining ice
http://i.imwx.com/web/multimedia/images/blog/antarctica_wind_pattern.jpg
South polar high, as I said. Winds go towards the sea, rotation of the earth to the east causes the wind to turn west to make polar easterlies.
-
Tom Curtis at 23:05 PM on 16 November 2013Antarctica is gaining ice
Morgan Wright @200 & 202:
1) The South Pole itself is not in the blue patch shown on the O'Donell et al map, but rather on the border. The temperature trend at the South Pole as measured by instruments on the surface is scarcely distinguishable from zero (0.007 C per decade), but is not falling. But, does that really matter. Does any part of your argument actually hinge on the South Pole cooling while Antarctica in general warms?
2) I'm so glad your vast fount of knowledge has put the American Meteorological Society in its place:
"cold low
(Or cold cyclone;
also called cold-core low, cold-core cyclone.) At a given level in the atmosphere, any low that is generally characterized by colder air near its center than around its periphery; the opposite of a warm low.A significant case of a cold low is that of a cut-off low, characterized by a completely isolated pool of cold air within its vortex. The cyclonic intensity of a cold low increases with height in accordance with the thermal wind equation."
Or possibly you just don't know everything about meteorology, and you got that one wrong.
3) I say that increased CO2 cools the stratosphere by radiating from the stratosphere, not into it.
4) I say that when air moves from a location with high rotational velocity (m/s following a circumference) to a location with a low angular velocity, the air will conserve angular momentum and hence be diverted at right angles to the the initial impetus, resulting (at the poles) in a vortex around the pole. The greater the reduction in rotational velocity of the surface on over which the air is located, the greater the relative velocity of the air to the surface as a result of conserving angular momentum. I think, however, you had figured this out by your post 201.
5) I am not much concerned about your original ozone skepticism. The OP does not claim that decreased ozone cools the surface. Rather it claims that decreased ozone increases the velocity of the circumpolar vortex, thus breaking up pack ice and allowing more ice to form at the surface, thereby contributing to greater sea ice extent. The mechanism for doing this involves cooling of the stratosphere, not the surface. Reduced ozone cools the stratosphere by the very simple mechanism that less ozone results in less UV radiation being absorbed, and hence energy in the stratosphere.
You are welcome to be as skeptical as you like about your straw man. It just has no relevance to the topic discussed on this thread.
-
Bert from Eltham at 21:09 PM on 16 November 2013Global warming since 1997 more than twice as fast as previously estimated, new study shows
What this work shows is how to start to merge all the data from physically different sensors.
My prediction is that one day ocean temperatures will also be better mathematically linked.
How long have the masses/ignorati cried out 'how do you measure the temperature of a whole planet?'
These criticisms are legitimate? from people who know nothing of science. The fact that they are totally ignorant of the complexities is very sad.
As night follows day this paper will be a focus for the ignorati for the most venomous response.
It has already started. Bert
-
penchant at 20:38 PM on 16 November 2013The Other Bias
Hi
Note that trends starting in 1997 and 1998 are most biased by the change in observational method. The striking thing about this result is that these are the same trends which are most impacted by coverage bias
2003 and 2004 seem to exceed 1997/8. Perhaps they should read -.053 and -051 ?
Moderator Response:[JH} The replication of the OP and the comment thread has been deleted. There is no need to copy and paste either one into a comment.
-
Bert from Eltham at 20:20 PM on 16 November 2013Help make our coverage bias paper free and open-access
Worked fine from Australia!
Bert
-
Morgan Wright at 19:14 PM on 16 November 2013Antarctica is gaining ice
OK on second read where you say the air moves from a position of high rotational velocity to low velocity, you were talking about the velocity of the rotating earth, not the rotational velocity of the air. OK never mind. As long as we are on the same page.
Now, what about the ozone? Or lack thereof.
-
Morgan Wright at 18:58 PM on 16 November 2013Antarctica is gaining ice
First, I did not say Antarctica is getting colder. I said the South Pole is. The chart you presented, of O'Donnell et al, clearly shows a large patch of blue over the south pole. Most other studies show the same thing. I understand the peninsula is warming and the pole is cooling. I am concerned about, and dispute, claims that the O3 hole is the reason for south polar cooling.
Second, you mention a low pressure system caused by the cooling of this air. This is never found. Cooling of air causes a high pressure system, always.Third, you say CO2 increases cooling by radiating heat into the stratoshpere, and describe a reverse greenhouse effect over the pole. I appreciate that and find it interesting. I'm sure what you say is true because I've noticed the same thing flying over the arctic, where stratospheric temps outside the cabin were -40 F and the ground temp over northern Canada and Alaska were -60 or lower. Very interesting and probably more true of the antarctic. I see the hump in illustration (c) and vaguely remember that from college. Thank you.
Fourth, you say air north of Antarctica moves southward and the rotational velocity slows down because it conserves angular momentum. This is the opposite of how a vortex works. Air moving towards the center of a vortex always increases rotational speed as its radius from the center of the vortex decreases. Oh wait, at the end of the same paragraph you say the speed increases. Never mind. Maybe it was an error. However, a true vortex is caused by a low pressure zone and adjacent air moving into the low and rotating as it moves in due to conservation of angular momentum. In this case, the center of the vortex is a high pressure zone, the air is not moving in but moving west, and the rotation is caused by the rotation of the earth. It's not really a vortex at all. Compare this to how a hurricane works. Not even similar.
This conversation has been fun but says nothing about my original ozone skepticism.
-
Tom Curtis at 17:20 PM on 16 November 2013Antarctica is gaining ice
Morgan Wright @197 & 198, you appear to be missing several crucial facts in your discussion.
First, Antarctica is getting warmer, not colder. This has been shown in several recent studies, including by Steig et al (2009) and O'Donell et al (2010)

The rate of warming is low relative to much of the rest of the planet, an in particular the Arctic, but it is still warming. That has little bearing on the formation of sea ice, however, as during the Antarctic winter when sea ice forms, temperatures plummet so that it remains cold enough for sea ice to form even with the slight warming.
Second, it is not postulated above that ozone depletion encourages the formation of sea ice by cooling Antarctica, but rather by causing stronger winds, which push sea ice apart, exposing additional surface area in which sea ice can form. Reduced ozone does in fact cause cooling, but in the stratosphere, where the reduced ozone results in less UV radiation being absorbed, and hence less warming of the stratosphere. As it happens, increased CO2 reinforces this effect by radiating that heat which is captured away more effeciently. Therefore, at the relevant level of the atmosphere (the lower stratosphere) both reduced ozone and increased CO2 reinforce the same effect, ie, cooling the lower stratosphere.
The result of this colder air is that warmer air from the further north is drawn towards the low pressure system formed by the cooling of the air. This is particularly the case in the Southern Hemisphere summer, when the air north of Antarctica is particularly warm due to the Sun being more directly overhead. However, as the air is drawn towards Antarctica, it moves from a position of high rotational velocity to one of lower rotational velocity. Because angular momentum is conserved, this diverts the winds westward, forming a circumpolar vortex. The colder the Antarctic stratosphere, the further south the warm winds from further North penetrate, and hence the greater their angular velocity relative to the surface, ie, the faster the circumpolar vortex.
These faster winds then tend to break up the ice as explained above.
Third, the greenhouse effect over Antarctica is very weak, and sometimes negative. This may seem counterintuitive, but the greenhouse effect is a consequence of the difference in temperature between the source of IR radiation emitted at the ground, which is then absorbed by the atmosphere, and the temperature of the layer of the atmosphere which emits most IR radiation to space. In Antarctica, the surface is very cold. More importantly, most of the heat in Antarctica is brought by warm air from the north rather than from the direct radiation from the Sun. As a result, the air above Antarctica is very warm relative to the surface compared to, for example, the tropics. As a result, the greenhouse effect is very weak in Antarctica. Indeed, sometimes, and particularly in winter, the air above Antarctica will be warmer than the surface, resulting in a reverse greenhouse effect - ie, a cooling tendency from the greenhouse effect rather than a warming tendency. This can be seen in the figure below, showing IR radiation to space at various locations. You will notice in Antarctica there are humps at the same locations where in other areas their are dips. The humps indicate the atmosphere was warmer than the surface, and that at that time there was a reverse greenhouse effect.

Finally, a strengthened circumpolar vortex does in fact reduce the rate at which heat is transported into Antarctica. This does not cool Antarctica, for the strengthened vortex was created by an increased initial heatflow southwards. But it does significantly reduce the rate at which heat penetrates to the interior of Antarctica. This is plain in the heat map of Antarctica by O'Donell et al (2010) (above), where (I believe) the warming on the Antarctic Peninsula is much stronger than that in the rest of Antarctica. That is because it sticks out under the vortex (at least some of the time), and into the circumpolar currents driven by the vortex.
-
boba10960 at 16:35 PM on 16 November 2013Help make our coverage bias paper free and open-access
Thomas Huld - Thank you for the clue. Although changing the country menu directly to United States did not work, changing it first to Francce and then changing it again to Etats-Unis brought up a menu with fields appropriate for U.S. donors. Others in the U.S. who doi not have PayPal accounts may want to try this.
-
Morgan Wright at 12:58 PM on 16 November 2013Antarctica is gaining ice
What I mean is, since CO2 is much more important than ozone as a greenhouse gas, and CO2 is increasing, there is nothing O3 can do to make the south pole get colder. O3 can decrease, increase, stay the same, or drop to zero (it's close to zero anyway and has been for 30 years), there is no logical way we can deduct that O3 can make the south pole get colder. It is not logically possible, when CO2 is increasing. Impossible.
Prev 803 804 805 806 807 808 809 810 811 812 813 814 815 816 817 818 Next


