


 Arguments


Recent Comments
Prev 816 817 818 819 820 821 822 823 824 825 826 827 828 829 830 831 Next
Comments 41151 to 41200:
-
r.pauli at 01:30 AM on 18 October 2013Time to change how the IPCC reports?
Need a Ministry of Climate Information... one can see daily information that's important.
-
Paul Pukite at 01:30 AM on 18 October 2013Science of Climate Change online class starting next week on Coursera
To join in on all the interesting ways of presenting interactive information, I have been adding climate models to my environmental context model server:
http://entroplet.com/context_salt_model/navigate
This particular example demonstrates how natural fluctuations contribute to the temperature pause.
Archer has certainly been improving his online apps, as the Modtran interface has gone through an upgrade. Other good online applications include Climate Explorer, of course the ones here at SkS developed by Kevin, Nick Stokes' Moyhu work, and WoodForTrees.
-
Composer99 at 01:24 AM on 18 October 2013Time to change how the IPCC reports?
Fergus:
As a matter of policy I think your idea is a very good one, in that incorporating IPCC reporting into wider UNEP policy documents is a useful (if time-consuming) process.
I doubt, however, that it would do much to end unconstructive pseudo-debate or convince self-styled skeptics to lay down their rhetoric. The UN and its branch organizations are not, to my knowledge, well-received among the circles that self-styled climate skeptics appear to prefer.
-
Fergus Brown at 01:04 AM on 18 October 2013Time to change how the IPCC reports?
Since the IPCC sits in the net of UNEP, and since many of the UNEP reports deal with managing future change in general, perhaps it is time to consider incorporating a number of Earth and environment reports, including the IPCC one, into a more encompassing, multi-disciplinary five year report card on the state of the planet. Though I'll be honest the logistics would be mind-numbing.
This would allow the IPCC to continue a version of it's long-standing review of recent developments in climate change, in particular WG2, but in a context of how this fits in with all the other issues facing the planet and our stewardship of it. It might also divert some of the rabid politicisation of the suppoed 'debate' on climate, which has descended in many ways into a playground punch-up.
-
dvaytw at 00:49 AM on 18 October 2013Temp record is unreliable
Thanks guys for all the tips. My initial tactic was to point out to him that there are so many temperature records showing the same basic pattern; if the measurement system were flawed, errors would be in all directions and there wouldn't be such obvious similarity between them. I also pointed him to a very useful pair of charts: on Wikipedia, 'temperature records by countries'. A quick glance of the 'hottest temperature records' vs. 'coldest temperature records' shows that the former outnumber the latter by a large margin in the last couple decades. So even just looking at that, the trend is pretty obvious.
I have another question, but I don't want to keep bothering y'all for answers, so maybe you could just direct me to the most pertinent article, in response to this point of his:// ...if anyone wants to claim that CO2 levels in the upper atmosphere are causing ground level increases in temperature, there would need to be much greater warming there, which is demonstrably not happening. //
PS - Moderator, please feel free to delete any of my "please help me with debate" questions to the forum if you feel they are off-topic or don't contribute to the discussion! Thanks in advance!Moderator Response:[JH] We welcome your posts and others like them. The comment threads should, in an ideal world, function as a classroom where honest questions are asked and honest answers are given.
If you have a question and cannot find an appropriate thread to post it on, feel free to post it on one of our "open threads", i.e., the Weekly Digest or the Weekly News Roundup.
-
Manwichstick at 23:42 PM on 17 October 2013Understanding the pre-IPCC Anti-Climate Science Misinformation Blitz
In Toronto, a meterologist posted a piece critical of the 5th IPCC report in late September.
I posted this rebuttal on a science-based skeptic website:
http://www.skepticnorth.com/?p=11727
I would like any feedback the SKS crew can provide regarding my analogies, or if I have overstated the science in any places. I want to be clear and confident, but I also don't want to overstep.
My intent is to try to slow down the the climate "skeptics" momentum by raising some question marks about the authenticity of their claims.
Shawn
Moderator Response:[JH] I deleted a duplicate post of this comment.
-
Composer99 at 23:20 PM on 17 October 2013Why trust climate models? It’s a matter of simple science
Like any Earth science, climatology has the problem of not easily being able to run experiments the way one can in, say, particle physics or chemistry. As expensive as it is to build and run a particle accelerator, it is simply impossible to "build" an alternate Earth, more-or-less perfectly replicating the real thing, and run it through decades or centuries or millions of years of change in a reasonable timeframe.
So you use a model.
In essence, a computer model of the Earth climate system is a laboratory experiment of the Earth's climate. One you can run through in a reasonable amount of time, at a reasonable cost, and can replicate at will (subject to time/cost/other resource constraints).
Yes, it's an approximation that will likely never be 100% accurate. But what matters is whether it's good enough to be getting on with, even as scientists work on developing better models and better understanding the Earth climate system.
Of course, some of the components of the Earth climate are amenable to simpler forms of experiment, such as (to the best of my lay knowledge) analysis of the radiative properties of greenhouse gases. And, as noted by Kevn C, such analysis (as well as research into paleoclimate), rather than modeling, is what has led to our current understanding of climate.
The bottom line is that our current understanding of the physics, of paleoclimate, and the current results of modeling, all are more than enough to be getting on with - particularly if what we are getting on with is coming to terms with the fact that we simply cannot continue to increase the concentration of long-lived greenhouse gases in the atmosphere if we want to avoid very unpleasant consequences.
-
Dikran Marsupial at 20:53 PM on 17 October 2013Why Curry, McIntyre, and Co. are Still Wrong about IPCC Climate Model Accuracy
In my opinion, SASM's responses to my questions demonstrate that he has no substantive point to make and is essentially just trolling. His comments also show quite astonishing level of hubris and evidence of the Dunning-Kruger effect, so I susggest that we no longer indulge this sort of behaviour.
Question 1:
SASM wrote "only that we should not rely upon model projections as a basis of making policy decisions."
So I asked "O.K., so if we are not going to use models that embody what we know of climate physics, specifically what should we use as the basis for policy decisions?"
SASM replied "I believe we should use science, and models can be part of that. ..." This is an evasive answer, which basically is a tacit admission that SASM has no suggestion of any alternative to the models (which are essentially a distillation of what we know about the science. My question was designed to discover whether SASM actually had a substantive point to make, and it appears that he does not.
SASM continues "I build models and pilots literally risk their lives on them (humbling thought to me), but we test the crap out of them." This is an example of the hubris I mentioned, SASM assumes that the scientists have not "tested the crap out of them" and has not bothered to find out. The models are tested in what are called "model intercomparison projects", with acronyms that end in "MIP". There are dozens of them (of which CMIP3 and CMIP5 are merely the best known, there are also AOMIP, ARMIP, AMIP, TransCom, CCMLP, C20C, C4MIP, DYNAMO, EMDI, EMICs, ENSIP, GABLS, GCSS, GRIPS, GLACE, GSWP, MMII, OCMIP, OMIP, PMIP, PILPS, PIRCS, RMIP, SMIP-2, SMIP-2/HFP, SIMIP, SnowMIP, SWING, SGMIP, STOIC etc (see McGuffie and Henderson-Sellers, "A Climate Modelling Primer", Wiley, table 6.5 for more details). SASM is essentially indulging in boasting, suggesting that his field is superior to climate modelling, without actually bothering to find out what climate modelling involves. This is a classic symptom of Dunning-Kruger syndrome.
SASM continues "I explain fully the uncertainties we know about and when and where things are not accurate." Which is exactly what the climate modellers do, which is the point of running all the model intercomparison projects.
SASM continues "I am not confident at all that current climate models are accurate." but cannot suggest any other approach, which is the point. Sometimes decisions have to be made under uncertainty, and it would be irrational to ignore the best source of information we have on what is likely to ocurr in the future just because it isn't perfect. As I said, SASM has no substantive point to make.
Question 2
SASM wrote: "They have not passed enough testing and verification for them to have that kind of power."
So I asked "Please specify how much testing and verification would be required for you to accept their use as a basis for policy making."
SASM replied "Wow, this is a hard question to answer. There is not a defined amount, but a range of testing." Again, SASM ducked the question. The reason I asked the question was to see if there actually was some feasible test that would satisfy SASM's concern, or not. His answer strongly suggests that no amount of testing that could be performed would satisfy SASM and that in fact it is just a way of avoiding accepting what the models say, no matter what. In other words, just trolling with no scientific point to make.
SASM continues "There is unit testing, and depending on the subsystem, it may get a lot more testing. ... This is where we go fly a test, measure a bunch of data, and then compare it to model predictions." This is just more posturing and hubris. Climate modellers know about unit testing as well, and the also perform testing against observations, which is what all those MIPs are for.
SASM continues "Validating climate models is hard because we cannot test against very accurate data sets for very long. Hindcasting isn’t accurate enough because the uncertainties of climate conditions are much larger than the CO2 signal." Again, this is an indication that no test that could be performed will satisfy SASM, because the data will always not be accurate enough (for some unspecified reason). The second sentence is also an unsupported assertion, that is at odds with what we currently know about climate variability (this is another example of hubris).
Question 3
I asked “Lastly, please explain why you have not mentioned the occasions where models have under-predicted the effects of climate change.”
"I don’t think it matters -- wrong is wrong." Again an evasive answer. It actually matters quite a lot. If the models more frequently under-predicted the warming than over-predicted it, that would imply we should make greater efforts to mitigate against climate change. The fact that SASM is apparently only interested in where the model over-predicts in combination with his previous comment "The concern I have about all of this is how policy developers and those with an agenda try to take the model results and over inflate them in an attempt to redirect the economy. That is big money, and if we’re going to spend a large part of the world’s GDP, we’d better be very certain of the reason." suggests that science is being used here as a smokescreen for economics/politics. Evading the direct question is merely evidence to support this hypothesis.
SASM made things worse by writing "Any model projection data in Tom’s chart prior to 1992 is a little suspect. I am certain that models did not correctly call the Mt Pinatubo eruption, so the projection dip in the early 1990’s has to have been a retro active adjustment to account for Mt Pinatubo." This is astonishing hubris as it just shows that SASM has no real idea of how climate models work. Volcanic activity is a forcing, i.e. it is an input to the model. Observed forcings are used in making hindcasts, and the test is to see whether the model produces the correct response to the input. In fact models were used to predict the effects of Pinatubo in advance as a test of the models. It is ironic that you should be so certain of "retroactive adjustment", when you could easily have dound out with the slightest amount of checking your facts. Instead SASM chooses to make some thinly veiled slurrs "This is a completely reasonable thing to do, but has anything else been done to make the models look better in the past? That is the good thing about the recent model projections – they are well recorded in IPCC documentation and the Internet, so trying to move the goal post is very hard." implying that goal posts had been moved in the past.
On ApopheniaSASM wrote "Or that statistics has shown that what appears as a long term (100+ year) sine wave in the SOI really is not there?"
You have normal scientific process exactly reversed there. If someone wants to assert that there is a long term cycle there, the onus is on them to demonstrate that the observations are not explainable by random chance (under some suitable non-straw man null hypothesis). That is the way statistical hypothesis testing works. Of course occasionally papers get published (such as the Stadium Wave idea) and (while they may be interesting hypotheses) generally only use a straw man null-hypothesis, or don't actually perform a statistical test and generally have no plausible physical mechanism that can explain the size of the effect. The litterature is full of such papers, and so far they have generally led nowhere.SASM wrote "My impression is that models assume ENSO, AMO, PDO average out to zero." Again, more hubris, that ENSO/AMO/PDO may average out to zero in the long term may be a valid conclusion to draw fromthe models, it certainly isn't an assumption built into them.
-
Kevin C at 19:52 PM on 17 October 2013Why trust climate models? It’s a matter of simple science
Very good summary - thanks to Scott and Ars for allowing the reposting.
However, given how easy it is to be distracted by rhetocial misdirections, I think it might be helpful to add one bit of context. The skeptic claim quoted at the start
“That’s all based on models, and you can make a model say anything you want.”
is false in both its first and second clauses. Our understanding of future climate is not all based on models. If we were to throw the models away as useless, we would still have a good idea of where we're going, because we can predict future climate on the basis of past climate over a whole range of timescales.
-
panzerboy at 18:46 PM on 17 October 2013Two degrees: how we imagine climate change
Alex Sen Gupta's comment on the conversation suggests the natural changes are "more likely 30x slower" than human. I particulary like
"Exaggeration on either side of the fence is unacceptable. Please check your facts, its bad enough getting nonsense from the skeptics..."
If only I could have said it so well.
https://theconversation.com/two-degrees-how-we-imagine-climate-change-18035#comment_222606
-
Tom Curtis at 16:28 PM on 17 October 2013Why Curry, McIntyre, and Co. are Still Wrong about IPCC Climate Model Accuracy
60 Year cycle in the SOI?
I think not:

SASM, you should know better than to assert the existance of such a cycle based on just one "cycle" length of data, as in the inset of my graph @159, particularly given that the full series was displayed @69 of this discussion. I note that even the appearance of a period in the data since 1975 comes almost entirely from the solid sequence of 5 El Nino's in succession in the early 1990's, and the concidence that over the last decade El Nino's (when occuring) have got successively weaker as the La Nina's have got successively stronger. There may possibly be reason for this as a response to forcing (although I know of no evidence to that effect). There is certainly no reason to think that these two occurences, without precedent in the rest of the record, consist of part of a cyclical pattern.
-
shoyemore at 16:04 PM on 17 October 2013Time to change how the IPCC reports?
It seems incredible that we wil have to wait 6 years for the next IPCC Report, and this one is already out of date.
Why not a shorter "State of the Global Climate" Report in 2 or 3 years? I agree that the emphasis should move to policy-based reports.
-
panzerboy at 15:09 PM on 17 October 2013Two degrees: how we imagine climate change
Chriskoz,
Sorry that was a typo no offense intended.
Moderator.
I am a regular, daily reader of skeptical science. I'm a programmer not a scientist so I post rarely.
I am genually confused by the statements that events of the last ice age happened 18,000 years ago over a timeframe of 'hundreds of years'. That Ice age was 2 degrees celsius different?
Why shouln't I conclude that the author meant 10,000 times the rate of those 'hundreds of years', I don't see how to read that any differently.
I'm sure a denier would have much fun with this arithmetic. The admittedly clumsy accusation of alarmism was intended to highlight what I think is a gift of ammunition to the deniers.
I think I get it, climate may cool down into ice ages fast, 'hundreds of years'.
But they recover slowly? Over thousands of years.
The following from wikipedia suggests the opposite. The recover in a few thousand years but slide into ice ages over 1 hundred thousand years.
http://upload.wikimedia.org/wikipedia/commons/b/b8/Vostok_Petit_data.svg
So ten thousand times the rate of ? four thousand years is still a little under 5 months.
Perhaps someone could point out where this 10,000 times rate comes from, or the error in my arithmetic?
Jeremy Thomson
(I'm no troll, thats my real name I just prefer to post in blogs using the panzerboy account name)
Moderator Response:[JH] Thank you for the clarification. Please take the time to carefully review your draft comments before posting them.
-
StealthAircraftSoftwareModeler at 14:20 PM on 17 October 2013Why Curry, McIntyre, and Co. are Still Wrong about IPCC Climate Model Accuracy
I’m trying to answer all the questions. I thought I had indirectly answered them but it appears not. So, here are explicit answers to questions in reverse order of posting.
Tom Curtis @177: Yes, I agree with your statement that short baselines are not fair in determining whether or not climate models fail or not. However, I do not think I was doing that. I only tried to reproduce the draft chart (left chart) with original source data, and I did that. You don’t think 1990 is a good start because that is only 23 years ago and we need at least 30 years. Okay, I can accept that. I’d reference Spencer’s chart here, but there is no need, other than to say “shame on him” for using a fake Time cover. You *can* expect more from me, I promise. But I do not like trend lines because if they are long then it takes a long time to detect a change. As an example, I could fit a line to the last 100 years of data, and even if temps plunged back down to -0.5C, it would take a long time for the trend line to change. Please give me the return courtesy of acknowledging that point.
Dikran @ 175: I read some links on SkS when I searched “climastrology” and none applied to my observation. I believe you mean Apophenia (http://en.wikipedia.org/wiki/Apophenia), which is seeing things in random data. I’m familiar with it -- children seeing animals in clouds is a classic example. Are you asserting that I am “seeing things” and that SOI oscillations are short term and there are no multi-decadal oscillations? Or that statistics has shown that what appears as a long term (100+ year) sine wave in the SOI really is not there? I’d like to see those results. Wyatt’s and Curry’s Stadium Wave paper (I’ve posted links or you can Google it) talks exactly to the issue that there *are* long oscillations in the AMO and PDO. How do climate models represent these major and oscillating climate drivers? My impression is that models assume ENSO, AMO, PDO average out to zero. Which could be an enormous source of error, and it wouldn’t show up in hindcasting, but it would show up when the large oscillation changes phase, like the last decade. In examining Tom’s SOI chart @159, it is clear that SOI peaked in 1983 and 1998, and since 1998 it has been plunging. And most of the SOI was pretty high from 1975 to early 2000, which is where all of the warming has occurred since 1950. Could be something, or it could be apophenia again.
Dikran @166: The specific questions you want answered:
“O.K., so if we are not going to use models that embody what we know of climate physics, specifically what should we use as the basis for policy decisions?” I believe we should use science, and models can be part of that. I build models and pilots literally risk their lives on them (humbling thought to me), but we test the crap out of them. I explain fully the uncertainties we know about and when and where things are not accurate.I am not confident at all that current climate models are accurate.
“Please specify how much testing and verification would be required for you to accept their use as a basis for policy making.” Wow, this is a hard question to answer. There is not a defined amount, but a range of testing. There is unit testing, and depending on the subsystem, it may get a lot more testing. Most tests are designed to confirm requirements are met, so those types of tests a well defined. The hard tests are to match modeling with measurements. This is where we go fly a test, measure a bunch of data, and then compare it to model predictions. Trying to figure out differences can be very hard. Is it the model, was it random noisy world effects, was the test instrumentation calibrated, and so on. Validation testing of a model is more of an evolving process based on the model than a check list. Validating climate models is hard because we cannot test against very accurate data sets for very long. Hindcasting isn’t accurate enough because the uncertainties of climate conditions are much larger than the CO2 signal.
“Lastly, please explain why you have not mentioned the occasions where models have under-predicted the effects of climate change.” I don’t think it matters -- wrong is wrong. Any model projection data in Tom’s chart prior to 1992 is a little suspect. I am certain that models did not correctly call the Mt Pinatubo eruption, so the projection dip in the early 1990’s has to have been a retro active adjustment to account for Mt Pinatubo. This is a completely reasonable thing to do, but has anything else been done to make the models look better in the past? That is the good thing about the recent model projections – they are well recorded in IPCC documentation and the Internet, so trying to move the goal post is very hard.
Moderator Response:[Rob P] - a portion of this reply addressing a 'dogpiling' comment has been deleted
-
chriskoz at 12:03 PM on 17 October 2013Time to change how the IPCC reports?
Tom@1,
Some aspects of Kevin's suggestion are reasonable and should not be portaryed as "a concession of defeat in its (IPCC) current mission". BTW, deniers are and will be trying to downplay/denigrade inconvenient science no matter how presented.
For example, here:
It no longer makes sense for the activities of Working Group 1 (which assesses the physical scientific aspects of the climate system and climate change) and those of Working Group 2 (which looks at impacts, adaptation and options for coping with climate change) to be separated
I tend to agree. There might be no point in analysing certain aspecte of climate science over and over because it's settle science. I think no one disputes that human CO2 emissons are causing warming (except lunatics), even policy makers-deniers like Tony Abbott acceptsa that, so WG1 report should be scaled down. However, the same Abbott denies that CTax/ETS is the effective market way to tackle the emission, so WG2/3 reports should be scaled up as they are needed now more than ever.
-
scaddenp at 11:43 AM on 17 October 2013Arctic sea ice has recovered
...and US government shutdown is making data they need unavailable delaying the run.
-
scaddenp at 11:41 AM on 17 October 2013Arctic sea ice has recovered
William, ice volume is not measured directly but calculated via the PIOMAS model. This is done monthly. You can get details here
-
william5331 at 11:33 AM on 17 October 2013Arctic sea ice has recovered
What I would like to know is why the ESA is not publishing a constantly updated graph of ice volume from cryosat as NSIDC does on ice extent. The weather patterns we have had in the summer of 2013 have a tendency to spread ice out (coriolis) and anything over 15% ice cover is recorded by NSIDC as full coverage. The increase in ice extent may be an reading glitch, at least to some extent. The ice volume results should clear up by how much the ice has actually increased between the middle of Sept 2012 and 2013 but the ESA seems oddly reluctant to tell us what their results are.
-
vrooomie at 08:47 AM on 17 October 2013Why Curry, McIntyre, and Co. are Still Wrong about IPCC Climate Model Accuracy
SASM, per Tom Curtis's post nu. 177, I, too, am not pursuing other questionable statements you have made until such time as you have answered his, and other's, questions.
-
nhthinker at 08:15 AM on 17 October 2013Understanding the pre-IPCC Anti-Climate Science Misinformation Blitz
My claim#32: "Annual Global Mean Surface temperature is the only metric that the general media actually reports that scientists use to measure the impacts of the the enhanced greenhouse effect on the Earth's climate system."
grindupBaker #42: "So it is patently absurd to say that "global warming" is only an increase in atmospheric heat content and when I find that climate scientist you say told IPCC to say that I'll chastize him/her severely."
Show me a single media report that puts a number range on the predicted mean ocean temperature rise in the next 100 years due to global warming as it does for atmospheric temperatures. I have not seen one. Googling it doesn't show one either. So if you have data that conflicts with my claim/assertion, please provide it.
-
Tom Curtis at 06:38 AM on 17 October 2013Time to change how the IPCC reports?
With the greatest respect for Kevin Trenberth, I disagree. The IPCC provides an impartial, conservative benchmark on the state of climate science. As a consequence, its reports have a substantial impact in convincing the general society of the reality, and danger of climate change. It is for that reason the denier movement expends so much energy in attacking the IPCC. If the IPCC substantially changes its mission, that will be portrayed by deniers as a concession of defeat in its current mission, a portrayal that will resonate with the public. Therefore such a move would be a backward step in attempts to get global policy settings that will adequately tackle climate change.
-
Tom Curtis at 06:29 AM on 17 October 2013Why Curry, McIntyre, and Co. are Still Wrong about IPCC Climate Model Accuracy
SASM @170, my post @169 ended with a very clear statement:
"I expect you to at least acknowledge that the use of short baselines is bad practise, and should not be done for purposes of illustration nor in attempting to establish whether or not the observations have fallen outside the predicted range."
Absent such an acknowledgement by you, there is no point in pursuing more complex issues with regards to models than their ability to predict GMST. If you cannot bring yourself to acknowledge very basic standards of practise when it comes to testing predictions, complicating the topic, in addition to being off topic in this thread (IMO) will simply multiply the opportunity for evasion. Indeed, evasion appears to me to be the purpose of your post @170.Consequently, absent a clear acknowledgement by you of the inappropriateness of short baselines in model/observation comparisons, or a clear and cogent defence of the practise despite the twin disadvantages of eraticness and overstating of differnces in behaviour based on differences in variability, there is no point if further pursuing this (or any) topic with you.
I ask that other posters likewise decline to participate in your distractions until we have a clear statement by you on this point.
Moderator Response:[JH] You have read my mind. I encourage your fellow commenters to follow your recommendation.
-
Dikran Marsupial at 05:21 AM on 17 October 2013Why Curry, McIntyre, and Co. are Still Wrong about IPCC Climate Model Accuracy
SASM wrote "You guys see that?"
The human eye is very good at seeing spurious patterns in noisy data, which is why scientists use statistics, if only as a sanity check. There are plenty of articles on SkS that deal with "climastrology", I suggest you read some of them before continuing this line of reasoning, you will find it is nothing new and not well founded.
-
Dikran Marsupial at 03:43 AM on 17 October 2013Why Curry, McIntyre, and Co. are Still Wrong about IPCC Climate Model Accuracy
SASM If there was a serious inconsistency between the models and observations since 1950 (!) the skeptics might just have pointed it out by now, for that matter the modellers themselves might just have noticed and done something about it. Where there actually is a serious inconsistency (e.g. Arctic sea ice), the modellers are generally very happy to discuss it, that is what they do for a living.
Please could you clarify your position by answering the questions I asked earlier (at least the first two).
-
william5331 at 03:36 AM on 17 October 20132013 SkS Weekly News Roundup #42A
Can't remember where I saw the article but some work on stalegtites suggested that Aus has a 200 year cycle of drought and wet. The article suggested she has just ended a wet period!!!!??. If the past few decades were wet what must the dry look like. Add in climate change and I think I would immigrate to somewhere else.
-
StealthAircraftSoftwareModeler at 03:34 AM on 17 October 2013Why Curry, McIntyre, and Co. are Still Wrong about IPCC Climate Model Accuracy
I didn’t think 63 years – from 1950 until today – was short term at all. Perhaps it is, or we’re miscommunicating. I’d like to see model projections for air temp, sea temp, humidity, cloud cover, and precipitation, just as it has been shown for only air temperature. Take the IPCC’s chart, or better yet, Tom Curtis’ chart @159 and so me the model projections for air temp, sea temp, humidity, cloud cover, and precipitation. Is that an unreasonable request or do you think it will have meaningless implications?
Moderator Response:[JH] Your requests for the forecasts of the indicators that you have listed should be directed to the organizations who actually develop and maintain the GCMs. Please let us know if you need contact information for these organizations.
-
StealthAircraftSoftwareModeler at 01:45 AM on 17 October 2013Why Curry, McIntyre, and Co. are Still Wrong about IPCC Climate Model Accuracy
Tom Curtis @168: “this illustrates the absurdity of SASM's approach of testing models against just one value”, you know, I had this very thought last night, and I agree with you totally.
The model ensembles show air temperature, but as this site has pointed out (presumably correctly), on the order of 90% of the energy goes into the oceans. Due to this, air temperature is almost irrelevant to the system. So, what would be a meaningful and informative test of climate models? How far back to look and what to examine or measure?
I do not think the models can properly represent the various components of the earth’s energy budget, all of which combine to produce an average air temperature. Air temperature is what everyone worries about the most, but that is just 1/3000th of the heat capacity of the earth, by volume. Since air is mostly warmed indirectly, it is important to correctly model the things that heat the air. In order for me to have a sliver of confidence in a climate model, I’d want to see that a model can reasonably** project changes in the energy budget, say: air temp, sea temp, humidity, cloud cover, and precipitation. If you have opinions about other or different drivers, then I’d like to hear about them.
I think these are the major components to the energy budget, and I’m only looking for global averages. I am not expecting climate models to able to predict when it will rain at some location. If climate scientists and modelers have a good handle on climate physics, then they should be able to do a reasonable** job at projecting the annual global average of these values. Let’s start from 1950, which is where the IPCC says our AGW effects start. Can anyone plot the model average and +/- 2.5%ile bounds for these values along with actual measured data? Or, can someone point me to a paper to covering this? I’d be stunned if someone has not already done this analysis.
**reasonable: let’s define “reasonable” as getting the trend direction correct. If a model projects one of these components to go up over the last 63 years, but it goes down, then the model is wrong for that component. If the model is wrong on several components, then how can anyone conclude they are correctly modeling the climate?
-
Synapsid at 00:35 AM on 17 October 20132013 SkS Weekly News Roundup #42A
numerobis:
Pipelines are necessary to increase production if you listen to CEOs; there's money in pipelines. It's much faster to expand shipping by rail, though, than it is to build a pipeline; cheaper too, and rail allows great flexibility in supplying markets. Both are being used, and it's rapid growth in rail transport that is allowing rapid increase in export from Canada. Sideshow? I said that Keystone XL is a sideshow compared to coal, not that pipelines are a sideshow.
Nor did I say oil is less important to stop than coal is. Coal has much greater potential for future harm than oil has but, at least if you consider informing the public important, it gets far less attention than Keystone XL does and that imbalance should be fixed.
-
funglestrumpet at 00:32 AM on 17 October 20132013 SkS Weekly News Roundup #42A
The link to the Coming Plague article appears to be broken, or my computer is having another one of its funny turns.
Moderator Response:[JH] The link has been fixed. Thank you for bringing this glitch to our attention.
-
numerobis at 23:52 PM on 16 October 20132013 SkS Weekly News Roundup #42A
"In 2012 Canada exported more oil, crude plus concentrate in industry terms, than in any previous year; the total for 2013 will be higher" -- how does this make it *less* important to stop?
You seem to have bought the oil company claim that the pipelines are a sideshow; without pipelines, they'll just ship it by train. This is their message to those who want to limit production. They have another message to those who want to maximize short-term $$$, which is that the pipelines are absolutely crucial to increase production.
Moderator Response:[JH] To whom is your comment directed?
-
Leto at 21:44 PM on 16 October 2013Why Curry, McIntyre, and Co. are Still Wrong about IPCC Climate Model Accuracy
Thanks Tom@168.
I was aware of Kosaka and Xie. Their approach is interesting, but potentially open to the charge (by motivated parties) that the close match they demonstrated merely reflects that the model was constrained by reality, and hence matched reality. (The model was not actually tightly constrained, but we all know contrarians have run with weaker material.)I was hoping that a few unconstrained model runs had chanced upon an ENSO profile similar to reality. For instance, if all model runs in the ensemble were ranked according to their mean squared SOI error with respect to the historical SOI, I would expect that the best-matched quartile (top 25% of runs in the ranking) would match reality more closely than other quartiles. After all, the models' developers never claimed to be able to predict ENSO conditions, so it would be nice to minimise the effects of ENSO mismatch. This would support the notion that the minor, statistically insignificant divergence between the ensemble mean and observational record (over some timeframes) is largely due to an el nino in 1998 followed by la nina and neutral conditions for many of the following years. It is a shame if this type of data is not available in the public domain.
Of course, if the science were being conducted in an ideologically neutral environment, such an obvious issue would not draw so much attention in the first place, and I would not propose such an analysis. For me, the Nielsen-Gammon plot, mentioned in several threads here at SkS, says it all.
-
Tom Curtis at 21:03 PM on 16 October 2013Why Curry, McIntyre, and Co. are Still Wrong about IPCC Climate Model Accuracy
Leto @162, I am not sure that that can usefully be done. However, Kosaka and Xie have gone one better. They took a model, constrained the tropical pacific temperature values to historical values to force it to adopt the historical ENSO record, and compared that to observations:
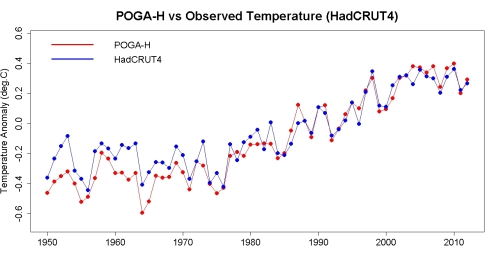
Tamino's discussion (from which I draw the graph) is very informative.
To bring that back to the discussion on hand, I checked the 1990-2012 temperature trend of that model when run with the CMIP3 experiment. It was 0.317 C/decade. That puts it at the 80.8th percentile, and definitely one of the fastest warming models. Yet when constrained to historical ENSO fluctuations, it almost exactly matches the HadCRUT4 record.
This, I think, illustrates the absurdity of SASM's approach of testing models against just one value, and if they almost (but not quite) fail the test, rejecting them as completely irrelevant as a basis of information.
-
Tom Curtis at 20:35 PM on 16 October 2013Why Curry, McIntyre, and Co. are Still Wrong about IPCC Climate Model Accuracy
SASM @165, unfortunately, I do not think you understand my position. In particular, I was not criticizing your choice of baseline on the basis that it makes the observations look cool. On the contrary, a 1990 baseline makes the observations look warm. The emphasis on that point is so that my allies pick up on the fact. Intuitively, we would expect a 1990 baseline to cause the observations to look cool, for 1990 is a local high point in the observations. However, that is not the case, for though the observations are warm, the ensemble mean is warmer still relative to adjacent years. Thus, if anything, a 1990 baseline is favourable to a defence of the validity of models.
But it is still wrong.
It is wrong, basically, because you have to analyze the data as you motivated me to do to know whether it is favourable, unfavourable or neutral with regard to any position. The only way to avoid that necessity is to use a long (thirty year) baseline so that the baseline is robust with respect to time period used. Ideally, we should use the long baseline that minimizes the Root Mean Squared Error (RMSE) between the observation and the ensemble mean. By doing so, we ensure that any discrepancy between observations and ensemble are real, ie, are not artifacts of an ill chosen baseline.
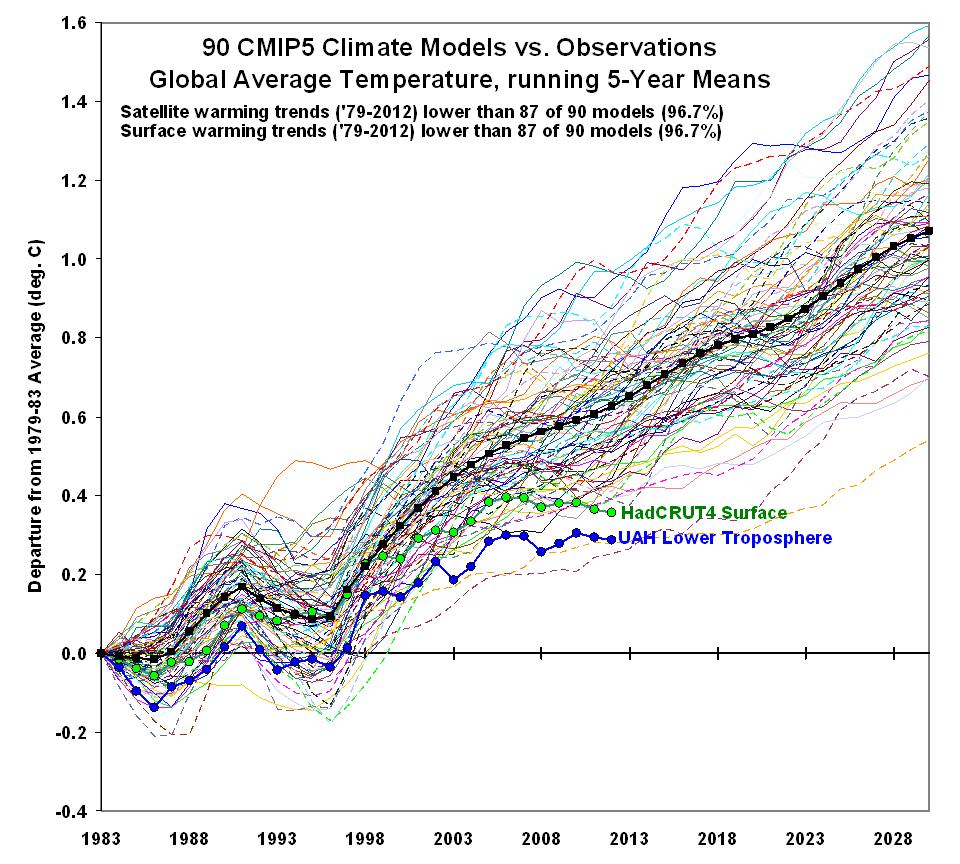
The impact of short baselines is shown by KR's graph @164. The UAH temperature record is far more sensitive to ENSO fluctations than any surface record. As a result, the inclusion of the strong El Nino of 1983 in a short baseline period artificially displaces the UAH record downwards with respect to HadCRUT4 (and both HadCRUT4 and UAH downward with respect to the ensemble mean).
The crux is this: Spencer (and you and McIntyre) have created graphs to illustrate the relationship between observations and models. Yet all of you have adopted non-standard conventions, the effect of which is to show a greater disparity than actually exists. This is achieved by three different methods in the three cases (and I have only discussed Spencer's method so far), but is the case none-the-less. Now, to the extent that you intend an honest comparison, you would avoid any method that might accidentally result in showing a greater disparity (if that is what you are trying to demonstrate). Short term baselining is a method that will have that effect. When it is adopted to compare data with known large differences in variance (as, for example, HadCRUT4 and UAH) it is scientific malpractice. It is, not to put to fine a point on it, the sort of thing I would expect from a person who uses a known faked Time magazine cover to establish a rhetorical point, and who refuses to take it down, issue a correction or acknowledge the fault when corrected by others.
I expect better of you than of Spencer. I expect you to at least acknowledge that the use of short baselines is bad practise, and should not be done for purposes of illustration nor in attempting to establish whether or not the observations have fallen outside the predicted range.
-
Dikran Marsupial at 17:11 PM on 16 October 2013Why Curry, McIntyre, and Co. are Still Wrong about IPCC Climate Model Accuracy
SASM wrote "only that we should not rely upon model projections as a basis of making policy decisions."
O.K., so if we are not going to use models that embody what we know of climate physics, specifically what should we use as the basis for policy decisions?
"They have not passed enough testing and verification for them to have that kind of power."
Please specify how much testing and verification would be required for you to accept their use as a basis for policy making.
Lastly, please explain why you have not mentioned the occasions where models have under-predicted the effects of climate change.
-
Synapsid at 16:24 PM on 16 October 20132013 SkS Weekly News Roundup #42A
We should get off fossil fuels, no argument. That won't happen overnight; where should effort to reduce their use be concentrated?
Consider two of the articles in this roundup:
Group blasts oil sands in US (refers to Canadian oil sands)
World coal consumption to pass oil by 2020 due to rising demand in China and India.
I'd say the target should be coal, to a much greater extent than we see presently in the various news sources. Producing and burning coal releases more CO2 than does production and burning of oil, even oil-sands oil, and heavy metals and other undesirables as well. And coal is widespread on the planet, and relatively easy to obtain compared to oil, especially the deep-water oil and the shale oil both of which are expensive to get, and which (together with Canadian oil sands) have provided most of the growth in oil production in the US and Canada--and that means in the world.
There has been pretty much a plateau in oil production worldwide for about eight years (the growth in Canadian and US production has been balanced by production decreases outside those two countries) but China and India are driving growth in coal production and use at a scary rate. Coal is the big challenge.
Keystone XL is a sideshow compared to coal. The White House has approval authority only over the part of the pipeline that crosses the US/Canada border, a matter of miles. Holding up approving or denying the permit has resulted in railways stepping in to transport crude oil from the oil sands (and the Bakken in the US), notably Canadian National, Canadian Pacific and Burlington Northern, to the Gulf Coast and to the eastern US especially, and to refineries on the West Coast too. In 2012 Canada exported more oil, crude plus concentrate in industry terms, than in any previous year; the total for 2013 will be higher. This is being done without White House approval because most of the four-part Keystone XL system is not subject to it.
Canadian crude was selling at a whopping discount for more than a year because there was a backup and thus a glut in the US Midwest, at Cushing, Oklahoma. That glut is being drained because of new pipeline capacity and reversal of pipelines that had carried oil to Cushing instead of south to the refineries at the Gulf Coast, and that reduction of glut will increase when the southern portion of Keystone XL becomes operational by the end of the year or soon after. Prices paid for Canadian crude have risen as a result, and that is incentive for oil-sands development. Canada is looking at shipping oil-sands crude from Alberta to refineries in eastern Canada which have been importing more expensive West African and other crudes, and that will boost the oil sands too.
There are already half a dozen pipelines carrying Canadian oil into the US and two of them, TransMountain from Alberta to Vancouver/Burnaby with a side branch to Washington state, and Enbridge's Midwest complex, are planned to be expanded along routes that already have the necessary approvals, and each of those expansions will result in capacity that will be greater than the planned capacity of Keystone XL.
The oil sands are booming because the demand is there, and the oil is flowing into the US in record volumes, without Keystone XL having had approval. This flow will increase. Shift the attention and publicity more to reducing coal use--and export: the US is the fourth largest exporter of coal in the world--and away from the small part of Keystone XL where so much of it has been focused.
-
StealthAircraftSoftwareModeler at 13:20 PM on 16 October 2013Why Curry, McIntyre, and Co. are Still Wrong about IPCC Climate Model Accuracy
Dikran @161: I frequently use the quote, “all models are wrong, but some are more useful than others.” I have never said that climate models are not useful, only that we should not rely upon model projections as a basis of making policy decisions. They have not passed enough testing and verification for them to have that kind of power.
[text deleted here - reply to deleted comment (dogpiling)]
Tom Curits @164: I understand your position fully. I hate that you took so much time building charts to prove it. There are always problems on selecting the origin. I wasn’t trying to rig the chart to push the ensemble to the high side; I just used the starting date in the draft IPCC chart. I admit that 1990 +/- was a little bit of a warm year. So, let’s just focus on your chart @ 159. Can you compute the trend lines for the four anomaly curves without forcing all the lines to a common origin? In other words, compute the best fit line from 1983 to 2015 for each of the anomalies, or post the spreadsheet data somewhere and I’ll do it. The start point for each trend line should be on a vertical line at 1983. If you want to pick a different starting year that is fine too.
Moderator Response:[JH] You have made your points ad naseum and are now skating on the thin ice of excessive repetition. Please cease and desist or face the consequences.
[Rob P] Text removed from comment for the reason outlined above.
-
Why Curry, McIntyre, and Co. are Still Wrong about IPCC Climate Model Accuracy
Regarding Spencer's chart, here are the HadCRUT4 (red) and UAH 5-year means - baselined to 1980-1999 (green) and Spencer and Christy's 1979-1983 extrema value (blue):
Note how the Spencer and Cristy running mean UAH temps remain entirely below HadCRUT4 for the entire period - a clear sign of incorrect baselining, as they do not have common grounds from which to judge departures.
-
scaddenp at 12:36 PM on 16 October 2013A Rough Guide to the Jet Stream: what it is, how it works and how it is responding to enhanced Arctic warming
Gee, pseudoscience from people that cant comprehend arithmetic (like A>>b). If you think this is science, then perhaps you are in market for a DNA upgrade too.
(yes, I know this is going to be moderated out).
-
chriskoz at 12:05 PM on 16 October 2013Two degrees: how we imagine climate change
JH@5,
I think panzerboy priviledges should be revoked at this point.
not only did he badly distort the meaning of my post in a very careless manner, but he also distort my name to cap it up. Not that I particularly care about the latter but others might do. SkS standards should not tolerate such poor quality comments.
Moderator Response:[JH] I suspect that panzerboy is nothing more than a drive-by denier drone. If I had the authority to do so, I would immediately revoke his posting privileges. Alas, i do not have such authority.
-
Bert from Eltham at 10:31 AM on 16 October 2013Consensus study most downloaded paper in all Institute of Physics journals
What is abundantly clear, is that a refereed paper that measures or evaluates the reality of twenty years of thousands of refereed papers is a major counter to the false campaign of the deniers that attempt to throw doubt on real science with a pathetic litany of half truths and a very poorly argued inconsistent delusional world view. Bert
-
Tom Curtis at 09:02 AM on 16 October 2013Why Curry, McIntyre, and Co. are Still Wrong about IPCC Climate Model Accuracy
SASM @160, I have to disagree with your claim that the charts discussed "are all basically the same". For a start, your chart, Spencer's chart, and the 2nd order draft chart from the IPCC all use single years, or very short periods to baseline observations relative to the model ensemble mean. In your, and Spencer's case, you baseline of a five year moving average, effectively making the baseline 1988-1992 (you) or 1979-1983 (Spencer). The 2nd Order draft, of course, baselines the observations to models of the single year of 1990.
The first, and most important, problem with such short period baselines is that they are eratic. If a 1979-1983 base line is acceptable, then a 1985-1989 base line should be equally acceptable. The later baseline, however, raises the observations relative to the ensemble mean by 0.11 C, or from the 1.5th to the 2.5th percentile. Should considerations of whether a model has been falsified or not depend on such erratic baselining decisions?
Use of a single year baseline means offsets can vary by 0.25 C over just a few years (CMIP3 comparison), while with the five year mean it can vary by 0.15 C (CMIP5 comparison). That is, choice of baselining interval with short baselines can make a difference equal to or greater than the projected decadal warming in the relative positions of observations to model ensemble. When you are only comparing trends or envelope over a decade or two, that is a large difference. It means the conclusion as to whether a model is falsified or not comes down largely to your choice of baseline, ie, a matter of convention.
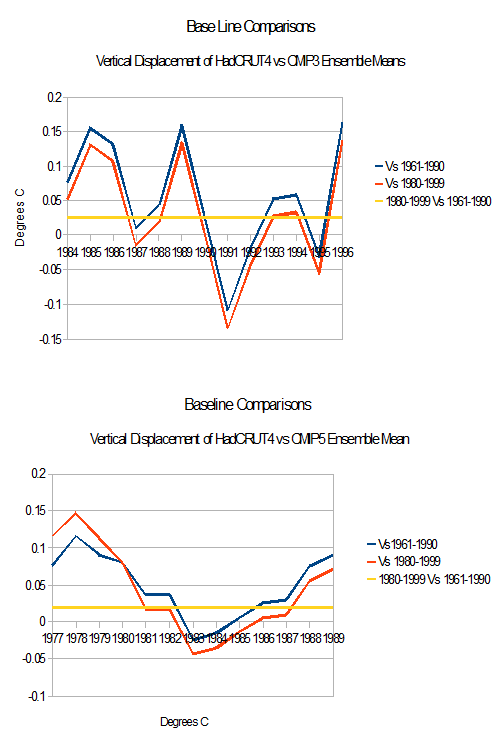
Given this, the only acceptable baselines are ones encompensing multiple decades. Ideally that would be a thirty year period (or more), but the 1980-1999 baseline is certainly acceptable, and necessary if you wish to compare to satellite data.
Spencer's graph is worse than the others in this regard. It picks out as its baseline period the five year interval which generates the largest negative offset of the observations at the start of his interval of interest (1979-2012); and the third largest in the entire interval. Given the frequency with which his charts have this feature, it is as if he were intentionally biasing the display of data. In contrast, the 1990 baseline used by you (as the central value in a five year average) and the 2nd Order draft generates a postive offset relative to the 1961-1990 baseline, and near zero offset relative to the 1980-1999 baseline. Although 1990 is a locally high year in the observational record, it is not as high relative to the ensemble mean as its neighbours. Consequently the 2nd Order draft generates a more favourable comparison then the longer baselines. It is an error, never-the-less, because that is just happenstance.
More later.
-
John Cook at 08:01 AM on 16 October 2013Consensus study most downloaded paper in all Institute of Physics journals
MichaelM, apologies for the video quality but as Kevin C points out, our resources are limited. However, at this blog post, I go into more detail, including making the Powerpoint slides fully available.
There are many different gauges of impact - downloads, tweets, citations, etc. I've read one fascinating paper that found that the number of initial tweets about a paper predict the eventual number of scholarly citations, so they provide an early indication of the long-term impact of a paper. There is similar research regarding the number of downloads of a paper and citations. The point is that the contribution that SkS readers made to make our consensus paper available in a high impact, open-access journal has had a strong, measureable effect by all available metrics.
-
Leto at 07:14 AM on 16 October 2013Why Curry, McIntyre, and Co. are Still Wrong about IPCC Climate Model Accuracy
Tom, and others familiar with the data:
Is it possible to take the model ensemble and purge all those runs that are clearly ENSO-incompatible with the real-world sequence of el ninos and la ninas? (Obviously this begs the question of what counts as incompatible, but reasonable definitions could be devised.) In other words, do the runs have easily extractable SOI-vs-time data?
-
Dikran Marsupial at 04:00 AM on 16 October 2013Why Curry, McIntyre, and Co. are Still Wrong about IPCC Climate Model Accuracy
SASM wrote "inaccurate and falsified"
As GEP Box (who knew a thing or to about models, to say the least) said "all models are wrong, but some are useful". We all know the models are wrong, just look at their projections of Arctic sea ice extent. The fact they get that obviously wrong doesn't mean that the models are not useful, even though they are wrong (as all models are). Of course the reason skeptics don't latch on to this is because it is an area where the models underpredict the warming, so they don't want to draw attention to that.
It seems to me that SASM could do with re-evaluating his/her skepticism, and perhaps ask why it is he/she is drawing attention to the fact that the observations are running close to the bottom of model projections now, but appears to have missed the fact that they exceeded the top of model projections in 1983 (see Toms nice diagram). Did that mean the models were falsified in that year and proven to be under-predicting global warming? Please, lets have some consistency! ;o)
-
A Rough Guide to the Jet Stream: what it is, how it works and how it is responding to enhanced Arctic warming
Jubble - The paper is available at Barnes 2013 (h/t to Google Scholar).
It's only been out a month - it will be interesting to see if her analysis of atmospheric wave patterns holds up.
-
Doug Bostrom at 03:11 AM on 16 October 2013Consensus study most downloaded paper in all Institute of Physics journals
Per Kevin, a casual check w/google scholar shows 20 cites as of today. Not bad, considering how slowly the publication sausage factor generally operates.
This item from the list of work citing Cook et al is particularly interesting for those of us who frequent climate science blogs (the somewhat awkward title isn't reflective of the paper's utility):
Mapping the climate skeptical blogosphere
Figure 1 is fascinating.
-
Jubble at 01:47 AM on 16 October 2013A Rough Guide to the Jet Stream: what it is, how it works and how it is responding to enhanced Arctic warming
I read the article with interest, thank you.
I've just come across this recent paper (Revisiting the evidence linking Arctic Amplification to extreme weather in midlatitudes Elizabeth A. Barnes DOI: 10.1002/grl.50880) that states that "it is demonstrated that previously reported positive trends are an artifact of the methodology".
http://onlinelibrary.wiley.com/doi/10.1002/grl.50880/abstract
I don't have access to the full paper or the background to be able to verify the conclusion in the abstract. What do you think?
-
StealthAircraftSoftwareModeler at 01:37 AM on 16 October 2013Why Curry, McIntyre, and Co. are Still Wrong about IPCC Climate Model Accuracy
Tom Curtis @159: Thanks for the quality posts. If we’re ever in the same town I’d like to buy you a beer or three. I might disagree with you on a few things, but I do appreciate your cogent and respectful posts.
You have drawn another nice chart. I think all of the charts discussed, including your current one, the one I’ve drawn @117, the one drawn by Spencer (http://www.drroyspencer.com/2013/10/maybe-that-ipcc-95-certainty-was-correct-after-all/), McIntyre’s (http://climateaudit.org/2013/10/08/fixing-the-facts-2/) and the two at the top of this page are all basically the same. They show model projections and the temperature data. Dana asserts that IPCC AR5 Figure 1.4 draft (his left chart at the top) was a mistake or has errors, but is now clear to me that it does not have any errors. The draft version (Dana’s left chart) from the IPCC matches the final draft version (Dana’s right chart), it’s just that the IPCC’s final version is zoomed out and harder to see.
This thread has discussed that initial conditions and boundary conditions are important, and using trend lines is important, but I disagree. Plotting model projection lines along with temperature data (not trend lines) much the way I have done, Spencer has done, McIntyre has done, is completely reasonable and meaningful. After all, this is the way the IPCC has drawn the chart in its final draft version (Dana’s right chart).
No matter how you slice it, the global temperature data is running at the very bottom of model projections. I think that falsification of model projections is near. If it temperature continues not warm for another 15 years as theorized by Wyatt’s and Curry’s Stadium Wave paper (http://www.news.gatech.edu/2013/10/10/%E2%80%98stadium-waves%E2%80%99-could-explain-lull-global-warming) then it will be obvious that climate models are inaccurate and falsified.
-
panzerboy at 01:36 AM on 16 October 2013Two degrees: how we imagine climate change
Chriskov @ 3
The 'hundreds of years' and '10,000 times the rate' confused me.
Ten thousand times the rate of 200 years would be a little over a week.
So were going to have 2 degrees C higher average temperaures after a week?!
Perhaps its a typo, perhaps its pure alarmism.
Moderator Response:[JH] Lose the snark, or lose your posting privilege.
-
PhilBMorris at 01:19 AM on 16 October 2013Two degrees: how we imagine climate change
Claude @ 1
2oC is a political target, not one based on science. Nor is it very realistic, given that there's little sign of anything other than BAU. I’d rather assume that Hansen is right – that 2oC is a prescription for disaster – than blindly accept a politically convenient target created simply so that all governments can ‘get on board’. But keeping below 2oC is going to be politically and economically very difficult. Although some people are encouraged by the increase in renewables, the impact of that increase is really very small and will not affect the path we're heading down. Decarbonizing the grid, in itself a major undertaking, will reduce CO2 emissions by just 30%, and would merely delay the inevitable by a few years. Entire manufacturing processes need to be changed to reduce industrial CO2 emissions. But, for example, how do you produce concrete without releasing CO2? And who's going to stop impoverished people in undeveloped nations from continuing to clear land for agriculture, a practice that not only releases CO2 but reduces the ability of the biomass to act as a global sink for CO2? The 2oC 'mantra' is almost as bad as the 'tokenism' individuals are asked to perform (changing out incandescent light bulbs for CFLs or LEDs; turn down the thermostat at night; drive less etc. etc.) as if any of that will make any real difference. Nothing short of massive and rapid investment in both non-fossil fuel sources such as Thorium based nuclear power, and in effective carbon sequestration, will undo what we have done over the past 100 years – and get us back to safe CO2 levels. i.e. 350 ppm.
Prev 816 817 818 819 820 821 822 823 824 825 826 827 828 829 830 831 Next


