


 Arguments


Recent Comments
Prev 827 828 829 830 831 832 833 834 835 836 837 838 839 840 841 842 Next
Comments 41701 to 41750:
-
scaddenp at 09:48 AM on 22 November 2013Global warming since 1997 more than twice as fast as previously estimated, new study shows
SASM, since Manabe models in 1992 were predicting cooling, then isnt that a hint that there is more going on in climate than just CO2? As Dikran said, that's why we build models. I frankly dont expect a plateau at 2000m to respond the same way as seaice at sealevel, but other factors in Antarctica is the circumpolar circulation which isolates the continent (whereas arctic amplification is in part due to circulation); and ozone depletion.
-
StealthAircraftSoftwareModeler at 07:52 AM on 22 November 2013Global warming since 1997 more than twice as fast as previously estimated, new study shows
Dikran @54: What are the “other issues” with UAH and RSS? I’ve researched the difference between UAH, RSS, GIS, HADCRUT, and for the most part the plots are all very similar. While satellites have a wider swing up and down, they all tend to match fairly close. I would not expect a perfect match because each measurement system is measuring different things and locations and at different times.
You mention surface temperatures versus lower troposphere air temps, but what about ocean temperatures (surface and deep) -- which one is most important or the most meaning with respect to AGW?
Since air has such low heat content, I wouldn’t think air temps would be all that important and shouldn’t be the driver of much of anything. Just look at air temperatures in California – on the coast the cool Pacific ocean brings cool air across the land in the sea breeze, but the air doesn’t have to go very far before it gets very hot. The solar energy hitting the ocean and the land is the same. The ocean doesn’t warm quickly, so the cool water from Alaska remains cool for a long time, and cools the air. But the land warms quickly, and hence warms the air in just a few miles. The air temps in Los Angeles on the coast are 60 degrees F and 20 miles inland the air rapidly warms to 100 degrees F. Clearly, in this case, the ocean or land surface temperatures completely control the air temperatures. Since air temperatures can change a lot and quickly based on surface temperatures, I would think measuring lower troposphere with satellites would be the most accurate since it measures more points more frequently.
scaddenp @55:” What is the basis of your claim of cooling?” All the blue and darker green area in Cowtan and Way’s map posted in this article. I just eye-balled the data -- I didn’t integrate it and I understand that there are some odd map projections issues; this is just a vague observation on my part. But clearly, the Artic has warmed way more than the Antarctica region. I just find that very curious. I wouldn’t expect CO2 to cause such asymmetrical warming, so it seems to me that something natural phenomenon is occurring. Perhaps this is support for Judith Curry’s Stadium Wave theory?
-
michael sweet at 07:32 AM on 22 November 2013Will extreme weather like super typhoon Haiyan become the new norm?
Franklefkin:
The steroids in baseball example shows how it is difficult statistically prove the effect of change. A baseball player hits 20 home runs one year without steroids. The next year he takes steroids and hits 30 home runs. You cannot state with confidence that any single home run was hit because of the steroids, but normal people realize that the steroids have influenced the result.
Here is a list of New York Hurricanes going back before 1800. When I read it I see no landfalling storms that were hurricane strength in October. Hurricane Sandy is described as:
"The largest hurricane ever recorded in the Atlantic Basin [just before landfall], wind gusts topped 100 mph in some parts of the New York Metropolitan area."
Please provide a description of a comparable storm in October within 500 miles of New York. This list of New England hurricanes convienently lists the strength of the storms at landfall and lists no hurricanes in October. Hurricane season lasts from June to November in the Carribean sea, where it is warmer. Your assertion that hurricane season lasts until November in New York is "simply not true". It used to be too cold to support hurricanes in New York at the end of October.
James Hansen has shown that most (over 95%) of hot summers are caused by AGW. There is still debate over individual hot events. That does not mean that the individual hot events were not caused by AGW, just that it is difficult to prove. It is very difficult to prove individual events.
The recent tornadoes in Illonois are extremely rare. Jeff Masters states:
Sunday's outbreak will probably rank as the second to fourth most prolific November tornado outbreak since 1950. But what was really remarkable about the outbreak was how far north it extended. With three confirmed tornadoes on Sunday, Michigan has increased its total number November tornadoes observed since 1950 by 50%, from six to nine. Prior to Sunday, Indiana had recorded 57 November tornadoes. That total increased by 26 on Sunday,"
Although he adds that the record is too short to statistically prove anything. How many of those home runs were hit after the steroids?
I claim that extreme events have become so common that normal people now recognize them. Ten years ago only perceptive people who measured carefully (like James Hansen) noticed them. Now, they are obvious but difficult to prove statistically. Your claim that most people do not recognize these as unusual events is simply incorrect.
-
Clouds provide negative feedback
Licorj - See Does positive feedback necessarily mean runaway warming. That would only be true with a feedback gain >1, which means that any increase would have an infinite effect. In reality, the law of diminshing returns means that feedbacks of a physical scale are of gain <1, with the total change in temperature being:
Total T = ΔT / (1-g)
and with the positive feedbacks providing a limited scale of amplification for any temperature change. For the current sensitivity estimate of ~3C per doubling of CO2, with an initial ΔT of ~1.1C, the gain 'g' is about 0.63.
Now as to clouds, if you have actually read the opening post (I suspect you have not), clouds are estimated to have a small positive (amplifying) contribution to the total sensitivity.
-
Kevin C at 07:07 AM on 22 November 2013Help make our coverage bias paper free and open-access
OK, it looks as though my card has been charged (on the second attempt), so hopefully we're getting there.
-
Licorj at 07:04 AM on 22 November 2013Clouds provide negative feedback
If clouds feedback were positive, we would expect:
Infinite warming, until oceans become dry.
It never has occurred in the past, even with a warmer earth.
IPCC's Climatologists should say:
We don't know everything about clouds. We need study a lot to understand the entire process. When we are sure, we are explaining step by step, showing with controlled laboratorial experiments, and calculation memory. When we can explain in details how to trigger an ice age, and an interglaciation era, we are ready to define positive or negative feedback for clouds. By now, we are closing our mouth about global warming or cooling.
-
steven foster at 06:34 AM on 22 November 2013Most of the last 10,000 years were warmer
Sorry I meant GISP2 not GRIP2.
Also, I realized the 1.44 is not the full extent of the rise. That's only 1855 to now. If we go back to the beginning of the bend it's closer to 2 whole degrees C.
I understand polar temp rise will be higher than global. But I think the 0.8 degree C figure that we always hear for global warming period is low if we include the entire rise, if taken back to 1780 like this. I have many documents, written in the early 1800's, that describe a warming climate, melting glaciers, rising sea levels, etc. in the early 19th century.
-
steven foster at 06:26 AM on 22 November 2013Most of the last 10,000 years were warmer
This is quite a thread, I just spent 45 minutes reading and studying through it.
Post 15 brings the GRIP2 chart to modern times using information from the GRIP site, by adding 1.44 C to 1855, but doesn't move the chart over to the left 50 years. I did that myself just now, lining up the chart so the end of the GISP2 data correctly lines up over 1855 rather than 1905.
What I find by doing that is, the modern warming period must have started quite a bit earlier than we normally understand, at least in Greenland. I've been under the assumtion that modern warming started around 1830 to 1840 or so, as many believe. But the data presented on this thread shows 1780 or 1790. The beginning of the modern hockey stick on the revised Easterbrook (editied for 1855-2013 by Tom Curtis here and moved over 50 years by myself (sorry I don't know how to post that here) the temperature appears to bend upwards in the late 1700's, perhaps 1780.
So, we have a long hockey stick with a 1.44 degree C rise from 1780 to now, with roughly the same slope throughout the whole 230 year period. 1780 is long before humans started making much CO2. This thread debunks the 10,000 claim of Monckton, Esterbrook, etc., but adds a new talking point for the deniers to use.....why did modern warming start in 1780?
-
scaddenp at 06:06 AM on 22 November 2013Global warming since 1997 more than twice as fast as previously estimated, new study shows
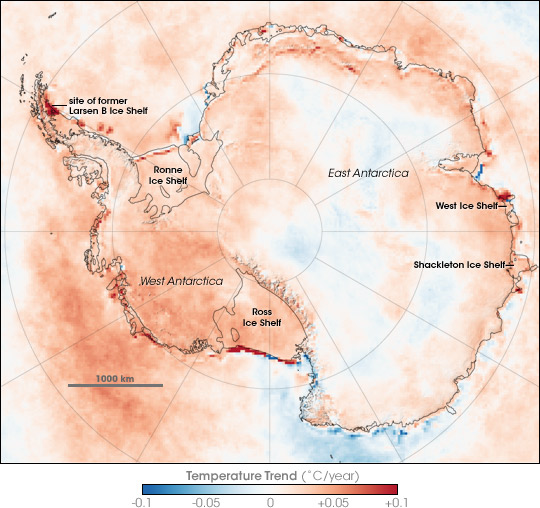
"Antarctica has actually cooled". Well that is what models predicted in 1992 (Manabe) but I am not so sure how well that prediction is holding out.
Here is Antarctica temperature chance 1981 to 2007. What is the basis of your claim of cooling?
-
Dikran Marsupial at 04:51 AM on 22 November 2013Global warming since 1997 more than twice as fast as previously estimated, new study shows
SASM (1) The satellites don't measure surface temperature, but temperature in vertical sections of the atmosphere, so if you want to know surface temperatures, the satellite data cannot help you. While they don't have UHI problems, they do have other issues, hence the many adjustments to the dataset that have been made over the years. Note also that the trophospheric temperatures are considerably more sensitive to ENSO than surface temperatures (hence bigger spike in 1998).
(2) The assymetry might be caused by the fact that Antarctica is land and the Arctic is ocean. I suspect the oceans buffer Arctic temperatures which prevents them from getting as cold as the Antarctic. Also the circumpolar currents in the southern ocean isolates the Antarctic a fair bit.
CO2 is not the only thing that causes temperatures to change. If it were, we wouldn't need climate models.
-
Rob Painting at 04:49 AM on 22 November 2013Global Warming Paws Fails to Materialise: Earth Still Warming and Global Sea Level Rising Like Gangbusters
skymccain - prior warm periods, such as the Mid Pliocene Warm Period a few million years ago would argue against such a scenario. The reduced equator-to-pole and surface-to-deep-ocean temperature gradients back then imply that the thermohaline circulation remained vigorous (but not necessarily constant) throughout the warming. It is something I intend to write about in the future.
-
StealthAircraftSoftwareModeler at 04:43 AM on 22 November 2013Global warming since 1997 more than twice as fast as previously estimated, new study shows
I have two questions, and I am surprised no one else has asked them.
1) Why not just use UAH or RSS satellite data in the first place? My perception is that the satellites are pretty accurate (once they are calibrated) and they have almost worldwide coverage. They also do not have any issues with alleged poor siting and/or urban heat island affects. Why supplement the relatively sporadic land/sea based measurements of HADCRUT4 with UAH data? UAH data shows the warmest year as 1998 and the temps have been flat since then.
2) Has anyone noticed that all of the heat has accumulated in the Artic? Antarctica has actually cooled over this time period. This seems very curious to me and I cannot think of a way this highly asymmetrical heating could be caused by a well-mixed gas like CO2.
-
william5331 at 03:43 AM on 22 November 2013Will extreme weather like super typhoon Haiyan become the new norm?
In a sense, a so called developed country is more at risk from extreme hurricanes than an undeveloped country. The higher you are the further you have to fall. If you can build your house yourself from local materials, thatching the roof with palm leaves, you may recover relatively quickly. If you flood the subway with salt water, flood western houses and destroy your electrical grid, the costs build up pretty quickly. The Hurricane zone is, arguably, going to expand into temperate climes as climate zones shift north and we probably need a Philippine type hurricane to hit an American city before we will be shaken out of our comfortable paradigm. No, it won't be possible to attribute any given storm to climate change but that won't interfere with the perception amongst the public that it is so. The sooner we have such storms, the sooner we may get off our duff and start to seriously do something.
-
saileshrao at 01:19 AM on 22 November 2013Will extreme weather like super typhoon Haiyan become the new norm?
Tom Curtis @10, to add to your excellent response to Yubedude @9, emotions are necessary to change most minds. Rev. Martin Luther King, Jr., had to write that letter from a Birmingham jail cell to get wider support for the civil rights movement. If anything, the scientific community has not been emotional enough in conveying the gist of the message, viz., complex life on earth is in jeopardy if we continue twiddling our thumbs.
-
franklefkin at 00:27 AM on 22 November 2013Will extreme weather like super typhoon Haiyan become the new norm?
michael sweet @ 14
It is obvious that many extreme storms are caused by AGW, even though there is not statistical confidence in the data.
How is it obvious if there is no confidence in the data. That is counter-intuitive.
The nature of expreme events is such that scientific confidence will trail the real world experience.
How can that be? Unless you are talking about the very first occurance of something. If there had never been a hurricane in Florida, and now there was, your statement could be true, but what you had been discussing does not lead to this conclusion.
Most people in the US now realize that tornadoes in Illonois in November and Hurricanes in New York in October are not normal.
This is simply not true. Where did you get this info from? Did you make it up? Tornados have happened in Ill previously, even in November. While not a common occurrance, it is by no means not normal. The hurricane season, as most described, is from June through November. This obviously includes October.
-
Klaus Flemløse at 21:19 PM on 21 November 2013Will extreme weather like super typhoon Haiyan become the new norm?
post nr 1 and nr 13:
Thanks to Tom Curtis. Now it is working
-
michael sweet at 21:09 PM on 21 November 2013Will extreme weather like super typhoon Haiyan become the new norm?
An additional reason that the third world has had bigger hits from extreme weather is that it occupies more of the globe. A gigantic hurricane like Hayian is much more likely to strike a third world country because there are few developed countries in the hurricane zone. A few years ago a denier in my Florida chemistry class told me that concerns about increases in hurricanes were misplaced because Florida had not been hit recently. Two category 5 hurricanes had hit central America that year. He said that if his house was not affected it did not matter! Sandy showed what happens to a developed country when an extreme storm hits. If Miami or Tampa (where I live) got hit with the storm surge that Haiyan had there would be many deaths. Do you feel lucky today?
It is obvious that many extreme storms are caused by AGW, even though there is not statistical confidence in the data. The nature of expreme events is such that scientific confidence will trail the real world experience. Most people in the US now realize that tornadoes in Illonois in November and Hurricanes in New York in October are not normal. Hopefully people will vote for action sooner than later. Five years ago there were many skeptics in my class. Today few students are openly skeptical of AGW.
-
Tom Curtis at 20:42 PM on 21 November 2013Will extreme weather like super typhoon Haiyan become the new norm?
Klaus Flemlose @12, the Skeptical Science comments panel is now WYSIWG (What You See Is What You Get). When editing, stay in the basic tab and just type what you want. You can bold, italic, underline, strike through, subscript, and supercript from that tab by highlighting the relevant text and pressing the relevant button. You can also make ordered and unordered lists, and indents.
If you need to insert links, tables or figures go to the second tab, and use the appropriate buttons. When inserting a picture, ensure you go to the appearance tab and set the width to 500 pixels or less.
Finally, if all else fails, you can use the source tab to edit using html code.
Entering html code anywhere other than in the source tab will simply result in it being displayed as characters on the screen. If the html code is not broken, however, if a moderator clicks edit on your post and then updates, the html code will normally run.
-
Klaus Flemløse at 20:31 PM on 21 November 2013Will extreme weather like super typhoon Haiyan become the new norm?
In post nr 1, I have tried to include pictures and links using the syntax prescribed. Nothing works.
I could earlier use the html bottom, but i does not work any more.
Please help me.
-
chriskoz at 20:31 PM on 21 November 2013Will extreme weather like super typhoon Haiyan become the new norm?
Tom@10,
Thank you for your analysis and your links to brisbanewaters blog where you provide comprehensive numbers to refute the game of blaming the victim. I just realised that similar game has been playing by one of my fiends (denier of AGW) in relation to the unprecedented NSW fires in October. To my argument that BOM & CSIRO assert the increasing Australian weather extremes will be responsible for more frequent bushfires, and this bushfire, occuring so unusually early in the season, is the evidence supporting their assertion, he replied:
There were always bushfires in Australia. And CAGW has nothing to do with it. If this fire was unusual, or if we've seen more fires recently, that's because there are more people living in Blue Mountains now, and more people means more arsenists. More fires are the acts of arson, the latest one included.
I didn't know what to answer to such argumentation because I didn't have detailed arson statistics at hand and didn't consider the ethical aspect of that talk. Now I see how corrupt such argumentation is. And it's astonishing that it can be applied not only to an exotic country like Philipines, but also to your own country, even your own neighbours (!) And it's often not easy to refute on empirical basis only, like you did in case of Brisbane floods.
I don't see the "Blame the victim" in the list of Climate Myths under the thermometer on the left margin. I think the issue is impotant enough to get our attention: that myth is particularly nasty to warrant a comprehensive rebuttal.
-
skymccain at 18:17 PM on 21 November 2013Global Warming Paws Fails to Materialise: Earth Still Warming and Global Sea Level Rising Like Gangbusters
"but isn't there a price to pay for all that energy being absorbed into deeper and cooler parts of the ocean, particularly in polar regions?" Agnostic at 10:41 AM on 20 November, 2013
I suggest that it threatens the thermohaline circulation. Would someone speak about the probable effects of a shutdown?
-
Tom Curtis at 15:41 PM on 21 November 2013Will extreme weather like super typhoon Haiyan become the new norm?
YubeDude @9 indeed, any "half intelligent denialist" will always wander aggressively off topic. Wether the disaster is a heat wave in Russia, floods in Pakistan or typhoons in the Phillipines, they will play the age old game of blaming the victims. The interesting thing here is that the game of blaming the victims is even played when the disaster strikes a wealthy western nation with little corruption, such as the Brisbane floods of 2011. Never mind that they need to get their facts almost completely wrong to do so. Blaming the victim exonerates the person laying blame, and allows them to feel superior.
In your case, the fact that the game is played even against an Australian capital city, should it be so unfortunate as to suffer a disaster shows that there is no ideal country whose disasters can be held up as an example that, yes, more extreme weather results in more victims of natural disaster. (The possible exception is disasters in the US, which seem never to be the fault of the victim.) Pointing to the poverty, and the corruption in the Phillipines is just a smoke screen. The victim blaming would have occurred anyway.
What is more, they are mere whisps of a smoke screen. The Phillipines is not unusually corrupt (ranking similarly to the BRIC group of nations, the power houses of economic growth in the third world). So while corruption in the Phillipines may contribute to poverty, it is not the major factor. By far the largest factors are a lack of significant resources in high demand (such as oil), combined with a super-abundance of low wage workers in other nations such that they are a poor choice for sweated factory labour. Even without corruption, even with a strong spirit of enterprise (which by all accounts the Phillipinos have), their nation would still be poor. And because poor unable to build to cyclone resistant standards for the majority of their accomadation. "Corruption" serves in this context only to provide an excuse for not thinking about the real implications.
Those implications are simply that adaption does not work. At least, we are currently unable to adapt to even normal levels of storms except in the most wealthy of nations (and not even always then), so the notion that we can face a world made far worse by global warming and simply adapt to it is laughable. It relies on the fact that death is also a form of adaption, and that deaths in the third world do not weigh significantly on the scales in western policy. (In fact, in Bjorn Lomberg's favourite economic model, it is a "feature" that third world deaths and injury are considered a lower cost than first world deaths and injury.)
So, the response of your putative "half intelligent denialist" amounts to simple moral bankruptcy. It simply treats the suffering of the very poor in the face of disasters as of little moral consequence - and hides the calousness of that fact behind ideological blinders.
-
YubeDude at 14:34 PM on 21 November 2013Will extreme weather like super typhoon Haiyan become the new norm?
I don't wish to offend or come across as callous to the suffering that has occurred...now having said that...
Using this video as some kind of humanistic plea for change does nothing to address the issue at hand and actually creates an opening for denialist to take advantage of. The Philippines is not the place to try and link human tragedy and AGW impacts as a way of addressing the need for change. Any half intelligent denialist is going to aggressively wonder off topic and easy show that the amount of the death and destruction was the result of conditions that exist in the Philippines as opposed to the absolute force of the storm. A comparable death count between the next largest storm, Hurricane Camille, and this most recent storm illustrates that death counts and overall destruction have to factor the inherent conditions that exist.
You can bet the cost will be lower in the Philippines but the death count much higher. Addressing the measured storm surge and speaking of the loss of life does not factor in that a very large population of people have to live in the surge zone due to poverty and are unlikely to have received timely information suggesting evacuation or refuse to evacuate because where exactly would they go?
Any natural disaster is tragic where there is a loss of life or suffering. But adding that human element in an attempt to pull at the heart strings is disingenuous when the speaker/negotiator knows that his government and the culture of corruption are standing in the way of real change or doing anything significant to lessen the impact felt by these kinds of natural disasters.I say stick to the science and leave the tears for the TV dramas and bakla emotional meltdowns.
-
wili at 11:45 AM on 21 November 2013Will extreme weather like super typhoon Haiyan become the new norm?
Just to bring a bit of visual and audible to the discussion:
http://www.youtube.com/watch?v=hcfdFggVnPE&list=UUVLkqTvsRpm46RDmM4SYf6Q
Moderator Response:[RH] in the future please include a more descriptive comment with your links.
-
Doug Bostrom at 10:36 AM on 21 November 2013Will extreme weather like super typhoon Haiyan become the new norm?
Extending Terranova's thoughts, there's a world of difference between a house with no water on the floor and another with only 1cm underfoot.
Some of us have experienced the difference up close and personally. Rest assured, there's only a fraction of a meter of water between a house being useful and useless.
Anywhere there's a storm surge, SLR is playing a role. If it's outdoors, no big deal. Indoors, the story is entirely otherwise.
-
Albatross at 10:28 AM on 21 November 2013Will extreme weather like super typhoon Haiyan become the new norm?
Terranova @3,
In addition to the excellwent figure provided by scaddemp @5, see also the following image from the IPCC's fifth assessment report. Note that the tide gauge at Manilla has recorded an increase in sea level of about 0.75 metres since the 1960s (H/T to Eli Rabett)! Note, not all of that is related to global warming, some of the increase in sea-level in the western Pacific is related to decadal-scale variability. Regardless, now add that to a 3-4 m storm surge (as far as I know, no official number has been released yet, but given the intensity of the storm, the observed damage and what storm surge models were predicting, the 3-4 m value is entirely plausible; see video to witness the devastating force of the storm surge) and you have a really big problem made even worse.

-
scaddenp at 10:11 AM on 21 November 2013Will extreme weather like super typhoon Haiyan become the new norm?
Philippines sealevel rise is much higher than world average at around 12mm/yr.

Are you suggesting that it is physically possible for SLR not to add to storm surge height? That would seem to violate a no. of physical laws.
Moderator Response:[RH] Fixed image width.
-
Rob Honeycutt at 09:55 AM on 21 November 2013Will extreme weather like super typhoon Haiyan become the new norm?
When people talk about Camille in 1969 I point out that Haiyan was massive. It was likely about 3X the size of Camille.
Wind speed records are somewhat misleading and don't account for the amount of energy contained in cyclones.
-
Terranova at 09:48 AM on 21 November 2013Will extreme weather like super typhoon Haiyan become the new norm?
Dana,
One topic at a time. What is the recorded SLR in that region of the world? And, more importantly what was the official storm surge? Can you quantitatively demonstrate that SLR had any appreciable impact on the storm surge?
Statements and predictions are easy. Scientifically proving those statements is not. As one multi-degreed and practicing environmental scientist to another, I am challenging you to show valid proof of your statements.
Moderator Response:[JH] Please lose the snark.
-
Tom Curtis at 09:02 AM on 21 November 2013Will extreme weather like super typhoon Haiyan become the new norm?
Klause Flemlose @1, the statistics in the chart are simply for the thirteenth strongest tropical cyclones at landfall. That does not include, fairly obviously, all landfalling tropical cyclones and hence the trend in the sample does not show the trend in speeds at landfall of tropical cyclones. Nor is a sample of thirteen large enough to draw any significant conclusions from. Further, the trend you show is probably almost entirely an artifact of the increased frequency of observation of tropical cyclones in the satellite era.
That cuts both ways, of course. The chart does not provide enough information for the downward trend to be significant, but neither does it show enough information to suspect an upward trend if more data was included. In particular, the higher frequency of tropical cyclones with a one minute wind gust velocity greater than 164 mph in recent decades is almost certainly a result of better tracking of cyclones with satellites.
Further, a significant confounding factor in the period of satellite observation is the switch from predominantly El Nino conditions from the late 1970s to the mid 2000s, to predominantly La Nina conditions. La Nina conditions reinforce the Western Pacific Warm Pool, increasing SST around the Phillipines and Australia, a factor in 5 of the 6 cyclones listed since 1998. (It may also be a factor the sixth, striking the caribean coast of Mexico, but I am unsure of the ENSO influence in the caribean).
That confounding factor does not, however, detract from the point of the OP. If increased SST increases the frequency of category 5 tropical cyclones, it will do so wether that increase is due to ENSO or global warming.
-
Klaus Flemløse at 07:06 AM on 21 November 2013Will extreme weather like super typhoon Haiyan become the new norm?
Will extreme weather like super typhoon Haiyan become the new norm?For other reason that presented here, I think the statement is correct.
The statistics copied from Earth’s Strongest Landfall Tropical Cyclones at landfall does not indicate at all that the wind speed is increasing.
There too little information in the graph to show anything. The data is sorted by mph creating a picture of an increasing trend.
Below the data is plotted by year and the histogram is shown:

The number of records broken over the years 1935 to 2013 is 4.This is not extreme in any ways.
This following graph shows 10000 simulated runs of 79 years of observations assuming that no development in wind speed has taken place.

The probability for 4 broken records or more is 0.5768.
Moderator Response:[RH] Deleted empty lines.
-
Mal Adapted at 06:54 AM on 21 November 2013Global Warming Paws Fails to Materialise: Earth Still Warming and Global Sea Level Rising Like Gangbusters
Agnostic:
... but isn't there a price to pay for all that energy being absorbed into deeper and cooler parts of the ocean
Well, among other effects, there's thermosteric sea level rise:
http://onlinelibrary.wiley.com/doi/10.1029/2012GL051106/full
-
jdixon1980 at 01:51 AM on 21 November 2013Global Warming Paws Fails to Materialise: Earth Still Warming and Global Sea Level Rising Like Gangbusters
Mods, we could use a mouseover def for "GIS." I gathered it means Greenland Ice Sheet because there is one above for West Antarctic Ice Sheet right next to it.
chriskoz: "our selfish hope is that ocean will absorb most of CO2 peak quickly enough (some 100y) before GIS and WAIS start collapsing"
But is that a "selfish" hope or a naive one? If marine ecosystems collapse, won't that affect humans too in very nasty ways? Aside from the obvious loss of a major food source (which would presumably lead to even more livestock consumption with its gluttonous emissions tally => anthropogenic amplifying feedback?), I think I've also read about loss of natural harbors and increased coastal erosion, and who knows what other impacts we may not have even thought of?
Moderator Response:[AS] GIS Glossary term added.
-
Kevin C at 20:58 PM on 20 November 2013Help make our coverage bias paper free and open-access
Still in progress...
-
ajki at 18:45 PM on 20 November 20132013 SkS Weekly News Roundup #47A
“On Thin Ice” at Warsaw climate talks
Did you know it was the “Day of the Cryosphere” at the Warsaw climate talks COP 19 in Warsaw yesterday? If not, you might be forgiven. I haven’t seen it making the headlines in the mainstream media. That is a pity, given that what climate change is doing to our ice, snow and permafrost has repercussions for the whole planet.
The cryosphere is a term for the regions of our globe which are covered in ice and snow either seasonally or all year round, from the North Pole to Antarctica. ”Climate change is happening in the cryosphere faster and more dramatically than anywhere else on earth”, says the “International Cryosphere Climate Initiative” (ICCI). It is a network of senior policy experts and researchers working with governments and organisations to bring about initiatives to preserve as much of our ice and snow areas as possible. The group was set up in 2009 immediately after the disastrous COP 15 in Copenhagen.
“On Thin Ice” at Warsaw climate talks by Irene Quaile, DW (Deutsche Welle) Ice Blog, Nov 18, 2013
Moderator Response:[JH] Thanks for posting this. I will include it in the next edition of the News Roundup as well.
-
chriskoz at 17:34 PM on 20 November 2013Global Warming Paws Fails to Materialise: Earth Still Warming and Global Sea Level Rising Like Gangbusters
This video emphasizes the role of oceans in AGW, and rightly so, because we, land creatures tend to ignore it.
Once you learn a little bit about climate science (like myself) it turns out the more you learn the more you realise the importance of the state of the oceans as the main measure of AGW and the related catastrophe:
- oceans absorb 93% of heat from increased GHE
- oceans are rising as they expand & melting ice adds there
- arctic ocean dramatically alters in albedo as sea ice melts with extra positive effect (heat from ocean speeds it up more than air temperature)
- sooner or later, oceans will absorb most of Antropo CO2 pulse (within 100ky timescale)
- oceans are getting acidic, and it's far too dangerous for CaCO3 forming creatures than the climate change is for us (if kept at 2degrees)
- our selfish hope is that ocean will absorb most of CO2 peak quickly enough (some 100y) before GIS and WAIS start collapsing... great hope, but what does it mean for coral reefs, foraminifera, crustaceans, and others in the food chain?... ceartain death!
I think we should repeat those scientific facts over and over until ignorant/denying public understands the extents of the main problem here. That wasting time talking about "pause" in air temperatures does not make sense.
-
Doug Bostrom at 16:24 PM on 20 November 2013Broad consensus on climate change across American states
Further to scaddenp's remarks, unfortunately the Supreme Court here has officially declared that we have as much free speech as money can buy. By so doing they instantly enshrined a new class of super-citizens as it follows logically that if you have more money you have more free speech, but that's the going word at present. Perhaps later with a different bench and an argument that can once again reach the Supreme Court we can dethrone our super-citizens.
Of course this same composition of the court that created super-citizens also cannot parse a sentence with multiple clauses, thereby apparently being forced to choose a favorite part, so odds are we'll do better in the future. It hardly seems possible to underperform in comparison. Maybe. This is the also the country that is replacing letters and numbers on cash registers with pictures of things being sold.
-
vrooomie at 14:05 PM on 20 November 20132013 SkS Weekly Digest #45
In many ways, WRT climate science reality, I *wish* there was an *Unsee* button. Having the knowledge of even the most conservative takes on what is to come is dpressing beyond words. All I, or anyone else can do, is to keep trying, like Chief in "One Flew Over The Cuckoo's Nest," and hope the drinking fountain of raelity will flatten the Wall of Stupid that is climate science denial/disinformation.
-
vrooomie at 14:00 PM on 20 November 2013Global warming since 1997 more than twice as fast as previously estimated, new study shows
Sorry, Poster, but using Curry as an exhibit to cast doubts on Cowtan and Way is still using the scientific illiterati. She has no cogent response to their work, has used nothing that can even come close to being called a rigorous look at their paper, and is just doing her usual heming and hawing, and using the old tactic she's perfected, of parroting something about "uncertainty." Will Cowtan and Way stand the test of time? I don't know, for I am not an expert, but, having read in excess of 1200 various articles, essays, and papers concerning this subject, one thing I can say, with good reliability, is Curry hasn't done anything except her usual non-rigorous trashing of a paper I sincerely doubt she understands.
-
Riduna at 10:41 AM on 20 November 2013Global Warming Paws Fails to Materialise: Earth Still Warming and Global Sea Level Rising Like Gangbusters
Just as well the oceans are such a large heat sink ... but isn't there a price to pay for all that energy being absorbed into deeper and cooler parts of the ocean, particularly in polar regions?
-
Tom Curtis at 09:47 AM on 20 November 2013Antarctica is gaining ice
Morgan Wright @204 (cont), I have been a bit confused about my account of the effect, specifically with regard to the location and altitude of the relevant winds. In particular, I thought the relevant winds were those bringing warmth into the upper troposphere of Antarctica, whereas they are those related to bringing warmth to the Antarctic Ocean. To avoid furhter confusion, I think it best that I lay out the observations directly.
First, the winds involved are those bringing warmth along the surface from about 30o to about 60o South:

These result in westerly winds (clockwise around the pole as viewed from below) just above the edge of Antarctica in the region where the seasonal sea ice forms, ie, the west wind drift:

These have been strenthening, and it is their increased speed that is one of the postulated causes of increased Antarctic sea ice.
Gillet and Thompson (2003) show a comparison between the observed increase in westerly strength and that prediced from a model driven only be reductions in ozone set to match observed reductions:

Gillet and Thompson indicate the strongest effect occurs in the spring in the stratosphere, but then propogates downward to summer (summer and autumn according to Turner et al, 2009).
How could ozone drive this pattern?
The west wind drift is formed by air coming south and then rising as it encounters colder air from Antarctica. For it to rise, air above it must disperse, ie, move either north or south. If it does not disperse, the rising air will cause a build up in pressure that will stop further rises in air. The air moving south in turn must fall at or near the south pole in order to make room for more air. That, however, creates a problem. The air moving south is typically of a similar temperature to the surface in Antarctica, or warmer. If it falls, it will be warmed by increase pressure, making it warmer than the surface air. As a result it will not fall any further. Unless upper troposphere are over Antarctica falls to temperatures approximately 6.5o C per km of altitude above the surface, it cannot fall, with the consequence that pressure will build up at altitude stopping further circulation. Therefore the air coming south must be cooled, primarilly by radiation to space. The radiation to space is made less efficient by the existence of a warm stratosphere above the air, generating IR radiation from above, and limiting the net cooling of the upper troposphere. At this stage, reduced ozone results in a cooler stratosphere and more efficient cooling of air in the upper troposphere. Reduced ozone, of course, cools the stratosphere by the simple expedient of reduced absorption of UV radiation from the sun.
It should be evident that increase CO2 should also result in more efficient cooling of the upper troposphere. When the air below this effect is overwhelmed by increased IR radiation from below. But over Antarctica, increased CO2 should also accelerate the circulation of the polar cell, and hence indirectly that of the mid-latitude cell, and with it the west wind drift. Models do in fact show this effect, but show it to be significantly weaker than the effect of reduced ozone.
-
scaddenp at 08:09 AM on 20 November 2013Broad consensus on climate change across American states
Something like the NZ Electoral Finance Act?
I think Americans strongly believe that the rights of very rich people to have undue influence on politics is a fundamental freedom, and this "freedom" trumps any other rights that might be conflicted.
In short, good luck. As an outsider looking in and having discussed this with many US citizens, it appears vested interests have very successfully pushed rhetoric about "freedom" to point where no reasonable discussion is possible. I'm glad I live here instead.
-
Tom Curtis at 07:51 AM on 20 November 2013Ljungqvist broke the hockey stick
Morgan Wright @33, taking your lower graph, you show peaks that differ in timing by around 500 years in one case, and by about three thousand years in two other cases as evidence that NH and SH temperatures vary in sync. Oddly, I am not convinced. In fact, the "syncrhonization" of Arctic and Antarctic warm events is such that scientists have proposed a "bi-polar seesaw" to account for the fact that, in general, while the Arctic cools, the Antarctic warms. Equally important, the temperture differences between found at Greenland and those in Antarctica are significantly different in scale, and cannot by rendered similar by a simple linear rescaling. Your charts, therefore, merely establish that you cannot use a single local proxy as a global proxy (or a hemispheric proxy).
Single site polar proxys are only usefull as global proxies for indicating the onset or end of interglacials. Even then, they are only approximate indicators for the rest of the global, as Shakun et al have shown:
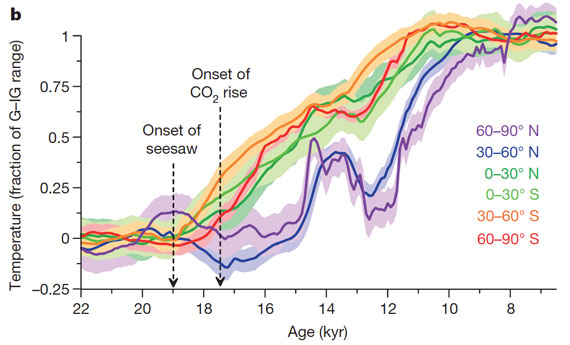
Morgan, everybody does foolish things, especially in areas where they are largely ignorant (as you evidently are in this). What distinguishes the wise the fools are that the fools persist in their mistakes in the face of contrary data. The evidence clearly shows that global and hemispheric temperature variations can differ substantially from that of local proxies, and that single local proxies are, therefore, very poor indicators of global patterns except for the very largest patterns (ie, transitions from glacial to interglacial and others of similar magnitude).
-
Lanfear at 07:23 AM on 20 November 2013Antarctica is gaining ice
Morgan Wright@206: "Now, let's iron this whole thing out. South pole, not warming"
While I realize that this is not peer reviewed, or even strictly speaking a scientific result, it might bear some counter value to the claim above:
And while MW does refer to a NASA-produced anomality-picture from 2005 (apparently), there are newer ones, which are showing that the anomality is positive.
So, old information says cooling. New information says warming.
-
william5331 at 04:25 AM on 20 November 2013Broad consensus on climate change across American states
Politicians serve the people that give them funds to run their campaigns, not the people that elect them. The only way America will get out of this paradigm is to ban all election contributions and legislate equal, tax payer funded air time for each politician to present his case. Besides air time, each politician gets a set amount of funding from the government. It sounds expensive. It is far less expensive that the present completely democracy corrupting system.
-
PhilMorris at 03:28 AM on 20 November 2013Broad consensus on climate change across American states
kanspaugh @3. While not denying the power of lobbying groups, the analogy between the NRA and fossil fuel industry doesn't play well. The former claim second amendment rights in support of the right to bear arms, and short of being in the firing line, Joe Public isn't affected by the NRA's love of weapons. Not so with climate change; Joe Public most certainly will be affected. And while a good majority of them may believe that climate change is real, I suspect very few really have any idea of the catastrophe that awaits, if not them, then their children and grandchildren.
With at least one notable exception, climate scientists have been very conservative in aggressively telling the public about what the future may – no, WILL – bring without adequate reductions in CO2 emissions. I suspect most of the public think in terms of perhaps a few more storms in the mid-west, maybe some water shortages in the south west, and maybe some more events like Sandy (but the insurance companies will pay, won’t they?). Do they really know the likelihood of extended drought in the mid-west and south west, decimating livestock production, and making the south west uninhabitable due to lack of fresh water (‘A 12000 year perspective of 21st century drought in southwestern North America’, Woodhouse et. al, PNAS 2009)? Do they understand that there is nothing they can do to save east coast cities from rising sea levels (‘Rapid accumulation for committed sea level rise from global warming’, Strauss, PNAS, 2013)? Do they understand that rising summer temperatures will result in significant decline in production of corn, soybeans and cotton (‘Nonlinear temperature effects indicate severe damages to US crop yields under climate change’, Schlenker and Roberts, PNAS, 2009)? I suspect not.
Some people may take solace in knowing that timescales may be measured in centuries, but with the Arctic melt trend lines suggesting an ice free summer by 2016/2017 weather patterns will continue to change for the worse in much shorter timescales. And catastrophic collapse of the WAIS – likely to occur once the Ross ice shelf disintegrates - would cause significant sea level rise occur in decades.
-
CBDunkerson at 03:24 AM on 20 November 20132013 SkS Weekly News Roundup #46B
CCE, actually I expect that global warming denial will evaporate quickly after the fossil fuel industry loses its political clout. Solar power is starting to catch on in the US and direct exposure to the reality of solar power is starting to change 'conservative' viewpoints away from their propaganda driven opposition. More and more Republicans are coming out 'pro solar' in a party that reviled solar power just a decade ago. People can see for themselves that solar works, and as that knowledge spreads the days of fossil fuel political domninance are numbered.
So, I'd say there is a tsunami of change already wiping out 'business as usual' power generation, and our political institutions are starting to shift in response.
BTW: Next news report should include the interesting study by Halfar et al in PNAS extending Arctic sea ice records back ~650 years based on coral proxies. This finally provides decadal resolution data on how sea ice has responded to previous climate shifts. Should help pin down whether we are looking at a mostly ice free Arctic ocean by 2040, 2030, or 2020.
-
MA Rodger at 03:13 AM on 20 November 2013Models are unreliable
Echoing KR@659, I too have occasioned upon dvaytw engaging the denialista. My only criticism would be his (once) suggesting that I was an "actual climate scientist" which I am not. Then as @565 "Credentials are irrelevant in science, what matters is the strength of the evidence and the internal consistency of the argument. "
-
Models are unreliable
Moderators - My apologies, the link in my previous post should be "dvaytw's presentation of SkS information on other forums".
-
Models are unreliable
John Hartz - I would strongly disagree based on dvaytw's presentation of SkS information on other forums. He indeed is arguing the science with support from discussions here.
dvaytw - I would strongly suggest including such links (if possible) to these various discussions whenever referring questions from deniers? As in, every time? Not only does that make your position clearer, but provides context that might greatly aid answering such questions. In fact, that might cut short a pattern I've seen with your questions from several back-and-forths to a briefer conversation that more directly addresses the denier myths involved.
As it is, your questions feel like a game of Telephone...
Moderator Response:[JH] Thanks for the feedback re dvaytw's credentials. Your advice to him is also appreciated.
Prev 827 828 829 830 831 832 833 834 835 836 837 838 839 840 841 842 Next


