


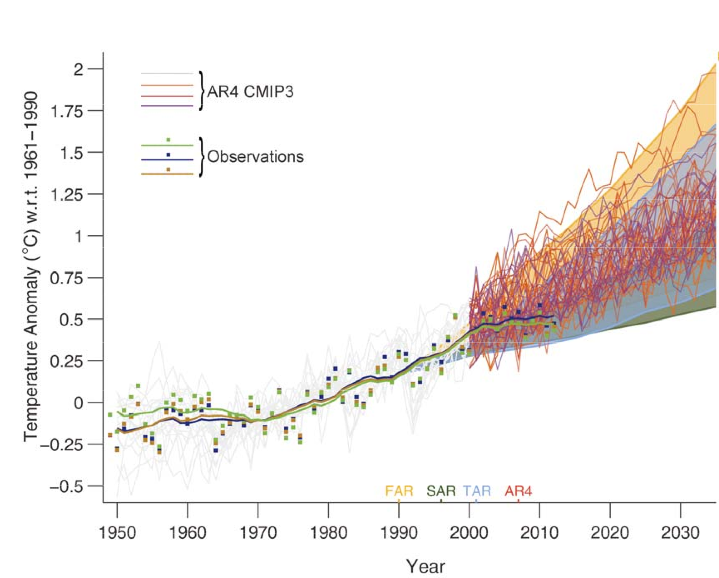
![]() The figure below from the 2013 Intergovernmental Panel on Climate Change (IPCC) report compares the global surface warming projections made in the 1990, 1995, 2001, and 2007 IPCC reports to the temperature measurements.
The figure below from the 2013 Intergovernmental Panel on Climate Change (IPCC) report compares the global surface warming projections made in the 1990, 1995, 2001, and 2007 IPCC reports to the temperature measurements.
Enter a term in the search box to find its definition.
Use the controls in the far right panel to increase or decrease the number of terms automatically displayed (or to completely turn that feature off).
|
|
||||
Home
 Arguments
Software
Resources
Comments
The Consensus Project
Translations
About
Support Arguments
Software
Resources
Comments
The Consensus Project
Translations
About
Support
|
||||
|


Latest Posts
|
IPCC model global warming projections have done much better than you thinkPosted on 1 October 2013 by dana1981
IPCC AR5 Figure 1.4. Solid lines and squares represent measured average global surface temperature changes by NASA (blue), NOAA (yellow), and the UK Hadley Centre (green). The colored shading shows the projected range of surface warming in the IPCC First Assessment Report (FAR; yellow), Second (SAR; green), Third (TAR; blue), and Fourth (AR4; red).
Since 1990, global surface temperatures have warmed at a rate of about 0.15°C per decade, within the range of model projections of about 0.10 to 0.35°C per decade. As the IPCC notes,
What about the Naysayers?In the weeks and months leading up to the publication of the final 2013 IPCC report, there has been a flood of opinion articles in blogs and the mainstream media claiming that the models used by the IPCC have dramatically over-predicted global warming and thus are a failure. This narrative clearly conflicts with the IPCC model-data comparison figure shown above, so what's going on? These mistaken climate contrarian articles have all suffered from some combination of the following errors. 1) Publicizing the flawed draft IPCC model-data comparison figureLate last year, an early draft of the IPCC report was leaked, including the first draft version of the figure shown above. The first version of the graph had some flaws, including a significant one immediately noted by statistician and climate blogger Tamino.
In the draft version of the IPCC figure, it was simply a visual illusion that the surface temperature data appeared to be warming less slowly than the model projections, even though the measured temperature trend fell within the range of model simulations. Obviously this mistake was subsequently corrected. This illustrates why it's a bad idea to publicize material in draft form, which by definition is a work in progress. That didn't stop Fox News, Ross McKitrick in the Financial Post, Roger Pielke Jr., the Heartland Institute, and Anthony Wattsfrom declaring premature and unwarranted victory on behalf of climate contrarians based on the faulty draft figure.2) Ignoring the range of model simulationsA single model run simulates just one possible future climate outcome. In reality, there are an infinite number of possible outcomes, depending on how various factors like greenhouse gas emissions and natural climate variability change. This is why climate modelers don't make predictions; they make projections, which say in scenario 'x', the climate will change in 'y' fashion. The shaded regions in the IPCC figure represent the range of outcomes from all of these individual climate model simulations. The IPCC also illustrates the "multi-model mean," which averages together all of the individual model simulation runs. This average makes for an easy comparison with the observational data; however, there's no reason to believe the climate will follow that average path, especially in the short-term. If natural factors act to amplify human-caused global surface warming, as they did in the 1990s, the climate is likely to warm faster than the model average in the short-term. If natural factors act to dampen global surface warming, as they have in the 2000s, the climate is likely to warm more slowly than the model average. When many model simulations are averaged together, the random natural variability in the individual model runs cancel out, and the steady human-caused global warming trend remains left over. But in reality the climate behaves like a single model simulation run, not like the average of all model runs. This is why it's important to retain the shaded range of individual model runs, unlike Bjorn Lomborg in The Australian, Judith Curry in The Australian, Benny Peiser at GWPF, Roger Pielke Jr., David Rose in the Mail on Sunday (copied by Hayley Dixon in The Telegraph), and Der Spiegel, all of whom only considered the model average. This group all made an additional related third error as well. 3) Cherry PickingMost claims that the IPCC models have failed are based on surface temperature changes over the past 15 years (1998–2012). During that period, temperatures have risen about 50 percent more slowly than the multi-model average, but have remained within the range of individual model simulation runs. However, 1998 represented an abnormally hot year at the Earth's surface due to one of the strongest El Niño events of the 20th century. Thus it represents a poor choice of a starting date to analyze the surface warming trend (selectively choosing convenient start and/or end points is also known as 'cherry picking'). For example, we can select a different 15-year period, 1992–2006, and find a surface warming trend nearly 50 percent faster than the multi-model average, as statistician Tamino helpfully illustrates in the figure below. 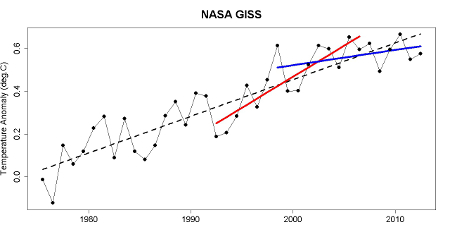 Global surface temperature data 1975–2012 from NASA with a linear trend (black), with trends for 1992–2006 (red) and 1998–2012 (blue).
In short, if David Rose wasn't declaring that global surface warming was accelerating out of control in 2006, then he has no business declaring that global surface warming has 'paused' in 2013. Both statements are equally wrong, based on cherry picking noisy short-term data. IPCC models have been accurateFor 1992–2006, the natural variability of the climate amplified human-caused global surface warming, while it dampened the surface warming for 1997–2012. Over the full period, the overall warming rate has remained within the range of IPCC model projections, as the 2013 IPCC report notes.
The IPCC also notes that climate models have accurately simulated trends in extreme cold and heat, large-scale precipitation pattern changes, and ocean heat content (where most global warming goes). Models also now better simulate the Arctic sea ice decline, which they had previously dramatically underestimated. All in all, the IPCC models do an impressive job accurately representing and projecting changes in the global climate, contrary to contrarian claims. In fact, the IPCC global surface warming projections have performed much better than predictions made by climate contrarians. It's important to remember that weather predictions and climate predictions are very different. It's harder to predict the weather further into the future. With climate predictions, it's short-term variability (like unpredictable ocean cycles) that makes predictions difficult. They actually do better predicting climate changes several decades into the future, during which time the short-term fluctuations average out. That's why climate models have a hard time predicting changes over 10–15 years, but do very well with predictions several decades into the future, as the IPCC illustrates. This is good news, because with climate change, it's these long-term changes we're worried about: 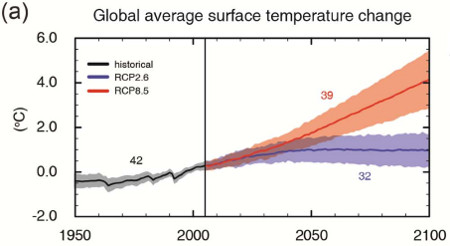 IPCC AR5 projected global average surface temperature changes in a high emissions scenario (RCP8.5; red) and low emissions scenario (RCP2.6; blue).
Note: this post has been incorporated to the rebuttal to the myth IPCC global warming projections were wrong and added to the SkS debunkings of the most popular myths about the IPCC (short URL http://sks.to/ipcc)
|
|


THE ESCALATOR |
|
| © Copyright 2026 John Cook | ||||
| Home | Translations | About Us | Privacy | Contact Us | ||||


http://www.drroyspencer.com/2013/04/global-warming-slowdown-the-view-from-space/ < see link.
The satelite figures differ with IPCC numbers, and show steady, historic increases in temperature. The exagerated numbers again come from the IPCC. So can this be explained or is this also IPCC figures that are being misrepresented?
John Oh - What "exaggeration" are you referring to? Are you making a claim that IPCC data is in error, and if so on what grounds?
As I noted on that Spencer thread, satellite temperatures have their own issues, many of which are not acknowledged by the collectors of that data. From “Temperature Trends in the Lower Atmosphere – Steps for Understanding and Reconciling Differences” 2006, authored in part by the very John Christy who supplied the data in your linked blog post:
Radiosonde data (intended for short-term weather analysis, not climate studies) has consistency/calibration issues, and the quite complex satellite data analysis has been repeated updated due to various errors.
John Oh @51, looking at Christy's graph, as reproduced by Spencer shows that the observed record lies below the multi-model mean not just in the recent, so-called "hiatus" years, but over the whole record. The apparent disagreement, therefore, consists entirely in Christy using a low baseline to creat a visual appearance of disagreement, where little disagreement actually exists.
Having said that, it is interesting to see how he accomplishes this legerdemaine. The graph indicates that it indicates "departure from the 1979-83 average". That means that for both observational series, and for the multi-model mean, the average over the period 1979-83 equals zero. Despite that, there is already a marked discrepancy between observations and multi-model mean in that period. Specifically, for most years the obeservations are below the multi-model mean, but in 1983 they are well above it. Indeed, because the average over that interval is set to zero, because the observations are well above the multi-model mean in 1983, the other years need to be below the mean to achieve the same average over that period.
1983, of course, was an unusual year. Specifically, it was unusual because of the significant volcanic eruption the year before (El Chichon), which as a forcing shows up in the multi-model mean as a dip in temperatures. It was also unusual for possibly the strongest El Nino on record, with an SOI reading of -33.3 in Feb, 1983 (compared to the -28.5 in March 1998 for the more famous 97/98 El Nino). Unlike volcanic forcings, however, El Nino warmings do not show up in the models - or at least, they do not show up in the models on the same year for all models, with the result that in the multimodel mean they are cancelled out.
So, Christy has forced a low baseline for the observational records by including in the baseline period a known, very large warming perturbation which he knows to be reflected in the observations, but which cannot be reflected in the models. To ensure that this lowers the baseline sufficiently, he then makes the baseline as short as possible to ensure the effects of the 1983 El Nino in distorting the graph are not diluted (as they would have been had he used a more appropriate 1970-2000 baseline).
And to top it all of, knowing the so-called "hiatus" is predominantly a consequence of recent ENSO variations, he has chosen a data set which shows a heightened ENSO effect relative to the surface temperature record. I assume he has done this because an honest comparison would be too damaging to his case.
Tom Curtis - A five year baseline period? That is quite, err... unusually short!
To be fair, there are those that like to use an even shorter baseline ;o)
Same idea though (click on the graph for a debunking).
For what its worth, I have shared this article with the UK Daily Mail.
Bob @3
I checked through the McIntyre link but can't find the full description of the simulation setup. It appears to be a single run from 1900 onwards, with known forcing data until 2000 and then RCP forcings after.
Generally, GCMs generate their own natural variability, like El Ninos. An individual model might be in La Nina or El Nino or neutral in any one year, but the ensemble average tends to be equivalent to a 'neutral' year. Similarly for other sources of natural variability.
If you match up a single year against the ensemble averge, then you can effectively shift the temperatures by any amount you want, just by artificially selecting your start year.
In the worst cases of the 97/98 El Nino you could shift your temperatures up or down by 0.4 C. That's why baselining is typically done over a longer period over which the natural 'noise' averages closer to zero.
Alternatives would be to initialise the model with the 'real' climate state at the start point, or to only select those models which match the most important 'real' states, but these are time consuming and/or cause you to lose data.
This 'real world realisation' which affects baselining is also important for short term trends.
Firstly, you can use Kevin C's trend tool to get a 95% confidence interval on the trend from 1997, and find it's between -0.07 and +0.19 C/decade.
But that's a purely frequentist estimate of the probability based on assuming we know nothing about the noise and that it's completely random. But we do know something about the noise: we know solar activity is much lower than expected and that there has recently been a trend towards more La Ninas if you choose to start in 1998.
Foster & Rahmstorf (2011) tried to address this, but I understand that there are continuing difficulties with that sort of assessment. Kosaka & Xie's new paper is interesting: they found that according to the model, the real world realisation of El Nino and La Nina means that the model does a good job of reproducing the recent changes.
The fact that most of the models are running high does not show that most of them are wrong yet. Based on the fact we've seen a negative trend in the ENSO index, we know that if the models are right then most of them would overestimate the warming trend since 1998 because the model average should be close to no trend in ENSO activity.
If we had enough models and could only select the runs that featured a similar trend in ENSO, then we'd have a better idea of whether the models were actually overestimating warming or not. Kosaka & Xie's paper suggests that they might not be.
MarkR - Regarding the McIntyre link and the draft Fig. 1.4 discussed, that figure showed the range of projected model trends +/- observed HadCRUT temperature 2σvariability, not +/- the model variability.
Models are currently running high - and seven years ago, as Tamino points out, they were running low. However, the periods for which they have been high or low with regards to observations are too short for statistical significance.
engineer:
You said (@44) your problem was in part in not agreeing on the value being placed here to differentiate between projections vs predictions ("but why is this distinction between prediction and projection even necessary? the terms are interchangable") yet your main dispute is that the models fail to live up to reality. I think you understand projections but are forgetting what a prediction actually means, and this is why you think the models are being falsified by the data.
For reference, I'll quote 2 other commenters.
Leto addressed your statement ("being on the high side 114 out of 117 times is indicative of a bias") by saying,
> You can observe that process 117 times, or 117000 times, and it does not mean that the model has been falsified unless you choose time points that are truly independent.
Mammal_E had earlier said,
> Let's say I have a model that simulates the outcome of process of drawing cards from a shuffled deck. I run the model once, and it generates a 3 of diamonds. I have an actual shuffled deck, and draw a 10 of clubs. The model and reality disagree.
First, let me adjust the example above from Mammal_E. The model is instead run 117 times (not once) and the average is (assuming we ignore the face cards) 5.5. Now let's perform the draw experiment one time (to match the "single" time that the Earth performs its experiment). We get a 2.
You seem to be saying that the observed result of 2 is way below the average of 5.5. [You stress this point by using the extreme example of getting a certain card 20 times in a row to start the experiment.]
What others here say is that the 2 is within the range of the model's 95% window (if just barely). The model predicts an integer anywhere from 1 to 10, specifically, with at least 95% of the time coming in the range 2-9.
Would you say that the model for the card drawing is wrong because the single drawing of 2 is at the edge of the 95% window? Even if we had drawn a 1, we'd still follow the model.
Maybe you understand this example above and it improves your understanding of the climate modeling, but let's add more details.
Now, can we run the experiment on the earth more than once? Well, I think this is part of what might be confusing you. To address this, we can map the card analogy in at least two ways to the earth system.
In way one, we treat a single year as a sample pick. Note that since the average temp doesn't change that fast year to year, this example is not a good model for independence (like the card pick is), but it does get at the basic point of whether the climate model is correct or not.
So let's go back to mid 1970s (since that appears to be around when the temps started a notable upward trend from which they have not recovered). The question would be, has the actual earth temp for each year since 1975 been within the 95% model range close to 95% of the time? I won't answer that, but you can consider that question for yourself first before marrying the analogy of picking a card 20 times in a row. While the modern models didn't exist back then, we can take a modern model and hindcast. I think the models are calibrated that way and in fact the answer would be close to "yes". I don't know the specifics, but unless you do, I don't see how you would argue that the model (or a particular set of projections) is off by a lot or even by a little. Does the data fit the models' range most of the time? What data not matching the 95% boundary nearly 95% of the time are you using to claim that the applicable predictions are "falsified"?
A second way of looking at this is to look at linear trends across time periods of a certain size. This is similar. Here we might look at all the earth data for 15 year subintervals since 1975 and see how those trends match the projection trends. That would provide fewer data points, but its the same general idea in the limiting case (of us being able to have a very long superinterval of data points).
[Note that Leto and others referred to the earth providing a single draw, but that is if we zoom in on a single subinterval. And this single draw was constrasted to the numerous model simulation runs that are used to calculate the expected range for that single subinterval.]
Do you agree with the above? Did it help?
If you are still wondering about predictions vs projections:
First, don't assume that a prediction gives an exact value in physics. While in a textbook we might calculate the final position of a particle as "x=27.98". In dealing with observations, such a prediction would come with an error interval.. always! Mammal_E called this by its technical name, a "prediction interval," in comment 28.
Because the earth system is complex, the prediction interval for average global temp for the planet has a somewhat wide range for any given year as based on the model projections. This contrasts to very narrow widths for some physics predictions that rely on simple well understood systems. Regardless, for the model to be a good one, we'd want near 95% of the "independent" observations to lie in the particular model's own 95% prediction interval. You have not shown that the earth climate has been off the 95% yearly model range in significantly more than 95% of the years.
As for projections, that is like a wide set of predictions (parameterized set of implied predictions). This parameterization ("vagueness") is necessary because we don't know many of the x (sub i) variables in the future, so we provide distinct prediction graphs for several potential x values as a way to convey a general feel for what is expected to happen.
I do think you understand projections. You appear to agree that we want to look precisely only at the actual "prediction" for the actual x values that are today known but weren't back when the projections were made. You agree, I think, that to judge an earlier projection/model, we want to first pin down the observed variables and then treat the resulting statistics of the numerous model runs as the relevant prediction we are judging.
Anyway, I think you forgot that all predictions come with error ranges. To show the climate models are wrong, you can't judge them by the narrow ranges used in simple Newtonian mechanics examples but must judge by the wide boundary claimed by the models for predicting the complex earth system.
Now, you might think that using a wide error range means the model is whimpy. Yes, if we had an error range of +/- 100 C, then that model is useless as any temp we'd observe would almost surely fit in there. If you want to make that claim of whimpiness, do so, but that is a different claim than to say that the models are wrong.
And as for being whimpy, the current models predict a 95% range for 2100 that lies entirely above our current temps. In contrast, most contrarians would have a range (if they believed in using error ranges to more properly quantify their guesses) that would have a lower end way below our current temps. Also the mean of the models lies several degrees above our temp today while most contrarians would have a mean below the current temp. ["most contrarians" is a vague notion, true.]
Jose_X - No offense, but... Brevity is the soul of wit.
OK, KR, I'll try again.
Engineer, the long comment above (@59) may make a few things more clear if this next shorter version fails:
Let's perform a card draw experiment one time. We get a 2. You seem to be saying that the observed result of 2 is way below the average of 5.5. What others here say is that the 2 is within the range of the model's 95% window (if just barely). The model predicts an integer anywhere from 1 to 10, specifically, with at least 95% of the time coming in the range 2-9.
Would you say that the model for the card drawing is wrong because the single drawing of 2 is at the edge of the 95% window? So why would you say that a climate prediction is wrong if the measured earth temp lies at the edge of the 95% window?
Note, a "prediction" can be derived from the projection by taking the projection and replacing the parameters that were not known back when the projection was made.
Note, a prediction necessarily has an error range. An experiment on a simple system can yield a tight error range prediction (ie, a small "prediction interval"). Those models claim high accuracy. The climate model does not claim high accuracy. However, to say the climate is wrong you must show that the data does not easily fit within the wide error range used by the models. You seem to think that the climate models have to have a narrow range or they are wrong. Not so. While a wide range might mean the model is useless (eg, my useless model predicts the global temp this year will be between 0 C and 100 C), that in itself doesn't mean the imprecise model is wrong. In a sense, a model can be "imprecise" yet "accurate".
Note, the climate models are not that imprecise since they predict, contrary to what contrarians predict themselves, that it's very likely (over 95% confidence) that the temp in 2100 will be higher than where we are now. A useless model would peg that probability at 50%. And most contrarians peg it much less than 50%, likely making them less than useless (ie, wrong).
Here's the lead paragraph of a very informative article posted on the website of the Lawrence Livermore National Laboratory.
The article includes a sophisticated animated graphic. I highly recommend that everyone particpating in this comment thread check it out,
A human-caused climate change signal emerges from the noise by Anne M Stark, Lawrence Livermore National Laboratory, Dec 11, 2005
Math is not my favourite past time but I thought Engineer's example is what is misleading him. It has two problems. It is an example which uses integers to give an integer result, and it includes no iteration (the result of one cycle is fed into the next). As soon as you use floating point values and iterations any equation will go out of alignment within about 3-5 cycles. The opening chapter of Chaos and Fractals: New Frontiers of Science (2004) by Peitgen, Jürgens & Saupe does a nice job of showing this. It uses runs through iterative equations using diferent calculators that handle floating point rounding differently and within 3-5 iterations they rapidly get out of alignment. Just when you think you might be able to retain the illusion that one calculator might be correct they use the example of two mathematically equivalent equations with one calculator, and the same thing happens, within 3-5 iterations they are hopelessly out of alignment. The odd thing is that whilst a simulation is in a sense quite accurate it's not temporally precise.
That's the problem when you try to impose 19th century mechanistic thinking onto statistical mechanics. Once you admit statistics into reason you are saying that when you repeat an experiment you don't get the same result (if you did no need for statistics) but you might get an intelligible pattern. The use of the notion of falsifiabilty by Engineer is also misguided. It simply shows that academic logicians have not caught up with the math.
@35 Kevin C:
Very well stated. Why can't the contrarians understand this, no matter how many times it's patiently explained to them? A hiatus in surface temperatures just means that the excess energy the Earth is accumulating has been displaced somewhere else. The trend over the past 30 years or more is still relentlessly upward, and the next big el Nino event is going to make 1998 look like a walk in the park.
My fav explanation of the TOA radiative physics is here, in a guest post by Spencer Weart at RC:
A Saturated Gassy Argument
This is a genuine question. There is no malice behind it and I hope that it is answered in that context. It is pretty much the kind of question that governments may soon be asking.
Question: If we extend the GMST trend from (a) 1998 (if that year is deemed anomalous) or (b) (2000), then at what point would it be reasonable to conclude that the AGW hypothesis has been rejected based only on modelling data.
I am not saying that there are not other forms of evidence.
Please take this as a genuine question. I realise that it is possible to obfuscate
by asking me to define specific data sets, model runs etc. but I'm sure it's
clearly a question that modellers have asked.
It is probably also one that governments will askas well as many open minded
lay persons.
Thank you
@engineer #22 "doesn't matter what you call it, predictions or projections....supposed to accurately predict natural phenomenon". No. Predictions require knowing future non-natural phenomena and knowing rare natural phenomena of great consequence. Need to know relevant decisions of U.S. President in 2038, the Sino-Russian-Luxembourg government in 2077, how many volcanoes and nuclear weapons exhanges will occur, and when, meteor impacts for predictions. Can only go with projections using the numerous energy and climate basics they are using presently in the simulations (Dr. Randall says they are looking at how life in the oceans mixes water, dunno if they got to that yet). It is spooky though how this dana1981 knows what I think, sounds conspiratorial-hoaxy.
Jose,
The comment about 114/117 estimates being high came from franklefkin, not engineer, which I should have made clearer.
Any analogy can become strained if explored too literally, but my comment about the earth giving a "single run" was meant to propose that a run of forcings (volcanoes, enso effects) is like a hand of cards. A different run of forcings (say, a major el nino in 2012, and a la nina in 1998) would potentially have had us arguing in 2013 about why the models under-predicted the rise in surface temperature.
A single pick of a card is not a particularly useful analogy, because of the lack of independent tests of the model vs the real world. Of course, the degree of independence between various tests of the models depends on the time intervals being explored and the actual scientific questions being asked, which is where it becomes less useful to force the card analogy further.
On a related note, if we are considering 15-year trends, it should be remembered (by engineer, franklefin and others sympathetic to their views) that we have to go back 30 years to find a 15-year period not affected by the 1998 el nino. That is the main sense in which the last 30 years represents a "single run". Of course, there is no valid scientific reason to look at 15-year trends; it's just that the contrarians have latched onto that interval, perhaps because it maximises the distorting effect of 1998.
sereniac @65, your question assumes that falsification is results from a simple yes/no, response. That is not in fact possible. As Pierre Duhem and Willard van Orman Quine observed, any hypothesis does not face the world on its own, but rather with a host of auxilliary hypotheses. Thus, for example, when Ole Rommer noted discrepancies between the observed motions of Jupiters moons, and those predicted by Newton's laws, he had a choice between assuming that those laws had been falsified, or that Newton's assumption of an infinite velocity of light had been falsified. He chose the later, and made the first determination of the velocity of light.
Turning to the trend in GMST, the low best estimated observed trend relative to model predictions is only a problem for the model predictions given a set of assumptions about GMST. One of those assumptions is that ENSO fluctuations have little or no influence on GMST. As there is a very strong correlation between ENSO states and GMST, that assumption appears to be falsified.
(Troublingly, AGW "skeptics" do not openly acknowledge that they are making that assumption when they draw attention to the low observed trend in GMST. Nor do they indicate which other hypothesis they are calling into question to preserve their apparent "belief" in no causal connection between ENSO states and GMST in the face of the strong correlation. {I place "belief" in inverted commas because the "skeptics", in other context frequently draw attention to the connection, assuming ENSO fluctuations cause GMST fluctuations, a belief they conveniently neglect when discussing the GMST trend since 1998.} They are therefore not undertaking the most essential feature of science - ie, keeping proper score of how your beliefs are fairing against empirical data.)
Returning to your question, how long the low observed trend can continue without falsifying AGW depends essentially on what other observations are made related to our auxilliary hypotheses. Thus, should there be a large tropical volcano in the next couple of years, the trend could continue low for another five years without any qualm. A series of record breaking La Nina events would have the same effect. In contrast, with a cessation of volcanic activity, as series of strong El Ninos and a strengthening solar output, continuation of a low trend would tend to falsify the model predictions within very few years.
Finaly, even with those events, falsification is not an absolute state. Model predictions are statistical, so "falsification" of models is also statistical. Consequently there is no hard cut of such that we can say after x years the model is falsified. Rather, with each extra year of no increase in the trend (given normal ENSO states, limited volcanism and constant solar output) the probability that the models are reasonably accurate declines. Those who have studied the issue have suggested between 17 and 22 years are the limits of very low trends given current estimates of anthropogenic forcing increases and no unusual ENSO or natural forcing changes. Beyond that, and certainly beyond 30 years we could consider the models to lack some essential factor in the equation. Personally, I am a bit more impatient, and would already have rejected median or higher estimates of climate sensitivity except that three independent approaches all show the current "hiatus" to be almost entirely a product of ENSO.
@sereniac #65 You are conflating separate issues, though both related to the topic. The purpose of simulation models is not to prove that heat is being added to the ecosystem, they would be quite inapproriate for that. Proof that heat is being added to the ecosystem is derived by measuring temperature and thus heat increase (~93% goes into the oceans), knowing the physics (I think it's 130 years scientists have known that) seeing satellite measurements graphed of heat going into space, by frequency, and noting dips at the frequencies which greenhouse gases absorb then realizing the Sun heat in is unaffected but the heat out is reduced and there's only one possible result can happen from that, a few ZettaJoules/year being dumped in the oceans. Some say ice-melt too, but then they must show it's not just ocean heat from elsewhere getting shoved around the seas & air to melt ice, I stick with the basic in/out for now. So, the purpose of simulation models is to project into the future what the effects will be using what climate scientists know about natural phenomena combined with assumptions about fossil fuel use (it's my understanding that frozen methane is ignored because they just don't have a handle on it). There are 2 entirely different skeptic claims (1) AGW does not exist, heat can't move into oceans, the Suns got hotter, cosmic rays increased water vapor & warmed us, intergalactic spiral arms did it, aliens, the Oort cloud, sub-surface magma, John Travolta) and (2) AGW exists and is what it is right now but the simulation models overestimate the future heat accumulation because the underestimate cloud cooling, overestimate H20 vapor heating, overestimate albedo change effects & overestimate future loss of biomass. It is erroneous, not logical analytical thinking, to conflate these 2 separate issues.
Thank you Tom Curtis for your very informative reply.
In your final para you indicate that " that three independent approaches all show the current "hiatus" to be almost entirely a product of ENSO."
Does that mean if the ENSO variation is added to the models, the "hiatus" disappears and the long term trend is restored for the period 1998 (or so) to 2012?
I would try to verify that myself but did not have a link to go to.
Thanks again for your help.
Sereniac - climate theory does not predict that GMST will follow a simple trend from any given start year. You cannot test a theory by comparing observations against projections that it does not make.
If, however, GMST (estimated from a measurement system consistant with models) departed from the envelope of all model runs using actual forcings (which it has yet to do), for periods of say 5 years or more, then you would conclude that the models were not doing a skillful job of representing climate. That does not even necessarily imply missing physics, (could just be poor computational representation) let alone evidence that climate theory is wrong. (AGW is a corallary from current climate theory, not really a theory in itself).
To falsify climate theory you need to show the physics is wrong. eg DLR or OLR is inconsistant with atmospheric composition; the spectral signature is not what calculated; the energy imbalance at TOA suddenly disappears; that total OHC decreases - or find exceptions to physics used in climate theory (eg Clausius–Clapeyron relation not holding). Really changing climate theory would be an alternative theory that is consistant with all known physics but which describes observations better than current theory.
@sereniac #65 I stray a bit but still, if one accepts that heat was coming in because temperatures at the surface went up a bit (plus the physics) then one must ask "where will this heat go?". I did that without any prompting when I first looked at this 6 months ago and I found that 99.82% of ecosystem's heat is in water, 97.5% in oceans and I read that water is a fluid and mixes a bit compared to rocks so I concluded it goes there. So, heat has been coming in and there are 2 only possibilities (1) it goes in the oceans (2) it don't go in the oceans. I checked to see whether polystrofoam insulation layers were found in the oceans and found not excepy some gyre place. So then I thought will it in the oceans exactly the same amount each month, year & decade and all that winds and currents stuff indicated not. So, I would have been absolutely astounded, stunned, had surface temperature of the oceans risen smoothly year by year but it hasn't and I'm not.
I think I'm getting a sense for this now. (But don't hold your breath).
My understanding so far is that essentially we would have to refute many known physical laws (boltzman's law etc etc etc) in order to refute the warming hypothesis.
I also think people are saying from scaddenp's comment that say a 5 year departure
from the projection envelope would be enough to suggest that although the science is still correct, practical limits in computation/data and other issues may be the reason for it.
Tom Curtis also mentioned that some commentators have suggested a 17-22 span of very low trends would imply the models (although not necessarily the science)
was in question.
Is that a fair summary?
I think it may be an unfair question since in some ways it is like asking "At what point
do we give up on the theory that gravity applies througout the universe?"
Thanks again
Sorry the gravity analogy was very poor.
More like "At what point do we stop searching for gravitons?"
Given that GR predicts it but no evidence has accumulated so far.
thanks again
Me #66 I made a mistake with "how many volcanoes and nuclear weapons exchanges will occur" because these would only reduce temperature noticeably at the date projected by the models if they occurred with a couple of years or so prior. Otherwise, the aerosols would have grounded and surface temperatures would have lowered with no reduction in insolation or greenhouse effect so the following temperature rise would be rapid back to the interim unbalanced-ocean balance point. Would be some slight residual reduction in the warming rate because oceans would have taken less heat than projected by the models due to a couple of years or so of cooling or reduced warming, so they would do the surface hiatus thing for a while. There must be numerous other unpredictable human choices and ad hoc natural events that might or might not happen that make "prediction" an impossibility.
http://skepticalscience.com/16_years_faq.html will help fill in the ENSO influence.
You cant exactly "add" ENSO the models. ENSO-like behaviour emerges from models but it is unpredictable as is the real thing. This is primary reason why models have no skill at decadal-level projection and dont pretend to do so.
Kosaka and Xie 2013 explore what happens when you impose the actual ENSO on the climate model outputs.
@sereniac #73 There are numerous lectures on internet video if you are interested such as:
---science only---
David Randall: The Role of Clouds and Water Vapor in Climate Change - Simon Fraser University Kevin Trenberth: The Role of the Oceans in Climate - Simon Fraser University Sarah Gille : Long-term Temperature Change in the Southern Ocean - Perspectives - University of California Television climate modelling lectures by Prof Inez Fung (she has several, they all hurt my brain) Prof Inez Fung: Anatomy of a Climate Model: How Robust are Climate Projections? Professor Ted Shepherd: Understanding uncertainty in climate models
-- science & activism --
The Scientific Case for Urgent Action to Limit Climate Change - Richard Somerville Berkeley University: Dan Miller Extreme Climate Change Catastrophic Climate Change & Runaway Global Warming - David Wasdell
David Wasdell: various
Richard Muller: various
Thanks grindupbaker. Video is my favourite educational media....
I think I got a better handle on the issues but I believe it will be a hard sell to
government if the post 1998 "trend" continues for say 5 more years.
I think it is very difficult to explain to nonstatisticians that a system has components
like ENSO which simply "happen" and are unpredictable but the overall system can still be projected into the future within limits that are useful for policy.
Quantum mechanics has somewhat similar underlying principles. It is inherently statistical although no given quantum is predictable. The difference is that quantum
tunneling can be shown in the average large screen TV these days.
thanks for your explanatory efforts.
All the best
sereniac @70, I mentioned three methods that show the "hiatus" is almost completely the result of ENSO fluctuations.
The first was first implemented by John Nielsen-Gammon. He took the simple approahc of removing most of the ENSO influence by grouping years by ENSO status, then seperately taking the trend for each group:
This approach has the advantage of being intuitively obvious. If the trends for El Nino years, neutral years and La Nina years are all the same, and there is no hiatus in each category seperately, then any apparent hiatus in the full record is a product of the increased frequency of cool ENSO states (ie, La Ninas) rather than a change in the underlying trend.
The second approach was taken by Foster and Rahmstorf, who identified the ENSO, volcanic, and solar signals in the temperature record, and removed them. The result is a good approximation of what the temperature record would show without those natural variations:
The third, and most interesting, approach is that by Kosaka and Xie (also at SkS, paper linked by scaddenp @76). They ran a climate model, but constrained the tropical pacific ocean to follow historical temperature patterns, thereby forcing the model to have the actual ENSO history. Outside of the tropical Pacific, the model determined temperatures in the normal way, only with the historical ENSO influence from the constrained temperatures in the Pacific. The result was a very close match to the observed temperature record:
This approach is a little more complicated than the others, but more theoretically interesting. However, it does demonstrate very directly that (a) current model with historical ENSO patterns and forcings predicts the observed temperature record, "hiatus" and all.
These three approaches together mean that it is all over bar the shouting as to the dominant cause of the hiatus, IMO. Scientists, being scientists, continue to explore the issue because, first, there may also be other subsidiary causes, and second, it is worthwhile spending effort trying to knock down obvious explanations (if for no other reason than that is how reputations are made).
Tom
I think that is very important information.
Obviously it's out there but enhancing its availability/accessibility would be welcomed.
The deeper science is very difficult to grasp but if there is a logic and a data
exercise to support it then it makes a great deal of difference. Especially when it
addresses an emerging critique of AGW.
cheers
One more question came to mind.
If the ENSO is a kind of chaotic-emergent phenomenon that - as Tom clearly showed-
looks like the basis of the "hiatus", is there any possibility that the frequency of
ENSO could increase as part of a large scale negative feedback loop to inhibit
the long term trend?
In other words, if the climate has large scale regulatory properties, of which ENSO
looks be one and it is inherently unpredictable, then could it (or other processes)
kick in to dampen the warming trend at some point.
Again, genuinely curious.
cheerss
How AGW will affect ENSO is unknown, with theories for both more La Nina and more El Nino. It would take decades to test any theory. However, if you look at the John Neilson-gammon graph, you will slope of warming curve for La Nina years pretty much parallel to main trend. If there was no more El Nino say, then you would show a flat trend (when drawing from a previous El Nino to current La Nina) for a little while, then warming trend would continue as before. Delaying climate action due to betting on no more El Ninos would seem a bad strategy. The current run of La Nina-neutral doesnt look much out of historical normal if you look at the long term values of the index.
Sereniac #81
I think that's the most interesting question IMO. Based on the evidence we've got so far, the only sensible suggestion for the lower predictions of warming favoured by the 'skeptics' is that we get some change in ocean circulation that keeps trying to hide the heat.
We have some evidence we can call on.
Firstly, models generally predict more El Ninos with warming, so we don't know about a physical mechanism to cause a mostly La Nina state.
Secondly, back in the warmth of the Pliocene, it seems that there were permanent El Ninos (Ravelo et al., 2006), the opposite of what you'd need.
Perhaps other changes in ocean circulation outside El Nino could be a negative feedback, but aside from drastic changes like the closing of the Isthmus of Panama which triggered the Gulf Stream, or the draining of Lake Agassiz which cut it off for a bit, there isn't evidence because once again: models don't give a physical reason for it to happen, and palaeoclimate evidence suggests that the climate sensitivity (warming in response to heating, such as by CO2) is within the IPCC range (Rohling et al., 2012).
Perhaps the palaeoclimate studies caught some of the slow positive feedbacks like Arctic methane release and therefore are hiding shorter term negative feedbacks like changes in circulation but this seems a stretch given the agreement between sensitivity during different epochs when the longer term feedbacks should be different because the climate setup was different.
Even if we get permanent La Ninas, is that enough to stop warming forever? I'm not sure of any studies of this, but using the top graph from Tom @79 we might just end up on the La Nina trend line. So we'd have a one-time drop of 0.1-0.3 C which would 'hide' a decade or two of warming, then we'd be back on the same warming trend.
Thanks for the commentary regarding the notion of La Nina as a negative feedback dampener of AGW.
I have a question that has probably been asked many times before somewhere but
have not found it answered.
Q: When placed on a common graph, some models appear to be very poor compared to others. Why weren't these eliminated from the suite and the better models run more frquently? It would seem to me that this would tighten up the range of predictions.
It just seems odd to me since my natural inclination would be to eliminate those models that don't seem to map onto actual climate behaviour very well.
Thanks again
Sereniac #84:
The climate models used by the IPCC are designed to make long-range forecasts. Unless we have a time machine, we cannot jump ahead to the year 2100 say and ascertain which sets of models are performing best.
For the human race, there is no Planet B!
Thanks John.
Maybe I phrased it wrongly. Perhaps these graphs show the ability of different models to reproduce *past* climate behaviour.
If do, it would appear that a number are better than others.
My question is therefore why not select those that match past climate the best,
run those and thereby produce the projections.
I don't understand the logic of retaining models that are poor in matching
past climate.
I suspect that a number of models that are poor in matching past climate have been retained because their assumptions are reasonable/logical and that even though they may not match past climate all that well, this may be a data problem and that
*not* including them in the suite would mean that reasonable/known features of the climate would not be represented in the projections.
Is that sort of it?
[JH] You have made numerous assertions without providing a single reference or citation to identify the source of your claims. Thus your assertions are nothing more than your opinions which do not carry much weight on this site.
Clearly there is a lot of variability in the quality of evidence and debate on the AGW issue.
I have to say I have read a lot of unconvincing material on both sides of the argument.
I also understand that there is a limit to which the intelligent layman can come to terms with this material. Yet some of us try and the better we're informed, the better the outcome for all of us- i hope.
This site does at least reference some of the more respectable physics/scientific literature and is claiming I think the existence of a 60 years natural cycle which is driving climate behaviour in addition to GHGs, ENSO etc etc.
I haven't backtracked to its home page since I would prefer to encounter the arguments on their merit and I have in the past been swayed in many directions based on my judgements of the ideoloogical commitment of a source.
I would welcome any commentary on this. I have found the recent research convincing- that which identifies variation in ENSO hiding a long term warming trend.
I suspect it is unlikely that mainstream analysts would have missed a 60 year cycle and I also suspect that this assertion is based on starting points (aren't they all?) as well,
still I like to hear what people have to say and for me, the array of evidence appeared
interesting, although again it may turn out to be selective.
Thanks again
Damn
Forgot the link. http://www.appinsys.com/globalwarming/SixtyYearCycle.htm
thank you
[DB] Much of your link is addressed here:
Loehle and Scafetta find a 60 year cycle causing global warming
Thanks for the Loehle/Scafetta critique.
I have to confess that I really believe that a huge amount of the animosity and confusion associated with the AGW issue arises because there has not been open and transparent declaration and agreement on the basic assumptions behind basic positions.
It is extremely frustrating for everyone to burrow through analyses only to find what SHOULD be a known physical fact being disputed e.g. depths of ocean mixing or whatever. Or CO2 solubility or whatever.
I don't attribute blame disproportionatley here and it seems to me that all sides would achieve clarity and progress if these fundamentals were agreed to in some manifesto.
That would at least provide a focal point where analyses could be dismissed outright because they did not adhere to assumption 3.4.3.1(a) or whatever.
I realise this would be very contentious exercise in itself and some would argue just as much work as the IPCC itself, but I have to be candid, as an outsider it is somewhat like reading an orbital calculation where the altitude of the orbit is in dispute because of differences in judgements of what "counts" for the height of Everest.
It's not just silly. It's ridiculous.
Scientists should be able to reject that orbit because the height of Everest is agreed
to be Xmm plus or minus whatever due to thermal expansions, storms or whatever.
Really this seems to have become the ultimate case of apples and oranges.
Sorry if I come across as frustrated- I'm sure many of you are as well and possibly
exhausted by the number of apples you see counted as oranges.
But truly, science just cannot progress efficiently without a clear declaration and
agreement of (a) what is known and (b) what is assumed in the science of climate. Doing so must decrease the statistical uncertainties involved.
I shall go back inside my box.
Thanks again
sereniac: "there has not been open and transparent declaration and agreement on the basic assumptions behind basic positions."
As you learn more, you will tend to find the following:
- on what I will call the science side, there is pretty strong agreement about many of the basic assumptions. After all, a lot of the basics were worked out in the 1800s. (Yes, that is the 1800s. Not a typo.) For a look at this history, try this link. Scientists usually don't spend a lot of time discussing the basics that were agreed upon over 100 years ago. You learn them as an undergard, and move on.
- on what I will call the "skeptics" side (although they are clearly not true skeptics), you will discover many mutally contradictory assumptions, which change with the shifting wind. They will assume whatever will lead to the conclusion they want, and then assume the opposite in another situation. Consistency is not a priority. If you follow the Arguments menu below the Skeptical Science masthead (at the top of every SkS page) to the Contradictions page, you'll end up here, where many of the "skeptical" contradictions are listed. The "skeptics" can't even agree amongst themselves what the basic assumptions are, let alone agree with the scientists.
I take that back: the "skeptics" do have one fundamental assumption that is constant behind every argument: that the climate science is wrong. Everything else is malleable to fit that assumption.
Thanks Bob.
Unfortunately it is possible to obfuscate even the basic science unless it is codified in some form and the essential assumptions are clearly documented in a paper or analysis.
For example, it is now required that all randomised control studies and other research reveal their power calculations as part of journal submissions. There are a number of assumptions underlying that as well and they can be questioned but it helps to quickly terminate papers that have insufficient statistical power to address the null hypothesis.
I maybe naive because the depth of "declaration" of what is being assumed could
include euclidean geometry being correct, but at least amongst the sophisticated
scientists grappling with core issues, there could be a higher level and more
explicit level of declared assumptions. And there could at least be a declared
concensus or manifesto if you like of what are unchallengeable assumption underlying analyses.
I am at least able to conduct a basic MLR and understand the judgements that
apply, but it appears to me that in in addition to statistical treatment decisions, climate science often has very basic processes routinely questioned by people with
the undergraduate (at least) training to know or know better.
It is very confusing for outsiders in any field to judge the validity of arguments when credentialled people claim widely disparate conclusions based on very or mildly disparate assumptions.
I really don't expect to read a paper where the mixing depth of oceans is disputed anymore than I expect a physicist to dispute the molecular weight of carbon or
at least within agreed bounds.
Thanks again.
I've been trying to construct a layman's interpretation of the role of ENSO in AGW and came up with the following.
Apologies for the level it is pitched at, but I'm grasping for a conceptual framework
that most people can understand so that there is a better appreciation of the difficulties involved.
Thanks for any feedback.
__________________________________________________________________________
A group of researchers only has access to a single individual: Mr Jones.
The researchers are interested the phenomenon of aerobic fitness in Mr Jones and have a number of measures: resting heart rate and blood pressure, weight and BMI and time to complete a 5km treadmill run. Note that Mr. Jones is the only source of data and these measures can be obtained at any time, but there are no other research subjects.
At the end of each year the average fitness of Mr. Jones is calculated as a combination of mean resting HR, BP and treadmill time.
The researchers notice that Mr Jones has started consuming greater and greater quantities of drinks that are high in glucose. They are concerned that he will ultimately exhibit weight gain and loss of fitness even if the drinks may initially provide a short term energy boost when drunk. With weight gain comes obesity and chronic diseases.
Hence the hypothesis is that excess glucose consumption will manifest itself as a decline in average aerobic fitness and especially weight gain/BMI, increases in resting HR and BP. If this is not avoided then chronic diseases such as diabetes, heart disease etc could be evidenced in another 30 or 40 years. That is the scenario to be avoided.
It is a simple matter to measure Mr Jones’ annual aerobic fitness and as he continues to consume more glucose over say 15 years, his fitness appears to decline. Projecting this decline into the future suggests that in 30 years Mr. Jones will be obese, chronically unfit and with dangerous levels of BP.
However, Mr Jones is also invited to a fun run about every 1-2 years. Mr Jones undertakes a serious course of training for each of these runs which vary in their distance and calendar timing. The runs can take any distance between 5km and 15km and although the runs happen roughly around the same time they can be advanced or delayed by many months. Hence the intensity and length of the training cannot be predicted. But whenever Mr. Jones trains, his aerobic fitness dramatically improves. This fitness also lasts quite a while after the fun run.
On the other hand, Mr Jones is also sometimes affected by severe allergies. When this happens his activity levels drop dramatically. He can spend months doing very little at all and this diminishes his aerobic fitness a great deal. The timing of these allergies is roughly seasonal, but can happen early or late and in some years the allergies do not appear at all. In addition, while some years are very bad for his allergies, in some years they are evident, but quite mild. In short, Mr. Jones’ allergy reactions are roughly periodic but still unpredictable in timing and intensity.
The task before us is projecting Mr. Jones fitness 30 years into the future when there is an evident trend of fitness decline with an increasing consumption of glucose drinks despite the fact that (a) Mr Jones fitness can improve from fun run training and (b) it can decline from allergies yet both cannot happen at the same time.
Consider the situation where Mr. Jones appears not to be getting less fit yet over the same period he has been invited to a number of very long fun runs which required a lot of training. Can we still be confident that glucose is driving a loss of fitness?
Also consider the situation where Mr Jones has shown a rapid loss of fitness but over the same period he has had a number of long and intense allergic reactions. Can we likewise be confident that glucose is driving the loss of fitness or is it just the effects of allergies?
The situation is further complicated because Mr Jones is the only source of data. We cannot obtain information on the general role of excessive glucose consumption by measuring other people (they do not exist). Bu that would be very useful because the influence of fun runs and allergies would be more easily quantified- we would have varying timing and intensity of these influences on the fitness of many people rather than just one.
These are some of the issues involved in projecting climate on the only planet
you have.
Interesting analogy Sereniac. One thing missing from it is the quantitave apart from words like 'dramatically'.
Lets epand the analogy by saying the Mr Jones health indicators tend to rise by X when he trains for a fun run and decline by Y when has allergies. And his glucose problems cause a decline of Z per year. So how easy is it to detect Z in amongst X and Y? That depends on the relative magnitude of X, Y & Z.
If X and Y are small, Z can be detected quickly. If they are larger, Z takes much longer to detect.
Back to the ENSO issue. El Nino (X) and La Nina (Y) produce effects that can change average temperatures by +/- 0.1 to 0.2 Deg. This can mask global warming (Z) on time scales of a decade or so. But on multiple decades to a century, where global warming might cause temperature changes of 2-4 DegC (depending on what we do with emissions) then Z becomes very clear.
Mr Jones' glucose problems become apparent when he can't engage in his training for the fun run because he is hobbling along with a cane.
Sereniac,
The problem I have with that analogy is that the fitness training is not just a distractor that hides the true fitness signal, it leads to genuine improvements in fitness. The ENSO fluctuations do not lead to analagous true improvements in the global heat balance.
What if your Mr Jones is becoming morbidly obese, and this can be accurately projected using a metabolic model, but his measured weight flucutates in the short term by as much as a 2kg (eating 2kg donuts, as he does at random times, inflates his apparent weight by 2kg).
He visits the doctor immediately after a donut splurge, and posts a record weight (c.f. 1998 el nino). He then continues to eat excessively, but 15 days later, his next weight assessment happens to be just prior to his daily donut splurge. He has actually gained 1.5kg in weight, and is now posting a record empty weight (c.f. recent record la nina), but his measured weight is 0.5kg lower than the last measurement. He boasts that his weight trend is going down, and declares the doctor's metabolic model to be bogus. On the contrary, he is fatter than ever, and his next post-splurge weight is expected to break all records (c.f. next significant el nino).
A plot of his post-splurge measurements shows no overall change in the post-splurge trend, as does a plot of his pre-splurge weights (c.f the separate el nino and la nina trends in the Neilson-Gammon plot), but the short term fluctuations in apparent weight mean that he often has pseudo-pauses in his relentless weight gain. The existence of such pseudo-pauses is entirely expected in the metabolic model, though the timing of the pauses is outside the scope of the model, and an ensemble of model runs will average out the pauses so that they are not apparent. Nonetheless, he uses the pauses as an excuse to continue his unhealthy lifestyle.
Sereniac - I am personally quite wary of extended analogies. A simple analogy between a portion of a complex system and a more commonly known system may be helpful in explaining how that part of the relationship acts, but the larger and more complex the analogy the more likely it is that the reader will mis-extrapolate from it, attempting to argue back from that analogy to the complex system.
Analogies are not the original, and commonly understood relationships in the analogy may or may not map back to the complex system.
In terms of the actual climate system: ENSO variations change the Pacific ocean circulation. Sunlight comes into the climate, warms the oceans and atmosphere, and is radiated away to space - input and output. ENSO variation affect how that energy behaves when it is in the climate system.
A La Nina, with higher wind-driven exchange of deep cooler water, moves a greater portion of that incoming solar energy into the oceans, cooling the atmosphere by ~0.1 C. An El Nino reduces the deep circulation, reducing energy flow into the oceans, causing that energy to remain in the atmosphere and warm it by ~0.1 C. It's really that simple.
To summarize an important point Leto made on the analogy:
The temperature of an el nino year is like finding the weight of a person right after they put a large meal into their stomach.
The temperature of a la nina year is like finding the weight of the person right before they eat.
It should be clear that a person who is gaining weight steadily (consuming higher calories than they expend) will still likely have a lower weight tomorrow right before their large meal than they will today right after their large meal. So while their weight trend is going up, it doesn't go up in a straight line. It oscillates as they consume a meal and later burn some of it off before the next meal is due. Because the net weight gain per day is relatively small compared to the weight of each meal, the main difference on whether they weight more or less tomorrow is based on when the weight measurement is taken relative to their meals.
I find this fascinating.
I'm hoping that I'm asking semi-intelligent questions that other forum readers will find beneficial, however if this is too basic, or covered elsewhere then please tell me to depart and I will happily comply.
I completely agree with KR that extended analogies quickly lose their fidelity and can be dangerous if projected backward onto the system itself as well as extended beyond their foundation. The two slit experiment has clearly shown the conceptual limits of regarding say an electron as just a localised chunk of matter like a ping pong ball.
Glenn Tamblyn's final point:
"Mr Jones' glucose problems become apparent when he can't engage in his training for the fun run because he is hobbling along with a cane."
This raises the question about how long Mr Jones' cane hobbling can be delayed if there is a long series of intense training for fun runs. i.e. how long can the warming signature be obscured by a long series of intense la nina.
I think Mark R #81suggested that this might be of the order of 1-2 decades should a kind of permanent la nina cut in.
My "belief" is that this would be very difficult for most people to accept which is why I constructed the analogy as a lay explanation to show how long term trends can be masked by factors that are periodic but still unpredictable in intensity and duration.
This is a major issue for the perception of AGW I think because many people have great difficulty reconciling the assurance that climate systems are predictable even when major components of it are not.
I hope this is not too off-topic and political.
Thank you
KR #95 indicated:
"A La Nina, with higher wind-driven exchange of deep cooler water, moves a greater portion of that incoming solar energy into the oceans, cooling the atmosphere by ~0.1 C. An El Nino reduces the deep circulation, reducing energy flow into the oceans, causing that energy to remain in the atmosphere and warm it by ~0.1 C. It's really that simple."
Does the ocean data support these changes in energy distribution/location resulting from ENSO variation and when these data are incorporated into models does their output still support the warming trend?
I suspect this will lead to a link somewhere- which would be welcomed.
Thank you
sereniac - There is an excellent and very simple analysis by John Nielsen-Gammon, expanded upon here, on this very subject, which was discussed on SkS as well. He classified years as El Nino, La Nina, or neutral, lagging those classifications by a few months for the variations to take effect (as supported by Foster and Rahmstorf 2011), and found the following:
GISTemp global temperatures, with trends for El Niño, neutral, and La Niña years computed separately. Pinatubo years are excluded.
He notes that "The spacing between the lines is a good measure of the impact of El Niño and La Niña. All else being equal, an El Niño year will average about 0.2 C warmer globally than a La Niña year. Each new La Niña year will be about as warm as an El Niño year 13 years prior." (Emphasis added)
The trends of all three categories are all about 0.14-0.16 C/decade, depending on how you assign ENSO years, with variations superimposed on an underlying warming trend.
sereniac - Regarding your question on ocean data, I believe (IMO) that the observational uncertainties in OHC make it difficult to clearly examine ENSO changes. While I'm sure there are papers out on that topic, I don't know of any off hand. OHC is usually reported in five year running means as a result.
However, many of the global circulation models (GCMs) with sufficiently detailed ocean dynamics do produce ENSO style variations, with the rate of heat transfer to/from the deep ocean changing surface atmospheric temperatures. A recent paper by Kosaka and Xie (discussed on SkS here) ties model ENSO style variations to recorded ENSO indexes, and finds that the model accurately matches observed temperatures including the recent 'hiatus'. That is driven by a period starting with a large El Nino (1998) and ending with several La Ninas. So yes, these variations are incorporated in the models. In fact, they emerge from detailed physics - they are not 'programmed in'.
Note that the ENSO is probably best described as an aperiodic variation, somewhat chaotic and quite sensitive to starting values - which is why different models and different starting conditions will result (unless otherwise constrained) in a variety of modelled ENSO patterns.