


 Arguments


Recent Comments
Prev 845 846 847 848 849 850 851 852 853 854 855 856 857 858 859 860 Next
Comments 42601 to 42650:
-
Jubble at 08:05 AM on 13 October 2013Why climate change contrarians owe us a (scientific) explanation
Why climate alarmists owe us a (scientific) explanation
For a while now, I’ve considered AGW to be akin to superstition, which the Oxford Dictionaries site defines as “a widely held but irrational belief in supernatural influences.” I mention this because when challenged, alarmists often claim that the climate changes we are witnessing are not due to natural variability, but products of humanity. In this context, I find that 'humanity' appears to be a synonym for ‘supernatural influence’.
Why? Because they can’t explain it. Not just that: many seem to believe they are not obliged to do so, which is suspiciously convenient, and all too reminiscent of those who would claim they don’t need to ‘explain’ God. In this, they share a view once expressed in a Daily Mail forum which, to this day, remains one of my favourite alarmist non-sequiturs. When challenged, a poster calling himself Romeo 4 insisted “I don’t need to prove climate change is caused by humanity. It just is.”
....
The above could easily be the start of a blog post on WUWT or some other denial blog. The point I am making here is that to someone who has not read extensively through the science with objectivity, it is very difficult to tell the difference and therefore it is very easy for confirmation bias to occur.
The only difference would be that in a denial site there are fewer papers from which to choose, and more of the references would have to be to non-peer reviewed literature, because there isn't as much genuine science to which to refer. That issue is easily dismissed by asserting that consensus science is not science at all - you can imagine a scientific consensus building up where in fact the truth lay in the minority view.
As long as both sides of the debate look the same it will be difficult for the changes in attitude needed to cope with climate change to happen.
What is needed is a "third way" - a way to avoid the constant to and fro wrangling; to find a different direction that takes everyone with it, rather than entrenching views.
Could that be business realising that it is better to mitigate than adapt? Could it be demonstrating the benefits of change rather than the reason for those changes? Could it be discussion and quantification of risk? Or could it be something else completely?
Unfortunately I don't know - and I'll stop there to avoid getting off-topic.
-
Tom Dayton at 07:37 AM on 13 October 2013Why Curry, McIntyre, and Co. are Still Wrong about IPCC Climate Model Accuracy
Stealth, for even more about initial values versus boundary conditions, see Steve Easterbrook's post. While you're at it, go to RealClimate's Index, scroll down to the section "Climate Modelling," and read all of the posts listed there. For example, in the post "Is Climate Modelling Science?", there appears:
"I use the term validating not in the sense of ‘proving true’ (an impossibility), but in the sense of ‘being good enough to be useful’). In essence, the validation must be done for the whole system if we are to have any confidence in the predictions about the whole system in the future. This validation is what most climate modellers spend almost all their time doing."
For the umpteenth time: You need to read the Skeptical Science post "How Reliable Are Climate Models?", including both the Basic and the Advanced tabs.
For a broader and deeper discussion of how climate models are verified and validated (V&Ved), read software professor and former NASA software quality assurance guy Steve Easterbrook's explanation.
A good, short, essay on the role of computer models in science is in the journal Communications of the ACM, the September 2010 issue, page 5: Science Has Only Two Legs.
-
Tom Dayton at 07:15 AM on 13 October 2013Why Curry, McIntyre, and Co. are Still Wrong about IPCC Climate Model Accuracy
Yes Stealth, your attempt to "not be a jerk" is failing. You are vastly overestimating the breadth of your knowledge by making such ridiculous assertions as "That is hogwash. You cannot have accurate long term forecasts and inaccurate short term forecasts," when that has been explained to you over and over and over for weeks (months?). Once more, for an explanation see "The Difference Between Weather and Climate." For even more, see "Chaos Theory and Global Warming: Can Climate Be Predicted?"
Moderator Response:"You are vastly overestimating the breadth of your knowledge by making such ridiculous assertions....when that has been explained to you over and over and over for weeks...."
[PW[ Indeed, and from now on, a newly-coined parameter will be taken into account, when posters do this. It's called 'anterograde amnesia,' and continuing utilization of the technique will be considered obfuscatory, and will be appropriately moderated. Tom Curtis has patiently explained such things to you, Stealth, and you've consistently acted as if the news was...well, new. No more.
-
StealthAircraftSoftwareModeler at 06:43 AM on 13 October 2013Why Curry, McIntyre, and Co. are Still Wrong about IPCC Climate Model Accuracy
My bad. I asked for some background info and didn't see Tom's post that came in while I was typing. I'm really trying to have a good discussion and not be a jerk denier, because I'm not one. (-snip-).
Moderator Response:[DB] Sloganeering snipped. You have been pointed to resources which countermand your position. Unless you have new evidence, it is time to drop it.
-
grindupBaker at 06:26 AM on 13 October 2013Why climate change contrarians owe us a (scientific) explanation
@JRT256 #18 You can do a 1st-order approximation to gain some credibility re "temperature rebound". I'm hoping to find time off work for it myself this Christmas/Festivus. Simply estimate linear trends over a few thousand years of the temperature last 18,000 years, then integrate temperature anomalies using stated ocean heat increases and whatever you can find re ocean current rates & quantities to get this 1st-order approximation of changes in ocean heat content the last 18,000 years. Demonstrate that the last few decades of ocean heat content increase are simply a re-balancing from the few hundred prior years. Good luck.
-
StealthAircraftSoftwareModeler at 06:09 AM on 13 October 2013Why Curry, McIntyre, and Co. are Still Wrong about IPCC Climate Model Accuracy
(-snip-). That is hogwash. You cannot have accurate long term forecasts and inaccurate short term forecasts.
Rob @137 and @138: I may not be understanding the “boundary conditions” -- please explain what it is. And for the record I am referencing Tom Curtis’ chart @126. It does not, I believe, have any of the “initial conditions” you mention. The boundary in Tom’s chart @126 seems to be well defined edges of accuracy and unlikely to be crossed. But if it can be crossed and the model still be correct, then what has to happen to determine that the model is inaccurate?
Moderator Response:[DB] Sloganeering snipped.
-
MA Rodger at 05:16 AM on 13 October 2013Why climate change contrarians owe us a (scientific) explanation
There are some wonderful examples of denial on this comment thread. Elephant In The Room @36 certainly provides such an example.
The main thrust of his argument is that natural variation is very large when considered over tens of millions of years. Thus an 8ºC increase in global temperature would do nothing but return the planet to the average temperature for such a time period. And over such timescales CO2 has been measured in parts per thousand rather than the present parts per million so the level of CO2 doubling or quadrupling through the burning of fossil fuels is nothing we should 'complain' about.
"Humans are a brief visitor to this planet," he boldly tells us (I think he means "inhabitor" rather than "visitor", but whatever.) which presents a very fatalistic view of humanities future but these are large sweeping timescales being discussed. Let's be fatalistic.
These ideas are presented by Elephant In The Room as "fact" which he tells us cannot be overturned by any "scientific explanation." I am sure many would agree with such argument within its proper place.
So where is it that Elephant In The Room places this argument?It is used to objection to mitigation measures to combat AGW. This is particularly odd as AGW is a phenomenon that will act over decades and centuries, a miniscule timescale compared with the prior items of discussion.
But that doesn't matter because AGW "is a global threat that isn't really a threat." It seems precipitating an 8ºC global temperature rise that could bring mankind's terestrial "visit" to an end is not "really a threat at all."
The end of all human existence is not really a threat to humanity? I think Elephant In The Room is suffering denial and sorely needs a reality check. -
william5331 at 05:09 AM on 13 October 2013Why climate change contrarians owe us a (scientific) explanation
Please excuse the crudity but you are peeing agains the wind. Most contrarians wouldn't know a scientific thought if it bit them on the behind.
-
Eric (skeptic) at 05:05 AM on 13 October 2013Why climate change contrarians owe us a (scientific) explanation
...the change in energy levels – required to increase the global temperatures rapidly over three decades, to melt glaciers, to warm oceans...
Referring to this diagram:
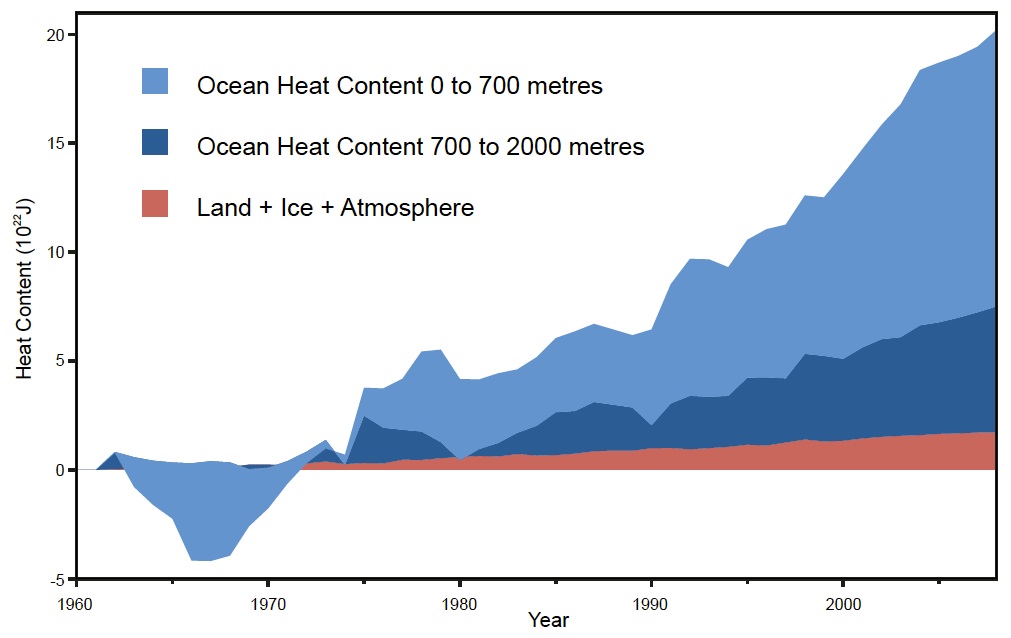
Glacier melting did and does not use much of the assumed change in energy levels. The warming oceans are supposed to account for most of the recent lull in the atmospheric temperature rise, but is the heat transfer to the oceans adequately modeled? This paper http://www.sciencemag.org/content/308/5722/685.full.pdf suggests it is not. As they say in their conclusion, the mixing described in the paper is a major uncertainty in the parameterization of mixing (in climate models). The bottom line is we don't really know how much "missing" atmospheric heat has wound up in the oceans.
Here's a climate model that won't satisfy rader5:
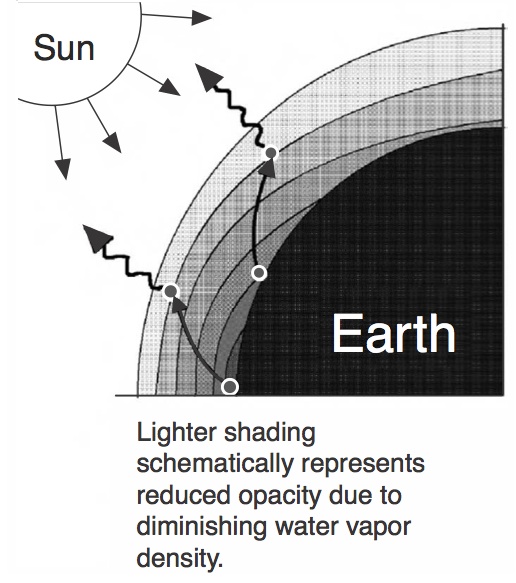
The key point in the diagram (which is from Lindzen 2007 Energy&Environment) is that the angle of the arrows representing latitudinal heat transfer is a function of parameters, not physics, in all climate models. But AFAIK, Lindzen has not provided an alternative GCM with his own cherry-picked parameters to make that point.
Matt Fitzpatrick leaves out of his list (ending with "pirates") the "weather", specifically weather that increases or decreases latitudinal heat transfer. He probably leaves it out in the belief that it affects the short run and can't explain decades of change. But I don't think that is completely correct. I would suggest to Alexandre that a potential "magical negative feedback" is weather insofar as the increased in meridional flow and consequential increased in storminess (neither are true IMO) are supposed to be from Arctic Amplification. But wouldn't that increase latitudinal heat transfer and slow global warming?
But Alexandre is correct that we ought not believe "magical negative feedback" until we see some evidence for it. I believe that long term increases and decreases in meridional flow and latitudinal heat transfer come from long term natural factors, mostly solar.
Here's a quantification of meridional heat flux journals.ametsoc.org/doi/pdf/10.1175/JCLI3539.1 (Carl Wunsch: The Total Meridional Heat Flux and Its Oceanic and Atmospheric Partition, 2005) of about 5 PW atmospheric. Dana's diagram at the top of my post shows about 1022 Joules of increase per year. 5 PW equals about 1023 Joules per year. Obviously only a small part of the 5 PW is going to be lost to space as Lindzen's simple climate model implies. But the 5PW and fluctuations in that amount are clearly a factor in earth's energy balance.
Here's an old paper showing adsabs.harvard.edu/full/1981SoPh...74..399B showing how variations in solar UV could influence climate by changing planetary waves through photochemical changes in the stratosphere. The lower stratosphere has stopped cooling in the last 15-20 years:

(Note: the middle stratosphere is still cooling substantially). I believe these variations in the lower stratosphere are part of the explanation in the lull. If I am correct we should see substantial warming in that TLS graph in the coming solar minimum as the high frequency solar UV decreases causing an overall ozone increase causing TLS warming. The TLS warming is not a direct factor in the meridional heat flux, but it represents strong variations in stratospheric temperature which lead to greater meridional heat flux.
Here's a possible explanation of high sensitivity of early 2000's climate models: journals.ametsoc.org/doi/pdf/10.1175/1520-0442(2002)015%3C1659%3AIADVOP%3E2.0.CO%3B2 (Hu: Interannual and Decadal Variations of Planetary Wave Activity, Stratospheric Cooling, and Northern Hemisphere Annular Mode) which notes the stratospheric cooling to that point (paper is from 2001) potentially caused by GHG increases (plus ozone depletion) and asks whether the stratospheric cooling causes or is caused by an increase in NAM (Arctic Oscillation). (Note that AO has been trending negative since the mid 2000's after this paper was written).
Essentially high sensitivity in the models up to the early 2000's comes from a stronger polar jet which comes from a cooling stratosphere. This decreases meridional flow and meridional heat flux and thus enhances global warming. In more recent models the polar jet is weaker and consequently sensitivity is lower. Whether Arctic Amplification plays a role in the strength of the polar jet (e.g. as explained by Jennifer Francis and others) is still undetermined. My preferred theory is that external solar factors control it although the real answer is undoubtedly a mixture of external, internal natural and anthropogenic factors.
-
DSL at 05:02 AM on 13 October 2013Why climate change contrarians owe us a (scientific) explanation
Lei: "And the truth is, you would feel far more comfortable sitting at the same dining table with the skeptics who are millionaires, than these poor folks who might steal your wallets."
Chuckle. So all poor people are thieves, and no millionaires are thieves. How medieval of you.
-
Tom Dayton at 05:00 AM on 13 October 2013Why Curry, McIntyre, and Co. are Still Wrong about IPCC Climate Model Accuracy
Stealth, your comment "First, aircraft model are not extrapolating models at all in the way that GCM operate" is irrelevant in the face of clear evidence that GCMs are successful.
Your statement "Second, the progression from aircraft design to deployment is very complex, and extensive usage of models is employed to get 'rough idea' of performance and features" is exactly true of every model, computerized or not, in every field of endeavor, throughout human history. The critical piece is the definition of "rough" in each particular use of a particular model: Is the model sufficiently accurate to serve the particular use to which you are putting it? As noted in the original post, climate models have indeed proven accurate enough to provide the information we need to choose actions to reduce greenhouse gas emissions, because the costs of not reducing are and will be far higher than the costs of reducing.
You continue to claim that climate models cannot project well enough for that use, despite the clear and robust evidence that they have, do, and will. You might as well be a newspaper editor in the early 1900s refusing to publish any reports of the Wright brothers' successful flights despite photos and your reporters' first-hand accounts, because you "know" that flight is impossible.
As for my background: PhD in cognitive science with focus on decision theory (normative and behavioral), scientific research methodology, human-computer interaction, and the combination of all those in how to use computers as decision making tools. Employment for 24 years after that, in designing software and managing software development projects. For the first 7 years of that, for the major telecommunications systems in the world. The second 7 years for critical, large scale computer server and network management. For the past 10 years, for spacecraft (both flight software that runs on the spacecraft, and ground software for mission operations).
-
Dave123 at 03:47 AM on 13 October 2013Why climate change contrarians owe us a (scientific) explanation
Elephant- What you wrote only makes sense if you are given a free pass for leaving things out and having no responsibility for the details. It is an example of magical thinking, not scientific thinking. Every word you write is aimed at exactly one outcome: stop thinking, stop investigating, stop testing, stop learning.
You've said (in paraphrase) "the earth has warmed and cooled before, CO2 levels have gone up and down", and we can stop right there with that. That's all there is too it, and the entire scientific enterprise aimed at this (despite it being that same scientific enterprise that produced the paleoclimate data you make mistakes about), is a waste of time.
The question is, is this your philosophy of life or something you wish to deceive other people into adopting?
-
Elephant In The Room at 03:19 AM on 13 October 2013Why climate change contrarians owe us a (scientific) explanation
I am curious about the thread title - Why climate change contrarians owe us a (scientific) explanation.
When you say 'us' - to whom are you referring? Skeptical Science, the IPCC scientists, the politicians, the world as a whole?
As for scientific explanation - you seem to be laying down the gauntlet for people to refute with scientific evidence something that is currently theory. The threat of man-made climate change is a theory that currently the IPCC have a 95 percent certainty in (previously 90 percent). It's all semantics. 100 percent, 90, 50. It is immaterial. We could all quote our 'out of 10' view on any given subject. It does not add weight to the argument.
If you wish to talk about facts of course then I could refer you to this planets temperature and carbon dioxide relationship. With absolute certainty I can tell you that currently we are rather cool; in fact pretty chilly. Furthermore I should also add that we are currently carbon dioxide starved. I say we; I meant to say 'the planet.' Carbon dioxide is a warming gas; for me to say otherwise would make me a denialist. I am not. However, it is my belief, and it is a belief, that the effect of the Co2 that we as humans churn out is minimal compared to the amount produced through natural variation. This is supported by the fact that in our absence on this planet (the last hundred's of millions of years) not only the temperature, but also the levels of Co2 were both equally capable of being random. One common trend however is that the mean global temperature 'is' 22 degrees C and the ppm of Co2 has been in the thousands; all without our influence.
Alternative discussion about climate change is healthy. To ask a person or persons to refute 'evidence' with 'science' is ludicrous in the same way that it would have been to ask people to challenge that the world was once deemed to be flat.
Humans are a brief visitor to this planet. They will come and go. And I can assure you that our brief incursion here will have no effect on the long term future. The reason we have coal to burn is because at one time it was in the atmosphere feeding the plethora of plant life and vegetation. Are we complaining that we are returning it to the air after it had once been sequested? Are we complaining about sea levels when we know full well that this is a natural event that occurs post Ice Epoch? Is it the planets fault that we as humans choose to build houses in coastal areas that will as history tells us become inundated again with water?
Take a good look; there is enough history there to tell you what has been and what will be again. Do you really wish to throw all your eggs in one basket for the sake of a global threat that isn't really a threat at all?
Moderator Response:[PW] Elephant, in addition to your not-so sly tone-trolling, you've made numerous unsupported-by-credible-science assertions: either back them up and support them or risk any further comments of yours being moderated, *severely.* This is your first and last warning.
Addition: All caps is a violation of comment policy and have been changed to bold.
-
Rob Honeycutt at 03:00 AM on 13 October 2013Why Curry, McIntyre, and Co. are Still Wrong about IPCC Climate Model Accuracy
SAM... You seem to have a particular interest in this issue, and it's somewhat related to your own professional expertise. And yet you seem to be failing to grasp some basic elements of GCM work.
My suggestion would be that you try to contact a researcher who is actually doing work on GCM's. I've always found researchers to be very communicative with people interested in their work. I'm sure they could help you understand their work.
This is what I believe Admiral Tilly of the US Navy did when he was skeptical of AGW. Once he had the issue of climate modeling explained to him he began to take the threats of climate change seriously.
-
Rob Honeycutt at 02:53 AM on 13 October 2013Why Curry, McIntyre, and Co. are Still Wrong about IPCC Climate Model Accuracy
SAM again... "I read that as there was only a 2.5% chance that the global temperature would reach this level."
Again, you're reading these as an initial conditions problem and not a boundary conditions problem.
If you look at any of the individual model runs, those are more likely what we would expect to see GMST do. And yes, they all wander from the 97.5%ile to the 2.5%ile. So, your statement would be inaccurate.
-
Rob Honeycutt at 02:50 AM on 13 October 2013Why Curry, McIntyre, and Co. are Still Wrong about IPCC Climate Model Accuracy
SAM said... "Nevertheless, in both my chart and yours, it is clear that global temperatures are at the very low end of the model projections."
Once again, you don't seem to be grasping the boundary conditions aspect of this problem. Scientists do not expect the GMST to follow the model mean over shorter periods. The expect the GMST to remain roughly within the model bounds. Over longer timeframes (>30 years) we would expect to see a similar trend between GMST and model outputs.
-
PhilBMorris at 02:26 AM on 13 October 2013Why climate change contrarians owe us a (scientific) explanation
I recently made the mistake of responding to an article on a denialist website by trying to rebut some really poor arguments claiming that the debate wasn't over. I gave what I thought was a quite well reasoned response, but subsequently got back several replies that were equally trite in their arguments as the original article. I have decided that 'public discussions' on any of the multitude of denialist websites is entirely a waste of time. I'm better off finishing my rather lengthy presentation designed for the lay public and taking it to meetings etc. where I can actually lay out what we know, and why we know it, and see if I can help mobilise the small segment of the population where I live (Vancouver Island, Canada) that they cannot simply sit back and let business as usual happen. Of course, I'll continue to refer to this and a number of other 'quality' sites for information; in particular, I found the article on this thread to be very helpful.
-
Tom Curtis at 01:56 AM on 13 October 2013Why Curry, McIntyre, and Co. are Still Wrong about IPCC Climate Model Accuracy
SAM @133, in fact HadCRUT4 only drops to the 8.38 percentile (%ile) in 2012, and to 7.87 %ile in 2011. In fact, over the entire period for which I have data for both CMIP 3 models and observations (1960-2012), it only once drops below the 2.5 %ile (to the 2.43 %ile) in 1976. It also drops to the 3.27 %ile in 1985 and to the 3.43 %ile in 1974.
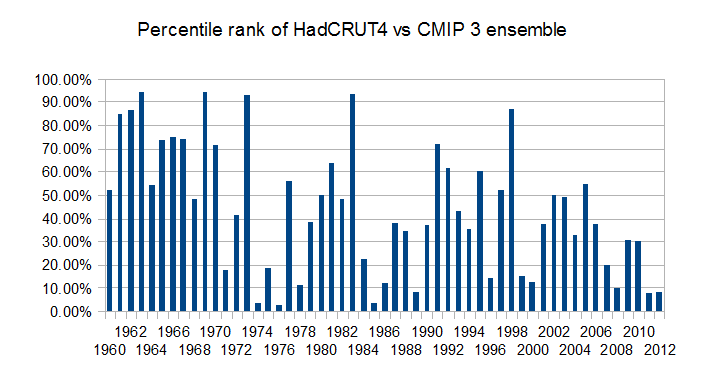
That does not look like falsification to me. In fact, given that we have 53 years of record, we would expect the record to fall below the 2 %ile at least once in the period, but it does not. Partly that is because the two records are centered on their mean between 1961 and 1990, forcing HadCRUT4 to average close to the 50th percentile over that interval, but if the models were significantly in error, we would have expected a large number of instances where the observations were below the 2.5 %ile by now.
This is not to suggest that the models are not overpredicting the warming. They are, and the fact that they are is shown in the trend in percentile ranks seen above. However, that trend will not drop the observations consistenly below the 2.5% until 2035. Further, that trend is exagerated by the use of HadCRUT4 (which does not include regions of rapid warming which are included in the models). It is further exagerated by the final points observations being during a period of strong La Ninas.
Frankly, I am surprised that you and Klapper persist in trying to prove your point based on interpretations of the faulty 2nd order fig 1.4, and misinterpretation of significance intervals (which by definition, we expect to be crossed 5% of the time if the models are accurate). It would be far better to argue directly from the results of Foster and Rahmstorf, who show observed trends around 17 C/decade after adjustment for ENSO, solar variation and volcanism. That represents a 15% undershoot on the models; and a reasonable estimate of the discrepancy between models and observations.
-
Jim Pettit at 01:31 AM on 13 October 2013SkS social experiment: using comment ratings to help moderation
I don't know that it will be an issue here, but on other climate change forums of which I am a member, the comment rating moderation system has been gamed, almost exclusively by denialists. The primary method so far as I can tell has been for certain users to create mutliple handles, then log in under those handles to repeatedly vote down every comment supportive of climate change theory, and to repeatedly vote up every comment dismissive of it. (At one popular board, certain valuable forum members nonetheless found themselves accumulating literally tens of thousands of thumbs down votes over the span of just a few months by people using this method.). IOW, such comment rating systems have become a sort of corrupt and reverse popularity contest, and have seemed to do more harm than good.
I like what a few others have suggested: a simply "flag as abusive" button. The problem with that, however, is that a dedicated group of troublemakers can just as easily game the system by piling on those flags, as well...
I wish Popular Science wouldn't have chosen to kill comments for now, but I can certainly understand their reasons for doing so.
-
StealthAircraftSoftwareModeler at 01:28 AM on 13 October 2013Why Curry, McIntyre, and Co. are Still Wrong about IPCC Climate Model Accuracy
Tom Dayton @134: I’m just curious, what is your background?
First, aircraft model are not extrapolating models at all in the way that GCM operate. Second, the progression from aircraft design to deployment is very complex, and extensive usage of models is employed to get “rough idea” of performance and features. Computer models are used in coarse design, then things progress to scale model testing in wind tunnels, but even because of the non linearity of aerodynamics and fluid properties, not even scale models are final. In the end, any thousands of hours of actual flight test of full size aircraft are used to *measure* control parameters. Rarely are model derived parameters used because of the very systematic errors of which I speak. Rest assured that the errors between the various stages of aircraft design and development easily exceed 1%. This is, in fact, the primary reason that aircraft development is so freaking expensive: test, and adjust, test and adjust, and on and on. Testing and adjusting never ever stops -- at least not until the aircraft is retired.
-
Lei at 01:22 AM on 13 October 2013Why climate change contrarians owe us a (scientific) explanation
You are preaching to the choir, aren't you?
First of all, in the US the scientists are on the same side of the fence, politically, as very uneducated people who are using tax money for subsistance programs. These followers may not even have a high school education, may be hardened criminals and likely to be using up tax dollars for multiple abortions. I know it is true, because I worked for a large social welfare program.
You can preach all day about the uneducated who are following climate skeptics, but the truth is, it is the same for your side. You have massive amounts of uneducated people who really may say they care about climate but it is far from important to them. It isn't even on their radar.
And the truth is, you would feel far more comfortable sitting at the same dining table with the skeptics who are millionaires, than these poor folks who might steal your wallets.
-
perseus at 01:15 AM on 13 October 2013Why climate change contrarians owe us a (scientific) explanation
Interestingly Nassim Taleb believes there is an even greater burden of evidence on skeptics
Implication 1 (Burden of Evidence). The burden of evidence is not on nature but on humans disrupting anything top-down to prove their errors don’t spread and don’t carry consequences. Absence of evidence is vastly more nonlinear than evidence of absence. So if someone asks “do you have evidence that I am harming the planet?”, ignore him: he should be the one producing evidence, not you. It is shocking how people can put the burden of evidence the wrong way.
Implication 2 (Via Negativa). If we can’t predict the effects of a positive action (adding something new), we can predict the effect of removing a substance that has not been historically part of the system (removal of smoking, carbon pollution, carbs from diets).
-
Jonas at 01:14 AM on 13 October 2013Why climate change contrarians owe us a (scientific) explanation
>Hamlet 4 insisted “I don’t need to prove climate change is caused by natural variability. It just is.”
I don’t need to prove climate change is caused by natural variability humans. It just is.
-
Tom Dayton at 00:41 AM on 13 October 2013Why Curry, McIntyre, and Co. are Still Wrong about IPCC Climate Model Accuracy
StealthAircraftSoftwareModeler, your claimed credentials seem more fictional the more you write. Would you really claim that "In order for aircraft models to be reliable for forecasting, there essentially cannot be any systematic errors within the model, and that is just not possible"?
-
StealthAircraftSoftwareModeler at 00:04 AM on 13 October 2013Why Curry, McIntyre, and Co. are Still Wrong about IPCC Climate Model Accuracy
Tom Curtis @126: I like your chart, and I usually like what you have to say or present. I understand the different between trend lines and comparing it to actual temperature data. At the origin (1990, +0.22 degC) of my chart @117 all lines are touching. As time advances forward, they are still very close and it is easy for the highly variable temperature data to go outside these lines (see the wide temperature swing in my chart @117 between 1998 and 2002). I think we all understand that this type of comparison isn’t meaningful in the initial stages of the forecast. But, as time advances forward the min/max trend lines become wider, and once they are as wide as the noisy temperature data, then the location of the origin really shouldn’t matter. For example, in your chart @126, you can see that the min/max trend lines are outside the 2.5%/97.5% model bands by 2013 or 2014.
Nevertheless, in both my chart and yours, it is clear that global temperatures are at the very low end of the model projections. You show the +/-2.5% bands and the current HADCRUT4 data is touching the lower 2.5% band. I read that as there was only a 2.5% chance that the global temperature would reach this level. This seems to indicate to me that the models are not very accurate. If you disagree, then how would any of you determine that the models are inaccurate? What is your method of testing and validation?
As a software modeler myself, testing is everything. In fact, in my world we have more test code than we have model code, and by a lot. Trying to gain confidence in a model is extremely difficult. Many of my models are very accurate, under specific and well defined circumstances, but outside of those conditions then my models are wildly wrong. Dana asserts in this post that “models have done much better than you think”, but for the life of me I cannot understand how he can make that claim. It doesn’t appear that Dana understands software modeling, and certainly not testing. And while I am not a GCM modeler, I have spent a bit of time reviewing the GISS Model E source code. I am not criticizing the developers of the code, but it is clear that engineers or physicists, not software engineers, have developed the code. Model E is not very large – about 100,000 lines of Fortran (a very old language) -- and some of the physics models I have examined (clouds, lapse rate, convection with respect to GCM cell size and iteration rates) are, IMO, simple and designed for limited computational resources. Yes, even with a zillion processors, what they are attempting to simulate is so complex and so large, that design and modeling simplifications have to be made. Otherwise the model will run too slow and not provide any output in our life time.
Those design and modeling simplifications are systematic errors, and essentially break the model. While I agree that true Gaussian errors will average out over time, systematic errors will not. Even very small systematic modeling errors – say 1%, which is impossible to achieve –will propagate over time and cascade into a large error. For example, let’s assume that GCMs are systematically accurate to within 1% on an annual basis. This means they *must* be able to model all aspects of the energy budget with accuracies greater than 1%. There is no way in hell they are doing that!!! Just look at the updated energy budget (http://www.nature.com/ngeo/journal/v5/n10/box/ngeo1580_BX1.html) and you can see that they have wide margins on every aspect of the budget. Climate scientists cannot measure the various components of the energy budget to within 1%, so there is no way they are modeling it to within 1%. A 1% systematic positively biased error will lead to an over estimation of +28% in 25 years (1.01 ^ 25 = 1.282), and in 100 years that same positive error will lead to an over estimation 170%.
In order for GCMs to be reliable for forecasting, there essentially cannot be any systematic errors within the model, and that is just not possible. To have no systematic error would require complete and total understanding of the climate (we don’t have that) and all physics models to include all first, second, third, and perhaps fourth order effects (and they don’t do that either). To make major economic and policy decisions based on the output of GCMs is pure and unadulterated foolishness. I form this opinion based on 30+ years of advance software modeling of physics based systems, and we are no where near 1% accuracy and what we’re working is way easier than modeling the climate. Just accept that the GCMs are wrong and not very accurate for forecasting, and that is okay; developing climate models should be useful in helping climate scientists understand the climate better. GCMs are just a tool, and like all tools they need to be used properly, otherwise someone is going to get hurt.
-
Philippe Chantreau at 23:27 PM on 12 October 2013Why climate change contrarians owe us a (scientific) explanation
"Recovery from the LIA" would then be a cause, which itself does not have a cause? Makes sense...
-
MA Rodger at 18:46 PM on 12 October 2013Why climate change contrarians owe us a (scientific) explanation
jmorpuss @29.
You present an interesting example of denial. Does the ionosphere actually dictate the climate? Are the elusive results of the ATLANT experiments elusive because they are being covered up? This, jmorpuss, is the stuff of the "reality" you speak of.
So to you, AGW is not a problem. All the climate scientists in the world are so dumb or corrupt that not one of them can see what you, a humble citizen of this planet, can see as plain as day in front of you.
Congratulations, jmorpuss. You are in denial. Any evidence of human science is irrelevant and rendered false if it supports AGW, because you know AGW is false. You are not alone. Prof. Richard Lindzen takes the same position as you do, and he is a proper climatologist, abet a rather elderly one. Lindzen ignores all the unhelpful evidence because he believes some vital ingredient is missing from the theories, some mechanism of climate that will make the problems of AGW disappear. (I'm not sure how it would make the unhelpful evidence disappear for him, but hey-ho, what do I know.)
Of course, because neither you nor Richard Lindzen are being scientific about AGW to a greater or lesser extent (you jmorpuss the greater, he Lindzen the lesser), you would neither agree with each other. Indeed Lindzen would consider you views ridiculous and insane. And he would not be alone in this opinion.
Such is the stuff of denial. Thank you for sharing it with us.
-
John Mason at 17:35 PM on 12 October 2013A rough guide to the components of Earth's Climate System
Link to NOAA's ONI page added and a screengrab of part of it dropped in above to overlay graphic :)
-
TonyW at 17:12 PM on 12 October 2013Ocean In Critical State from Cumulative Impacts
The state of the oceans is scary. But why, oh why, do apparently scientific reports keep emphasising the political limit of 2C/450ppm? Where is the current science that says anything up to 1.99C is not too bad, but 2C is terrible? Ditton 450ppm. I read something on realclimate recently which pointed at 1.9C being seen, in the past, as the lower limit of a small range of temperature rises that would consign Arctic sea ice to history. That temperature has surely been superseded by a much lower one. And the oceans are already acidifying faster than for millions of years; I can't see it being OK to limit CO2 to less than 450ppm. The urgency is even greater than this report tries to instill. -
jmorpuss at 16:55 PM on 12 October 2013Why climate change contrarians owe us a (scientific) explanation
I think if climate sience looked at reality and not debated theories and computer generated models we could all live in a better world. Do all climate change researchers get provided with the time frames when this is taking place ?LINK
And here in Australia I'd like to know if Atlant was running when Queensland got flooded? John Cook should be able to let us know http://www.australianrain.com.au/technology/howitworks.html
So as I said these links are not promoting a theory they are real and going on as we speak.
Moderator Response:[RH] Shortened links that were breaking page formatting
-
Tom Curtis at 15:58 PM on 12 October 2013Why climate change contrarians owe us a (scientific) explanation
JRT256 @20:
"Recovery from the Little Ice Age is probably one of the causes of Global Warming. To say that this is magical is possibly nonsense. Clearly if there was a cause of the LIA, then the cesation of this cause will result in recovery."
This sort of spurious reasoning is what gives "magical thinking" plausibility. Essential to JRT256's reasoning is an assumption that the "cause of the LIA" has in fact ceased to operate. But if he has not identified that cause, he cannot know that it has ceased, continued as before, or even redoubled in strength. For all he knows, climate sensitivity is far stronger than he imagines, but a redoubled strength of the "cause of the LIA" has slowed the anthropogenic global warming.
The only way around this quandary is to actually identify the cause of the LIA; and to then identify what it is currently doing,ie, to go beyond vague formulations in terms of "recovery from the LIA". Failure to do this, ie, simply assuming that the "cause of the LIA" is behaving in the way that best suites your intellectual prejudices amounts to magical thinking.
Curiously, when the actual causes of the LIA are looked into, it is found that the primary cause of the LIA was a period of greater than usual volcanism creating an aerosol veil sheltering us from the sun; which indeed did cease in the early twentieth century and the cessation of which did contribute to the early twentieth century rise in temperatures. Of course, volcanism has been renewed since then, and the rise in temperatures in the late twentieth century is opposite in trend to that which would be expected from natural (solar and volcanic) causes.
-
Bert from Eltham at 15:54 PM on 12 October 2013Why climate change contrarians owe us a (scientific) explanation
DSL it all reminds me of epicycles and the problems of turbulent fluid flow. Throw in enough epicycles or non sense variables and one can model anything we do not understand.
I find it absolutely amazing that people will rubbish computer models that are based on known physics and yet grasp at any 'magic' models that are based on short term curve fitting.
These same ignorant people will then accuse scientists of the very same fallacy they are committing all far outside the error bars that they cannot even begin to evaluate or contemplate. Bert
-
DSL at 14:47 PM on 12 October 2013Why climate change contrarians owe us a (scientific) explanation
JRT256, there's nothing in the article or in the comment stream that provides an overwhelmingly obvious antecedent for the target of your use of "explanation." I certainly would not have expected you to assume the reader would identify 'global warming over the last fifty years' as the target. Rob and Bert explain why. I also have a hard time accepting this quasi-periodic wave is independent of rapid and deep changes in the climate system. The physical mechanisms through which the wave is propagated are changing. To imagine that this wave persists through that change in such a way as to be used to reliably project a future hiatus in surface temp requires too great a suspension of disbelief. Ironically, Curry works on a project that seems ideal fodder for her uncertainty monster.
-
Rob Honeycutt at 14:29 PM on 12 October 2013Why climate change contrarians owe us a (scientific) explanation
JRT256... What would also be required here is an explanation as to why CO2 doesn't operate as we expect, and observe, to explain current warming.
In other words, you can't just dismiss the well understood radiative physics of greenhouse gases. You also have to take into account a whole host of things that are predicted results. Cooling stratosphere with a warming troposphere. Arctic amplification. Etc.
And again, for natural variation to be a rational explanation, you'd also have to show that global temperature has varied at least as much and as rapidly over the past 1000-2000 years. That, so far, has been shown not to be the case.
-
Bert from Eltham at 14:14 PM on 12 October 2013Why climate change contrarians owe us a (scientific) explanation
JRT256 the article you referred to in 18 is an attempt to describe 'natural variation'. It is for the Northern Hemisphere only and it does not propose any real physical mechanism for its affects. Just some vague hand waving of so called multi temporal and spatial interactions. It does not account for the linear increase in temperature due to anthropogenic CO2. It does not disprove AGW due to the increase in atmospheric CO2. For the analysis to work at all the linear AGW signal has to be subtracted from the data.
What is does do is show that AGW is not due to 'natural variation'! The opposite of what deniers are claiming. Bert
-
william5331 at 13:58 PM on 12 October 2013Ocean In Critical State from Cumulative Impacts
http://mtkass.blogspot.co.nz/2010/12/fisheries-policy-lets-change-tacks.html
-
JRT256 at 13:50 PM on 12 October 2013Why climate change contrarians owe us a (scientific) explanation
DSL: Re #21 Did you bother to read the article that you are commenting on?
-
JRT256 at 13:42 PM on 12 October 2013Why climate change contrarians owe us a (scientific) explanation
DSL: Re #19 I thought that was obvious.
Well, the natural variation discussed in the paper is occuring but we had no idea of the causation. If this explaination is correct, we now understand the causation. Before we understood the causation, it was unexplained natural variation. But, it was still natural variation that existed, not magic.
With new science happening all of the time, doesn't this also apply to other unexplained natural variation as well? -
DSL at 13:40 PM on 12 October 2013Why climate change contrarians owe us a (scientific) explanation
Aye yai yai, JRT256. Take it to the appropriate thread:
-
JRT256 at 13:29 PM on 12 October 2013Why climate change contrarians owe us a (scientific) explanation
Recovery from the Little Ice Age is probably one of the causes of Global Warming. To say that this is magical is possibly nonsense. Clearly if there was a cause of the LIA, then the cesation of this cause will result in recovery.
One of the hypotheses of the cause of the LIA is the Maunder Minimum in the Sunspot cycle. This would also mean that the cooling did not effect only Europe (an idea that appears to be the Lamp Post theory). I note that Wikipedia lists some global evidence with citations.The same could also be said of other causes. The point is not what the cause was but rather that if there was a globe wide cause of the LIA, only the cesation of this cause is all that is necessary for the recovery and a return to nominal temperatures.
-
DSL at 12:57 PM on 12 October 2013Why climate change contrarians owe us a (scientific) explanation
JRT256, a "reasonable explanation" for what?
-
JRT256 at 12:46 PM on 12 October 2013Why climate change contrarians owe us a (scientific) explanation
OTOH, with new science happening all of the time:
http://bit.ly/15ZXaRCperhaps natural variation is a reasonable explaination.
-
jmorpuss at 11:44 AM on 12 October 2013Why climate change contrarians owe us a (scientific) explanation
"In a time of Universal Deceit, telling the truth becomes a revolutionary act. - George Orwell" The truth will set us free http://www.thrivemovement.com/the_code-new_energy_technology The way to control the massed is to control knowledge so all we get is propaganda http://en.wikipedia.org/wiki/Propaganda Here's a bit of history that may through some light on why we are in this hole of confussion http://educate-yourself.org/ga/RFcontents.shtml
-
Rob Honeycutt at 11:36 AM on 12 October 2013Why climate change contrarians owe us a (scientific) explanation
joeygoze... What you fail to recognize is that, for each one of the papers you list, there are close to 100 others that do make such connections.
On natural variation, the very point to multiproxy reconstructions of the past 1000+ years is to look at natural variation relative to the trend of the past 100 years. There are a dozen or so of these studies and everyone of them shows that the warming of the past century is unprecedented.
Now, I frequently ask people such as yourself: Where is a multiproxy reconstruction that contradicts these conclusions? The fact is, there are none.
-
Why climate change contrarians owe us a (scientific) explanation
joeygoze - I see you've been reading the denial site notrickszone, as those appear to be the first 10 links from one of Gosselin's posts.
However, the actual content in those papers really doesn't match Gosselin's rhetoric, does not contradict the general view of AGW. As but one exemplar: the second link, Stephen Po-Chedley and Qiang Fu 2012, is a discussion of errors detected in the satellite temperature record. If those errors are real, and are properly accounted for, the satellite data is in far better agreement with surface temperatures - and provides additional support for anthropogenic warming. In fact, if they are correct about the errors in the satellite record, arguments from the 'skeptic' producers of some of that data (Spencer and Christy) is considerably weakened. Clearly that paper wasn't actually read or understood when compiling the list...
Many (most?) of Gosselin's links are from PopTech's list - a cherry-picked list of papers (and op-eds) that he (mis)interprets as possibly (in PopTech's opinion) contradicting AGW, despite in several cases objections from the authors of said works. They do include some works that directly disagree with AGW - including several from Scafetta (curve-fitting), from W. Soon (over the top misrepresentation), etc. And many of those have been refuted/debunked.
Link-bombing (as in Gossilen's post) only works if you don't actually read the links, or don't consider that even with a few cherry-picked articles, the vast majority of the work in the field finds those views to be unsupported outliers. If you feel that there are significant objections, I suggest you discuss them directly, rather than posting bare links.
-
tmac57 at 10:24 AM on 12 October 2013Why climate change contrarians owe us a (scientific) explanation
Beautifully written gpwayne.I pulled 5 quotes from the article that should go down in climate science history. Thank you
-
Trevor_S at 09:18 AM on 12 October 2013Global warming – a world of extremes and biological hotspots
#5 Jason B
A good analogy would be an overweight person eating a chocolate eclair and then cursing themself, saying "Oh, no, I couldn't resist the temptation, now I've eaten it and it's too late to go on a diet". Sure, having eaten that eclair they will now have to work harder to achieve their weight goals, or else they will forever be further from that goal than they would have been had they not eaten that eclair with all else being equal, but that doesn't mean there's no benefit in working on their weight problem from that point forward.
A better analogy might perhaps be you chopped your arm off in a moment of hallucianitory insanity. You ignored that you knew it would make things worse for you but none the less, Murdoch etal told you it was "the shizzle". Sure, superb surgeons can rattach it and you will get some function back (Geoengineering) and if you are rich (Annex 1 nations) you might get back better use then someone who can't afford the best sugeons (developing world), none the less it isn't going to return to "how it was", there is too much forcing for that to occur.
I still see people expecting Government to do the heavy lifting for them, blaming Government for their own emmissions. It's long past time to blame others and we have to start blaming the people who look out at us from the mirror. We are the emitters, we are the obese, the smokers (insert whatever analogy works for you). It's nonsenseical on the one hand to keep emitting, while imploring Government to stop us, that's like asking your mother to tie your shoes for you because you're to lazy.
We do need Government to act to stop the free rider problem BUT we can start. We can act, we can cut back, we can apply peer pressure. We can not turn the A/C on, we can not drive, we can stop flying etc etc. Demand side reduction is the only thing that might mitigate the damage we've done, while still proceeding with supply side change.
If Government acted tomorrow with supply side changes, it would take decades to roll out the necessary infrastructure to ensure substantive emissions reduction and this article brings home the urgency of acting now.
So, what are the options ? Keep emitting while we wait for someone esle to do something on our behalf ?
Professor Kevin Anderson (Tyndal Climate Centre) explains it nicely here in this lecture
http://www.youtube.com/watch?v=RInrvSjW90U
I am not holding myself up as a role model, just pointing out it can be done. Four years ago I gave up my job, we moved to a milder climate, in a "cheap" (housing) rural area. We are off the grid for power and water, stoped consuming gee gaws from China (cutting their emissions for them), stoped flying etc. I live off a small stipend from invesments, not welfare.
-
Ken in Oz at 08:52 AM on 12 October 2013Why climate change contrarians owe us a (scientific) explanation
"Deus ex Machina" is the crucial plot element in the climate science denier's version of the climate story; just when it looks like they might have to eat their words some new element will emerge that fixes it all and they can say "told you so". It may be God loving us so much we will be let off from having to live with the real world consequences of our actions, even though we've known about the big one since the start of the Industrial Revolution. Or it may be bioengineered trees that suck CO2 out of the air and sequester it so well we can burn as much coal and gas and oil as we like. Or all the smart and worthy people will colonise Mars, where global warming really is "good" and there are no natural ecosystems for greenies to obsess over; those that have to stay behind can serve a useful role in paying for their migration to a better world.
-
joeygoze9259 at 08:45 AM on 12 October 2013Why climate change contrarians owe us a (scientific) explanation
Dare I jump into the shark tank here, one premise I find alarming is that there appears to be agreement that there is no body of primary research that discusses natural variability, solar influences, temperature reconstructions that do not jibe with man induced global warming hypothesis and other topics. I am not making any ad hominem attacks, not insulting anyone, just listing primary research from per reviewed journals. I list 10 papers here but there are hundreds of primary research works that present interesting evidence to consider.
(-snip-)
Moderator Response:[DB] Links lacking context snipped per the Comments Policy.
-
Paul D at 06:48 AM on 12 October 2013Why climate change contrarians owe us a (scientific) explanation
Contrarians aren't intrested in getting a scientific or factual result.
They are interested in the argument, winning or neutralising it.
Prev 845 846 847 848 849 850 851 852 853 854 855 856 857 858 859 860 Next


