


 Arguments


The Beginners Guide to Representative Concentration Pathways - Part 3
Posted on 28 August 2013 by gpwayne
This post is part 3 of a three part series exploring the Representative Concentration Pathway (RCP) scenarios that have replaced the IPCC Special Report on Emissions Scenarios (SRES).
To view the full guide as an on-line resource, please click here.
A PDF of the complete guide is now available for download here
Contents (click to navigate)
RCP Information, Data Types and Resolutions
Emissions and concentrations, forcings and temperature anomalies (table)
Energy sources at years 2000 and 2100
Comparisons with SRES equivalents
Extended Concentration Pathway Emissions and Forcing
Part 3: RCP technical summary
This section contains a summary of the key metrics and assumptions that define the RCP architecture: emissions trajectories and concentrations, energy use, population, air pollutants and land use, and the consequent radiative forcing and temperature anomalies specified by each of the four RCP pathways.
The data employed in the development of the RCPs is drawn from the published literature. Each RCP was developed by an Integrated Assessment Modeling (IAM) group, whose published scenario papers were consistent with the base criteria for a particular RCP. Each team then surveyed and created synthesis data sets from available representative studies, which were reviewed repeatedly by different stakeholders. The final agreed set of RCPs was published:
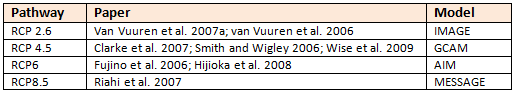
Table 2: RCP-specific publications and model group responsible.
For comprehensive discussions of development methodologies and complete technical information on any RCP, please see the further reading section at the end of this guide.
An important note about socio-economic data
The underlying assumptions about socio-economic trajectories and priorities are not consistent between the RCPs. This quote from van Vuuren 2011 makes clear this point (emphasis added):
“The RCPs were selected from the existing literature on the basis of their emissions and associated concentration levels. This implies that the socio-economic assumptions of the different modeling teams were based on individual model assumptions made within the context of the original publication, and that there is no consistent design behind the position of the different RCPs relative to each other for these parameters.
Scenario development after the RCP phase will focus on developing a new set of socio-economic scenarios. Therefore, socio-economic parameters have not been included in the RCP information available for download. Still, this information does form part of the underlying individual scenario development, and thus provides useful information on internal logic and the plausibility of each of the individual RCPs”
van Vuuren et. al, 2011
Socio-economic data does not form any part of the RCP database. Please note that in this guide, as in van Vuuren 2011, the primary socio-economic characteristics are discussed here only in the context of the RCP development.
RCP Primary Characteristics
RCP 8.5 was developed using the MESSAGE model and the IIASA Integrated Assessment Framework by the International Institute for Applied Systems Analysis (IIASA), Austria. This RCP is characterized by increasing greenhouse gas emissions over time, representative of scenarios in the literature that lead to high greenhouse gas concentration levels (Riahi et al. 2007).
RCP6 was developed by the AIM modeling team at the National Institute for Environmental Studies (NIES) in Japan. It is a stabilization scenario in which total radiative forcing is stabilized shortly after 2100, without overshoot, by the application of a range of technologies and strategies for reducing greenhouse gas emissions (Fujino et al. 2006; Hijioka et al. 2008).
RCP 4.5 was developed by the GCAM modeling team at the Pacific Northwest National Laboratory’s Joint Global Change Research Institute (JGCRI) in the United States. It is a stabilization scenario in which total radiative forcing is stabilized shortly after 2100, without overshooting the long-run radiative forcing target level (Clarke et al. 2007; Smith and Wigley 2006; Wise et al. 2009).
RCP2.6 was developed by the IMAGE modeling team of the PBL Netherlands Environmental Assessment Agency. The emission pathway is representative of scenarios in the literature that lead to very low greenhouse gas concentration levels. It is a “peak-and-decline” scenario; its radiative forcing level first reaches a value of around 3.1 W/m2 by mid-century, and returns to 2.6 W/m2 by 2100. In order to reach such radiative forcing levels, greenhouse gas emissions (and indirectly emissions of air pollutants) are reduced substantially, over time (Van Vuuren et al. 2007a). (Characteristics quoted from van Vuuren et.al. 2011)
RCP Information, Data Types and Resolutions
The following table shows the data types available for the RCPs, the sectors by which emissions are broken down, and the geographical resolution of the information:
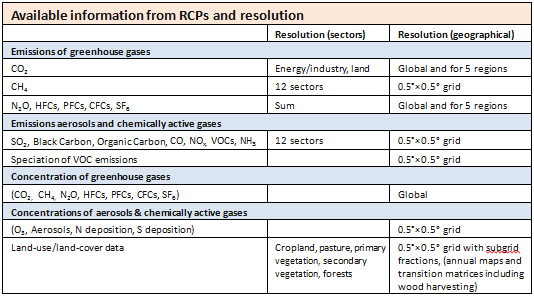
Table 3: from van Vuuren et.al. 2011
Emissions and concentrations, forcings and temperature anomalies
Each Representative Concentration Pathway (RCP) defines a specific emissions trajectory and subsequent radiative forcing (a radiative forcing is a measure of the influence a factor has in altering the balance of incoming and outgoing energy in the Earth-atmosphere system, measured in watts per square metre):
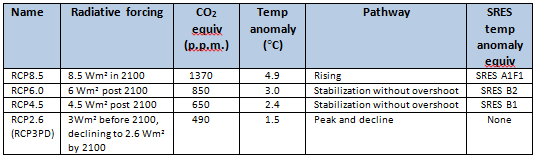
Table 4: from Moss et.al. 2010. Median temperature anomaly over pre-industrial levels and SRES comparisons based on nearest temperature anomaly, from Rogelj et.al. 2012
Radiative Forcings
The graph below shows radiative forcing trajectories for the four RCPs, the other candidate scenarios that informed the final versions, and the modelling group associated with each.
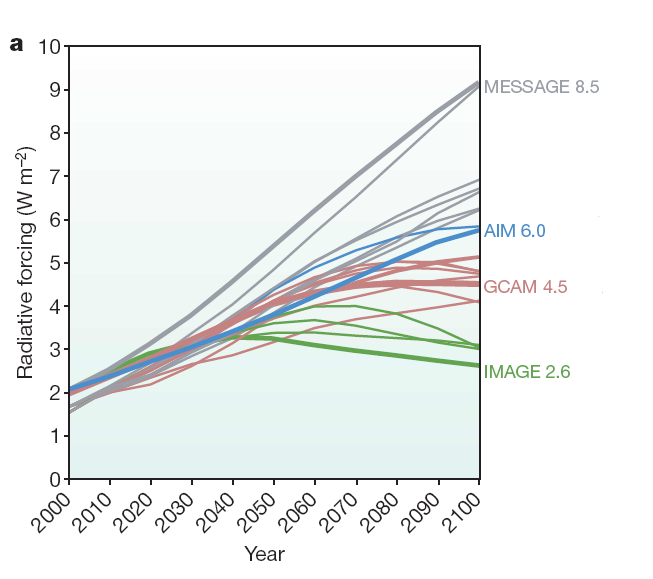
Figure 7: Changes in radiative forcing relative to pre-industrial conditions. Bold coloured lines show the four RCPs; thin lines show individual scenarios from approximately 30 candidate RCP scenarios that provide information on all key factors affecting radiative forcing… (Moss et.al., 2010)
The forcing trajectories are consistent with socio-economic projections unique to each RCP. For example, RCP2.6 (RCP3PD) assumes that through drastic policy intervention, greenhouse gas emissions are reduced almost immediately, leading to a slight reduction on today’s levels by 2100. The worst case scenario - RCP8.5 - assumes more or less unabated emissions.
RCP Emission Trajectories

Figure 8: Emissions of main greenhouse gases across the RCPs. Grey area indicates the 98th and 90th percentiles (light/dark grey) of the literature…The dotted lines indicate four of the SRES marker scenarios. Note that the literature values are not harmonized (from van Vuuren et.al. 2011). Click image for larger version
“The CO2 emissions of the four RCPs correspond well with the literature range, which was part of their selection criterion (Fig. 8). The RCP8.5 is representative of the high range of non-climate policy scenarios. Most non-climate policy scenarios, in fact, predict emissions of the order of 15 to 20 GtC by the end of the century, which is close to the emission level of the RCP6. The forcing pathway of the RCP4.5 scenario is comparable to a number of climate policy scenarios and several low-emissions reference scenarios in the literature, such as the SRES B1 scenario. The RCP2.6 represents the range of lowest scenarios, which requires stringent climate policies to limit emissions.
“The trends in CH4 and N2O emissions are largely due to differences in the assumed climate policy along with differences in model assumptions (Fig. 8). Emissions of both CH4 and N2O show a rapidly increasing trend for the RCP8.5 (no climate policy and high population). For RCP6 and RCP4.5, CH4 emissions are more-or-less stable throughout the century, while for RCP2.6, these emissions are reduced by around 40%. The low emission trajectories for CH4 are a net result of low cost emission options for some sources (e.g. from energy production and transport), and a limited reduction for others (e.g. from livestock)” (van Vuuren et.al. 2011)
Greenhouse Gas Concentrations
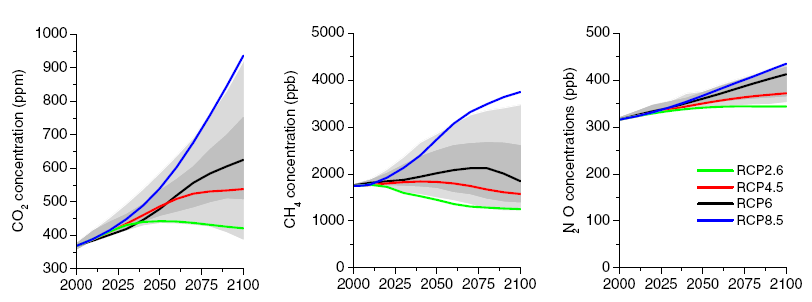
Figure 9: Trends in concentrations of greenhouse gases (van Vuuren 2011). Grey area indicates the 98th and 90th percentiles (light/dark grey) of the recent EMF-22 study (Clarke et al. 2010) Click image for larger version
“The greenhouse gas concentrations in the RCPs closely correspond to the emissions trends discussed earlier . For CO2, RCP8.5 follows the upper range in the literature (rapidly increasing concentrations). RCP6 and RCP4.5 show a stabilizing CO2 concentration (close to the median range in the literature). Finally, RCP2.6 has a peak in CO2 concentrations around 2050, followed by a modest decline to around 400 ppm CO2, by the end of the century. For CH4 and N2O, the order in which the RCPs can be placed are also a direct result of the assumed level of climate policy. The trends in CH4 concentrations are more pronounced, as a result of the relatively short lifetime of CH4. Emission reductions, as in the RCP2.6 and RCP4.5, therefore, may lead to an emission peak much earlier in the century. For N2O, in contrast, a relatively long lifetime and a modest reduction potential imply an increase in concentrations, in all RCPs. For both CH4 and N2O, the concentration levels correspond well with the range in the literature. Further information on the calculations of concentration can be found in Meinshausen et al. (2011b)” (van Vuuren et.al. 2011).
Atmospheric Air Pollutants

Figure 10: Emissions of SO2 and NOX across the RCPs. Grey area indicates the 90th percentile of the literature (only scenarios included in Van Vuuren et al. 2008b, i.e. 22 scenarios; the scenarios were also harmonized for their starting year—but using a different inventory). Dotted lines indicate SRES scenarios. The different studies use slightly different data for the start year. (van Vuuren et.al. 2011) Click image for larger version
“The RCPs generally exhibit a declining trend of air polluting emissions. The emission trends for air pollutants are determined by three factors: the change in driving forces (fossil- fuel use, fertilizer use), the assumed air pollution control policy, and the assumed climate policy (as the last induces changes in energy consumption leading to changes (generally reductions) in air polluting emissions). We have illustrated the trends in air pollutants by looking at SO2 and NOx (Fig. 10). In general, similar trends can be seen for other air pollutants.
“All RCPs include the assumption that air pollution control becomes more stringent, over time, as a result of rising income levels. Globally, this would cause emissions to decrease, over time—although trends can be different for specific regions or at particular moments in time. A second factor that influences the results across the RCPs is climate policy. In general, the lowest emissions are found for the scenario with the most stringent climate policy (RCP2.6) and the highest for the scenario without climate policy (RCP8.5), although this does not apply to all regions, at all times”. (van Vuuren et.al. 2011).
Radiative Forcing Trends
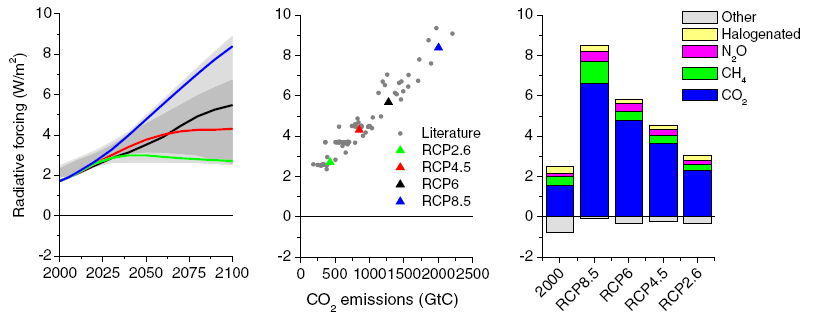
Figure 11: Trends in radiative forcing (left), cumulative 21st centuryCO2 emissions vs 2100 radiative forcing (middle) and 2100 forcing level per category (right). Grey area indicates the 98th and 90th percentiles (light/dark grey) of the literature. The dots in the middle graph also represent a large number of studies. Forcing is relative to pre-industrial values and does not include land use (albedo), dust, or nitrate aerosol forcing (van Vuuren 2011). Click image for larger version
Population and GDP
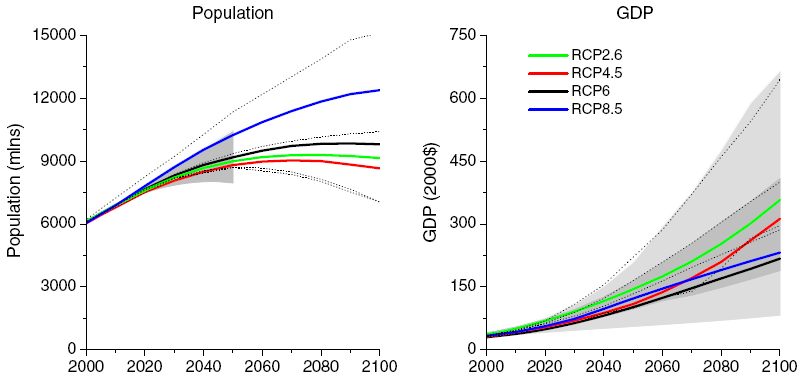
Figure 12: Population and GDP projections of the four scenarios underlying the RCPs (van Vuuren et.al. 2011). Grey area for population indicates the range of the UN scenarios (low and high) (UN 2003). Grey area for income indicates the 98th and 90th percentiles (light/dark grey) of the IPCC AR4 database (Hanaoka et al. 2006). The dotted lines indicate four of the SRES marker scenarios. Click image for larger version
“The population and GDP pathways underlying the four RCPs are shown in Fig. 12. The figure also shows, as reference, the UN population projections and the 90th percentile range of GDP scenarios in the literature on greenhouse gas emission scenarios. Figure 12 shows the RCPs to be consistent with these two references. It should be noted that, with one exception (RCP8.5), the modeling teams deliberately made intermediate assumptions about the main driving forces (as illustrated by their position in Fig. 12)…In contrast, the RCP8.5 was based on a revised version of the SRES A2 scenario; here, the storyline emphasizes high population growth and lower incomes in developing countries”. (van Vuuren et.al. 2011).
Energy and oil consumption
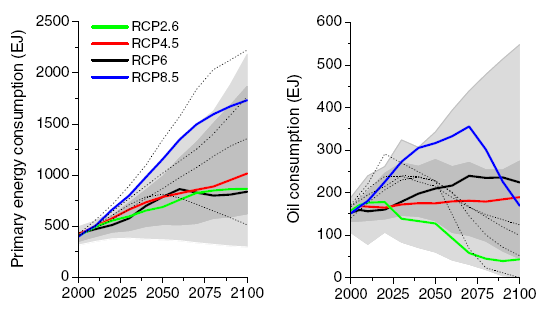
Figure 13: Development of primary energy consumption (direct equivalent) and oil consumption for the different RCPs (van Vuuren et.al. 2011). The grey area indicates the 98th and 90th percentiles (light/dark grey) (AR4 database (Hanaoka et al. 2006) and more recent literature (Clarke et al. 2010; Edenhofer et al. 2010). The dotted lines indicate four of the SRES marker scenarios
“For energy use, the scenarios underlying the RCPs are consistent with the literature— with the RCP2.6, RCP4.5 and RCP6 again being representative of intermediate scenarios in the literature (resulting in a primary energy use of 750 to 900 EJ in 2100, or about double the level of today).
“The RCP8.5, in contrast, is a highly energy-intensive scenario as a result of high population growth and a lower rate of technology development”. (van Vuuren et.al. 2011).
Energy sources at years 2000 and 2100

Figure 14: Energy sources by sector (van Vuuren et.al. 2011)
“In terms of the mix of energy carriers, there is a clear distinction across the RCPs given the influence of the climate target. Total fossil- fuel use basically follows the radiative forcing level of the scenarios; however, due to the use of carbon capture and storage (CCS) technologies (in particular in the power sector), all scenarios, by 2100, still use a greater amount of coal and/or natural gas than in the year 2000. The use of oil stays fairly constant in most scenarios, but declines in the RCP2.6 (as a result of depletion and climate policy).
The use of non-fossil fuels increases in all scenarios, especially renewable resources (e.g. wind, solar), bio-energy and nuclear power. The main driving forces are increasing energy demand, rising fossil-fuel prices and climate policy. An important element of the RCP2.6 is the use of bio-energy and CCS, resulting in negative emissions (and allowing some fossil fuel without CCS by the end of the century)”. (van Vuuren et.al. 2011).
Land Use

Figure 15: Land use (crop land and use of grass land) across the RCPs. Grey area indicates the 90th percentile of scenarios reported in the literature (taken from Smith et al. 2010). Vegetation is defined as the part not covered by cropland or anthropogenically used grassland. (van Vuuren et.al. 2011). Click image for larger version
“A crucial element of the new scenarios is land use. Land use influences the climate system in many different ways including direct emissions from land-use change, hydrological impacts, biogeophysical impacts (such as changes in albedo and surface roughness), and the size of the remaining vegetation stock (influencing CO2 removal from the atmosphere). Historically, cropland and anthropogenic use of grassland have both been increasing, driven by rising population and changing dietary patterns. There are far fewer land-use scenarios published in the literature than emission or energy-use scenarios. Moreover, far less experience exists with scenario projections (Rose et al. 2011; Smith et al. 2010). Most projections focus on a shorter time period (up to 2030 or 2050) and show an increasing demand for cropland and pasture.
“The limited experience in global land-use modeling as part of integrated assessment work is also reflected in the RCP development process. Compared to emission modeling, definitions of relevant variables and base year data differ more greatly across the IAMs for the land use components.
“The RCPs cover a very wide-range of land-use scenario projections. This is illustrated by the trends shown in Fig. 15 (i.e. after harmonization). The use of cropland and grasslands increases in RCP8.5, mostly driven by an increasing global population. Cropland also increases in the RCP2.6, but largely as a result of bio-energy production. The use of grassland is more-or-less constant in the RCP2.6, as the increase in production of animal products is met through a shift from extensive to more intensive animal husbandry. The RCP6 shows an increasing use of cropland but a decline in pasture. This decline is caused by a similar trend as noted for RCP2.6, but with a much stronger implementation. Finally, the RCP4.5 shows a clear turning point in global land use based on the assumption that carbon in natural vegetation will be valued as part of global climate policy. As a result of reforestation programs, the use of cropland and grassland decreases, following considerable yield increases and dietary changes”. (van Vuuren et.al. 2011).
Comparisons with SRES equivalents
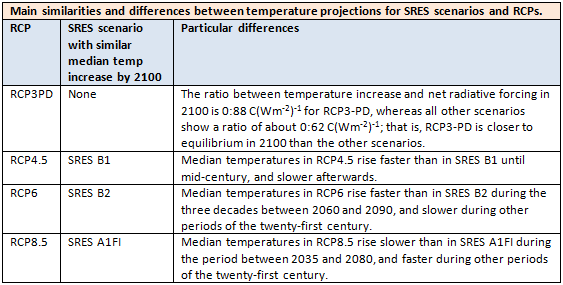
Table 5: From Rogelj et.al. 2012
Extended Concentration Pathway Emissions and Forcing
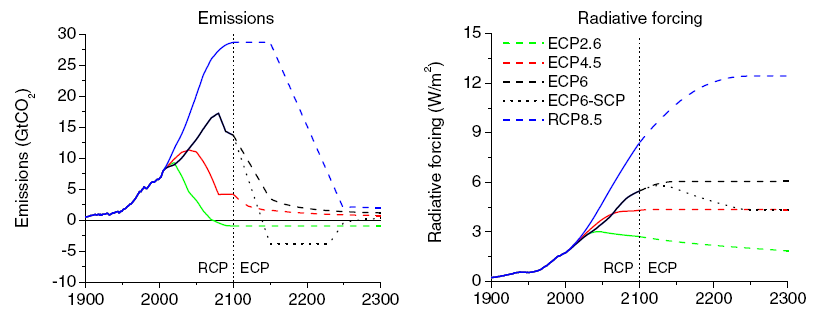
Figure 16: Extension of the RCPs (radiative forcing and associated CO2 emissions) from van Vuuren 2011. (ECP is Extended Concentration Pathway). The SCP6to4.5 (supplementary concentration pathway) shows an alternative extension for RCP6…(Meinshausen et al. 2011b). Click image for larger version
Figure 16 shows the CO2 emissions and radiative forcing trajectories for each of the four extensions of the RCPs (ECPs). As explained in the method sections, these have not been based on integrated assessment modeling, but on simple extension rules consistent with the rationale of each of the RCPs to which they connect. This has resulted in a set of extended concentration pathways to be used for climate model runs.
An on-line resource of this guide is now available here: www.skepticalscience.com/rcp.php
The guide can also be downloaded as a PDF by clicking here.
Further Reading:
Summary Publications
Towards New Scenarios for Analysis of Emissions, Climate Change, Impacts, and Response Strategies, IPCC Expert Meeting Report, 19–21 September, 2007
The representative concentration pathways: an overview, van Vuuren et. al 2011, Climatic Change (2011) 109:5–31, DOI 10.1007/s10584-011-0148-z
The next generation of scenarios for climate change research and assessment, Moss et.al. 2010, Nature, doi:10.1038/nature08823
Global warming under old and new scenarios using IPCC climate sensitivity range estimates, Rogelj, Meinshausen and Knutti 2012, Nature Climate Change, DOI: 10.1038/NCLIMATE1385
IPCC Data Distribution Centre on-line documentation of the scenario process, including documentation of narrative development and usage: http://sedac.ipcc-data.org/ddc/ar5_scenario_process/index.html
RCP8.5 specific papers (MESSAGE):
Scenarios of long-term socio-economic and environmental development under climate stabilization. Riahi K, Grübler A, Nakicenovic N (2007) Technol Forecast Soc Chang 74:887–935
RCP-8.5: exploring the consequence of high emission trajectories. Riahi K, Krey V, Rao S, Chirkov V, Fischer G, Kolp P, Kindermann G, Nakicenovic N, Rafai P (2011) Climatic Change. doi: 10.1007/s10584-011-0149-y
RCP 6 specific papers (AIM):
Multigas mitigation analysis on stabilization scenarios using aim global model. Fujino J, Nair R, Kainuma M, Masui T, Matsuoka Y (2006) The Energy Journal Special issue #3:343–354
A emission pathway to stabilize at 6 W/m2 of radiative forcing. Masui T, Matsumoto K, Hijioka Y, Kinoshita T, Nozawa T, Ishiwatari S, Kato E, Shukla PR, Yamagata Y, Kainuma M (2011) Climatic Change. doi: 10.1007/s10584-011-0150-5
Global GHG emission scenarios under GHG concentration stabilization targets. Hijioka Y, Matsuoka Y, Nishimoto H, Masui T, Kainuma M (2008) J Glob Environ Eng 13:97–108
RCP 4.5 specific papers (GCAM):
RCP4.5: a pathway for stabilization of radiative forcing by 2100. Thomson AM, Calvin KV, Smith SJ, Kyle GP, Volke A, Patel P, Delgado-Arias S, Bond-Lamberty B, Wise MA, Clarke LE et al (2011) Climatic Change. doi: 10.1007/s10584-011-0151-4
Scenarios of greenhouse gas emissions and atmospheric concentrations. Clarke LE, Edmonds JA, Jacoby HD, Pitcher H, Reilly JM, Richels R (2007) Sub-report 2.1a of Synthesis and Assessment Product 2.1. Climate Change Science Program and the Subcommittee on Global Change Research, Washington DC
MultiGas forcing stabilization with minicam. Smith SJ, Wigley TML (2006) The Energy Journal Special issue #3:373–392
Implications of limiting CO2 concentrations for land use and energy. Wise M, Calvin K, Thomson A, Clarke L, Bond-Lamberty B, Sands R, Smith SJ, Janetos A, Edmonds J, (2009) Science 324:1183-1186
RCP 2.6 (RCP3-PD) specific papers (IMAGE):
RCP2.6: Exploring the possibility to keep global mean temperature change below 2°C. Van Vuuren DP, Stehfest E, Den Elzen MGJ, Deetman S, Hof A, Isaac M, Klein Goldewijk K, Kram T, Mendoza Beltran A, Oostenrijk R et al (2011a) Climatic Change. doi: 10.1007/s10584-011-0152-3
Long-term multi-gas scenarios to stabilise radiative forcing—exploring costs and benefits within an integrated assessment framework. Van Vuuren DP, Eickhout B, Lucas PL, den Elzen MGJ (2006) Energ J 27:201–233
Stabilizing greenhouse gas concentrations at low levels: an assessment of reduction strategies and costs. Van Vuuren DP, Den Elzen MGJ, Lucas PL, Eickhout B, Strengers BJ, Van Ruijven B, Wonink S, Van Houdt R (2007a) Clim Chang 81:119–159
RCP Development papers:
Evolution of anthropogenic and biomass burning emissions at global and regional scales during the 1980–2010 period. Granier C, Bessagnet B, Bond T, D’Angiola A, van der Gon HG, Frost G, Heil A, Kainuma M, Kaiser J, Kinne S et al (2011) Climatic Change. doi: 10.1007/s10584-011-0154-1. (An assessment of a range of historical emissions data as context for the harmonized emissions used as a common starting point for the future trajectories of the RCPs.)
Global and regional evolution of short-lived radiatively-active gases and aerosols in the Representative Concentration Pathways. Lamarque JF, Page Kyle G, Meinshausen M, Riahi K, Smith S, van Vuuren DP, Conley AJ, Vitt F (2011) Climatic change. doi: 10.1007/s10584-011-0155-0. (Describes how information on air pollutant emissions was used for deriving future concentration and forcing scenarios for aerosols and ozone).
Land use Change and earth system dynamics. Hurtt G, Chini L, Frolking S, Betts R, Edmonds J, Feddema J, Fisher G, Goldewijk KK, Hibbard KA, Houghton R et al (2011) Climatic Change. doi: 10.1007/s10584-011-0153-2. (The paper by Hurtt et al. (2011) is the first to harmonize land-use history data with future scenario data from multiple IAMs to form a single consistent, spatially gridded, set of scenarios on land-use change, to study human impacts on the past, present, and future Earth system).
The RCP greenhouse gas concentrations and their extensions from 1765 to 2300. Meinshausen M, Smith SJ, Calvin K, Daniel JS, Kainuma MLT, Lamarque J-F, Matsumoto K, Montzka SA, Raper S, Riahi K et al (2011b) Climatic Change. doi: 10.1007/s10584-011-0156-z . (Describes how the IAM’s emission projections of long-lived greenhouse gases were harmonized and used for calculating concentration trajectories for these gases, including the Extended Concentration Pathways (ECPs) from 2100 to 2300.
Acknowledgements
The author would like to thank Detlef Van Vuuren and Allison Thomson for their helpful suggestions, and to John Cook for the cover artwork for the PDF version of this guide.
This guide quotes extensively from The representative concentration pathways: an overview, van Vuuren et. al. 2011, a special report first published by Climatic Change, and made available through Springerlink.com as an Open Access document, distributed under the terms of the Creative Commons Attribution Non-commercial License which permits any non-commercial use, distribution, and reproduction in any medium, provided the original author(s) and source are credited.
All other works excerpted or quoted here are copyright their respective authors/publishers.
Copyright
This document is published under the terms of the Creative Commons Attribution 3.0 Unported License, which permits any non-commercial use, distribution, and reproduction in any medium, provided the original author(s) and source are credited.
![]()
Written by Graham Wayne (http://gpwayne.wordpress.com) for Skeptical Science, August 2013. PDF cover artwork by John Cook.


Excellent summary--I was dreading the task of wading through the primary literature to put together a lecture on the RCP's. I assume that something is also included in the upcoming IPCC AR5 assessment report, but that is not yet available.
Note that we now have a 'Guide to RCPs' button in the left hand margin.
In find the belief in CCS by (van Vuuren et.al. 2011) surprising. Especially if you look at Figure 14: RCP2.6 in 2100 burns twice as much coal as has been in 2000. Is it realy realistic that so much coal be burned and yet the CO2 will decline from a peak of about 450ppm in mid century to current 400ppm level? That's contradictory or relying on CCS (technology not yet proven) doing this miracle. That's like the reliance on future generations to perfect that technology to 100% efficiency or to start scrubbing CO2 from the air.
I would rather expect that the renewable mixture (hydro/PV/thermal/wind/etc) to take a large chunk of energy in RCP2.6, basically replacing that big chunk of coal. Said renewables, boosted with gas to balance their intermittent nature, are proven, existing technology. But they actually take the smallest chunk in future energy mixture among all scenarios on Figure 14. How could it be, given RCP2.6 is the most agressive mitigation scenario? Does it mean that the authors "do not believe" in this technology as opposed on their reliance on CCS?
I think that either RCP2.6 on Figure 14 is erroneous, or my knowledge about CCS is incomplete: i.e. CCS is proven to be possible on 100% scale and as cheap as to successfuly outcompete the renewables by 2100. Can someone convince me to the latter?
I tend to agree with chriskoz that the level of CCS envisaged in all but one (RCP8.5) of the pathways seems unrealistically high. Also, the amount of solar/wind/geothermal generation seems very low; this category is the smallest (or nearly so) in all four pathways in Figure 14 above.
This triangular diagram from van Vuuren et al is interesting. In all four pathways, fossil fuels (with or without CCS) make up greater than 50% of energy technologies by 2100, and it is only in the final few decades that the fossil fuel share drops below 62.5% and only in two of the pathways (3PD and 4). Considering that absolute levels of fossil fuel consumption rise in all four cases (Fig 14) and that much of the CCS activity, especially geological storage, will likely be handled by future versions of the big oil companies, the demise of Exxon et al may not be a foregone conclusion.
I know, these are not forecasts, just projections, but it is surprising that none of the pathways models the kind of energy transition (i.e.,renewables-dominant, with little fossil fuel and CCS) that many green-minded people envisage.
Perhaps I am behind the times, but my understanding is that none of the CCS schemes is working. Does anyone have a link to an up to date summary of the status of CCS? If CCS does not yet work, it will be difficult to implement in a timely fashion.
On the other hand, wind and solar continue their amazing drop in cost. Wind is already the cheapest new source of energy and will soon be cheapest even compared to coal plants that are paid for. Solar is economic for home installation in areas with expensive electricity and will soon be economic everywhere. I have started to look at how to install solar at my home in Florida even though Florida has no incentives.
I don't think it is fair to say that CCS is not working, at least at a technical level, the few pilot projects that are running seem to be working OK. The problems with CCS are economic, scalability and regulatory.
The economic problem could be solved with a hefty carbon tax, which is easier said than done, of course.
The scalability problem is much more problematic, since the mass of CO2 that has to be stored is about three times the mass of the fossil fuels that produced it. Establishing a new global industry much bigger than the current oil, gas and coal industries in a matter of decades is not feasible. Note that in all of the RCPs, the absolute amounts of fossil fuels consumed increases by 2100. The scalability problem is not so much a question of the size of the potential reservoirs, but our ability to build the infrastructure to put the CO2 there.
The regulatory problem is a major stumbling block in my opinion. Geological CCS has all of the problems of unconventional gas development and more and, if it is to be a climate-relevant solution, it will have to be implemented in sedimentary basins everywhere. The potential hazards of CCS are real and include leakage, earthquakes, industrialization of the landscape and groundwater contamination. The regulatory and public acceptance problems will make CCS more expensive, slower to implement and more limited in scope.
rustneversleeps and I wrote a long piece on CCS recently that covered some of these points in more detail.
Thank you for this in depth introduction!
I'm having a problem with the Primary energy use graph for RCP2.6.
Your graph seems to match the IPCC report but my old copy of vanVuuren version of RCP2.6 shows significantly more renewable energy; 10-15% of total or about the same as bio-energy. IPCC and yours show only 5% or less of renewables. Was there a change made that I'm missing? Can we really expect to meet RCP2.6 goals with such low use of renewables.
Also, vanVuuren shows a significant amount of Carbon Capture and Storage; greater than 50% of total energy (for coal, oil and bio CCS). I can't find that IPCC emphasizes CCS at all.....although, admittedly, it's a difficult report to navigate through.
There is one thing that seems to be missing from this (otherwise excellent) series. The relationship between CO2 emissions and their atmospheric concentration is known to be fractional (it is, if I recall correctly, currently about 45%) due to the uptake of CO2 by the oceans - acting as a carbon "sink" (and also resulting in ocean acidification). There is also some uncertainty over whether this figure will remain constant over time, but general agreement that it represents an upper bound on the ocean's capability to act as a CO2 sink.
So my question is; do the RCP's assume a constant ocean uptake of CO2 (at ~55%) or do they assume a decrease over time ? Also can we assume the uncertainty associated with GCM tempature projections do not include any contribution from the ocean uptake decreasing over time ?
Thanks