


 Arguments
Software
Resources
Comments
The Consensus Project
Translations
About
Support
Arguments
Software
Resources
Comments
The Consensus Project
Translations
About
Support
![]()
![]()
![]()
![]()
![]()
![]()
![]()
![]()
![]()
![]()


![]()


Latest Posts
- 2026 SkS Weekly Climate Change & Global Warming News Roundup #31
- Skeptical Science New Research for Week #31 2026
- The government canceled this nature study. Scientists finished it anyway.
- Fact brief - Do solar plants require backup from fossil fuels?
- Hot days, cold thermometers
- 2026 SkS Weekly Climate Change & Global Warming News Roundup #30
- Skeptical Science New Research for Week #30 2026
- Canada's boreal wildfires aren't just bad forest management
- Dangerous and historic wildfire smoke pollution event engulfs the U.S. and Canada
- The Strongest El Niño Ever
- 2026 SkS Weekly Climate Change & Global Warming News Roundup #29
- Skeptical Science New Research for Week #29 2026
- Home batteries could become the next must-have household appliance
- Fact brief - Do electric vehicles stop working in extreme heat?
- Deadly heat wave in France shows the future of climate risk
- 2026 SkS Weekly Climate Change & Global Warming News Roundup #28
- Skeptical Science New Research for Week #28 2028
- Six charts show how clean power was world’s largest source of new energy in 2025
- Eastern U.S. broils after heat wave kills over 1,300 in Europe
- How climate change influences extreme weather
- 2026 SkS Weekly Climate Change & Global Warming News Roundup #27
- Skeptical Science New Research for Week #27 2026
- Climate Adam - Is Climate Change Ramping Up El Niño Risks?
- Fact brief - Are injuries from wind turbines common?
- How bad is AI for the environment?
- 2026 SkS Weekly Climate Change & Global Warming News Roundup #26
- Skeptical Science New Research for Week #26 2026
- What Americans can learn from London’s war on cars
- New Publication: Identifying Flawed Reasoning in Contrarian Claims about Climate Change
- The Merchants of Doubt are coming for Extreme Event Attribution science
 The Beginner's Guide to Representative Concentration Pathways
By G. P. Wayne
Welcome to the Beginner's Guide to Representative Concentration Pathways. Arranged in three parts, you can access each part by clicking on the tabs below. Part 1 provides background to the scenarios used by climate scientists. Part 2 describes the development of RCPs, and Part 3 provides a quick reference to many of the key parameters and data (there’s also a further reading list at the end). The guide is also available as a PDF.
| 1: Introduction | 2: Creating New Scenarios | 3: Technical Summary | ||||||||||
Part 3: RCP technical summaryContents (click to navigate)RCP Information, Data Types and Resolutions Emissions and concentrations, forcings and temperature anomalies (table) Energy sources at years 2000 and 2100 Comparisons with SRES equivalents Extended Concentration Pathway Emissions and Forcing
This section contains a summary of the key metrics and assumptions that define the RCP architecture: emissions trajectories and concentrations, energy use, population, air pollutants and land use, and the consequent radiative forcing and temperature anomalies specified by each of the four RCP pathways. The data employed in the development of the RCPs is drawn from the published literature. Each RCP was developed by an Integrated Assessment Modeling (IAM) group, whose published scenario papers were consistent with the base criteria for a particular RCP. Each team then surveyed and created synthesis data sets from available representative studies, which were reviewed repeatedly by different stakeholders. The final agreed set of RCPs was published:
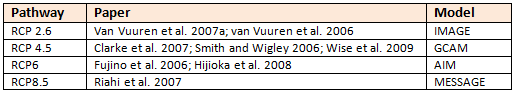
Table 2: RCP-specific publications and model group responsible. For comprehensive discussions of development methodologies and complete technical information on any RCP, please see the further reading section at the end of this guide.
An important note about socio-economic dataThe underlying assumptions about socio-economic trajectories and priorities are not consistent between the RCPs. This quote from van Vuuren 2011 makes clear this point (emphasis added):
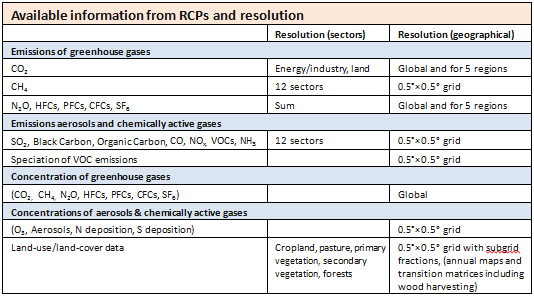
Socio-economic data does not form any part of the RCP database. Please note that in this guide, as in van Vuuren 2011, the primary socio-economic characteristics are discussed here only in the context of the RCP development. RCP Primary CharacteristicsRCP 8.5 was developed using the MESSAGE model and the IIASA Integrated Assessment Framework by the International Institute for Applied Systems Analysis (IIASA), Austria. This RCP is characterized by increasing greenhouse gas emissions over time, representative of scenarios in the literature that lead to high greenhouse gas concentration levels (Riahi et al. 2007). RCP6 was developed by the AIM modeling team at the National Institute for Environmental Studies (NIES) in Japan. It is a stabilization scenario in which total radiative forcing is stabilized shortly after 2100, without overshoot, by the application of a range of technologies and strategies for reducing greenhouse gas emissions (Fujino et al. 2006; Hijioka et al. 2008). RCP 4.5 was developed by the GCAM modeling team at the Pacific Northwest National Laboratory’s Joint Global Change Research Institute (JGCRI) in the United States. It is a stabilization scenario in which total radiative forcing is stabilized shortly after 2100, without overshooting the long-run radiative forcing target level (Clarke et al. 2007; Smith and Wigley 2006; Wise et al. 2009). RCP2.6 was developed by the IMAGE modeling team of the PBL Netherlands Environmental Assessment Agency. The emission pathway is representative of scenarios in the literature that lead to very low greenhouse gas concentration levels. It is a “peak-and-decline” scenario; its radiative forcing level first reaches a value of around 3.1 W/m2 by mid-century, and returns to 2.6 W/m2 by 2100. In order to reach such radiative forcing levels, greenhouse gas emissions (and indirectly emissions of air pollutants) are reduced substantially, over time (Van Vuuren et al. 2007a). (Characteristics quoted from van Vuuren et.al. 2011) RCP Information, Data Types and ResolutionsThe following table shows the data types available for the RCPs, the sectors by which emissions are broken down, and the geographical resolution of the information:
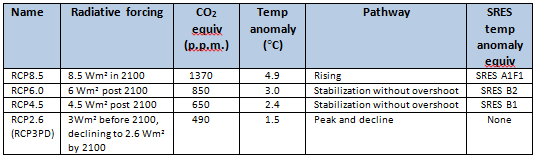
Table 3: from van Vuuren et.al. 2011 Emissions and concentrations, forcings and temperature anomaliesEach Representative Concentration Pathway (RCP) defines a specific emissions trajectory and subsequent radiative forcing (a radiative forcing is a measure of the influence a factor has in altering the balance of incoming and outgoing energy in the Earth-atmosphere system, measured in watts per square metre):
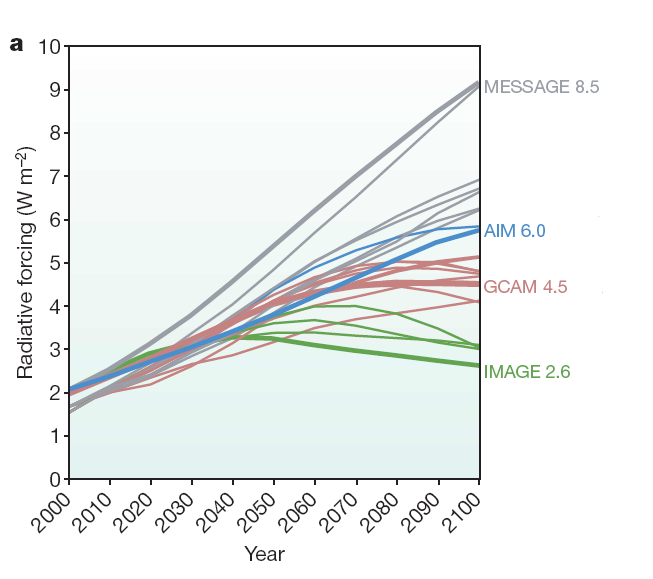
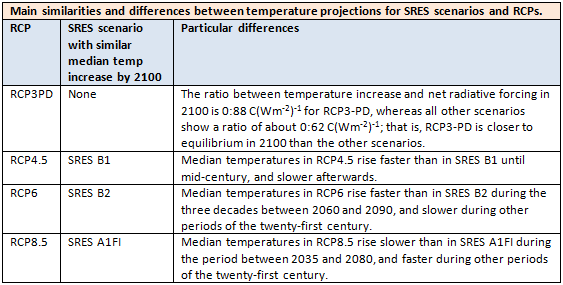
Table 4: from Moss et.al. 2010. Median temperature anomaly over pre-industrial levels and SRES comparisons based on nearest temperature anomaly, from Rogelj et.al. 2012 Radiative ForcingsThe graph below shows radiative forcing trajectories for the four RCPs, the other candidate scenarios that informed the final versions, and the modelling group associated with each.
Figure 7: Changes in radiative forcing relative to pre-industrial conditions. Bold coloured lines show the four RCPs; thin lines show individual scenarios from approximately 30 candidate RCP scenarios that provide information on all key factors affecting radiative forcing… (Moss et.al., 2010) The forcing trajectories are consistent with socio-economic projections unique to each RCP. For example, RCP2.6 (RCP3PD) assumes that through drastic policy intervention, greenhouse gas emissions are reduced almost immediately, leading to a slight reduction on today’s levels by 2100. The worst case scenario - RCP8.5 - assumes more or less unabated emissions. RCP Emission Trajectories
Figure 8: Emissions of main greenhouse gases across the RCPs. Grey area indicates the 98th and 90th percentiles (light/dark grey) of the literature…The dotted lines indicate four of the SRES marker scenarios. Note that the literature values are not harmonized (from van Vuuren et.al. 2011). Click image for larger version
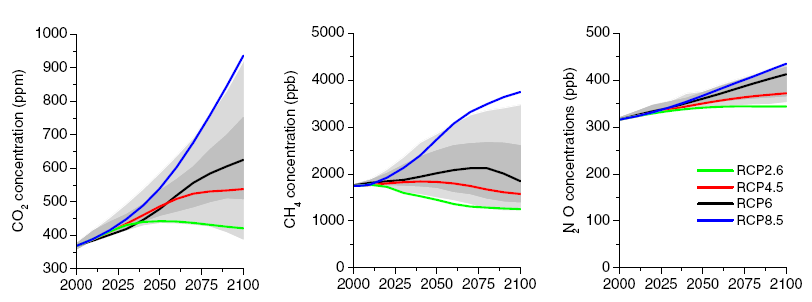
Greenhouse Gas Concentrations
Figure 9: Trends in concentrations of greenhouse gases (van Vuuren 2011). Grey area indicates the 98th and 90th percentiles (light/dark grey) of the recent EMF-22 study (Clarke et al. 2010) Click image for larger version
Atmospheric Air Pollutants
Figure 10: Emissions of SO2 and NOX across the RCPs. Grey area indicates the 90th percentile of the literature (only scenarios included in Van Vuuren et al. 2008b, i.e. 22 scenarios; the scenarios were also harmonized for their starting year—but using a different inventory). Dotted lines indicate SRES scenarios. The different studies use slightly different data for the start year. (van Vuuren et.al. 2011) Click image for larger version
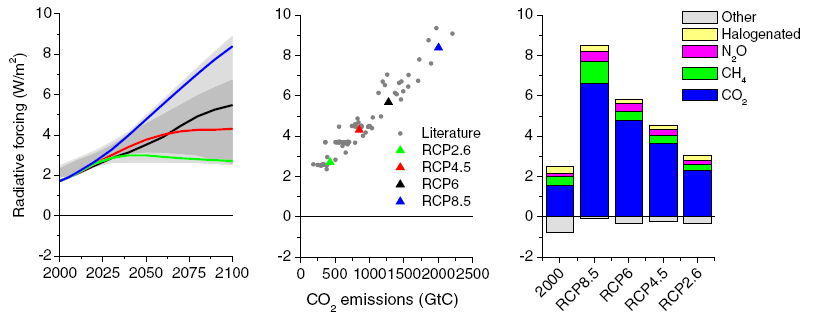
Radiative Forcing Trends
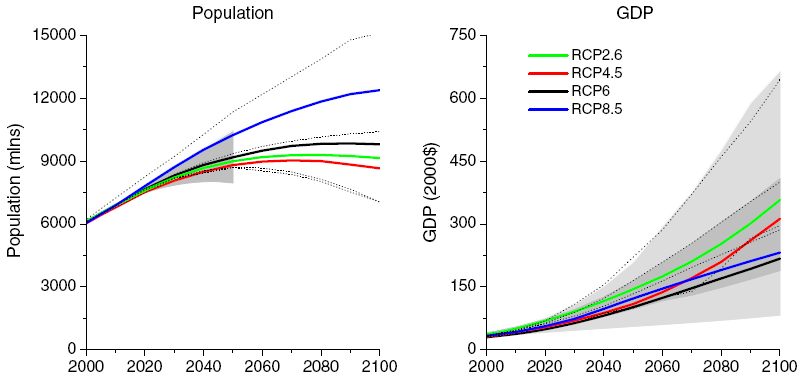
Figure 11: Trends in radiative forcing (left), cumulative 21st centuryCO2 emissions vs 2100 radiative forcing (middle) and 2100 forcing level per category (right). Grey area indicates the 98th and 90th percentiles (light/dark grey) of the literature. The dots in the middle graph also represent a large number of studies. Forcing is relative to pre-industrial values and does not include land use (albedo), dust, or nitrate aerosol forcing (van Vuuren 2011). Click image for larger version Population and GDP
Figure 12: Population and GDP projections of the four scenarios underlying the RCPs (van Vuuren et.al. 2011). Grey area for population indicates the range of the UN scenarios (low and high) (UN 2003). Grey area for income indicates the 98th and 90th percentiles (light/dark grey) of the IPCC AR4 database (Hanaoka et al. 2006). The dotted lines indicate four of the SRES marker scenarios. Click image for larger version
Energy and oil consumption
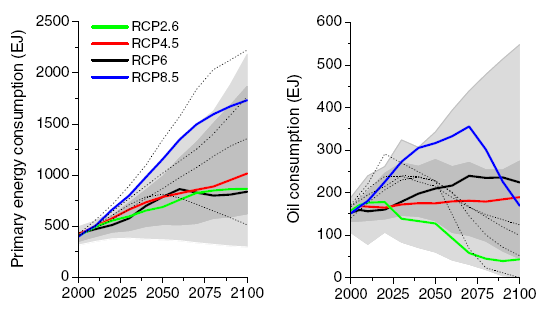
Figure 13: Development of primary energy consumption (direct equivalent) and oil consumption for the different RCPs (van Vuuren et.al. 2011). The grey area indicates the 98th and 90th percentiles (light/dark grey) (AR4 database (Hanaoka et al. 2006) and more recent literature (Clarke et al. 2010; Edenhofer et al. 2010). The dotted lines indicate four of the SRES marker scenarios
Energy sources at years 2000 and 2100
Figure 14: Energy sources by sector (van Vuuren et.al. 2011)
Land Use
Figure 15: Land use (crop land and use of grass land) across the RCPs. Grey area indicates the 90th percentile of scenarios reported in the literature (taken from Smith et al. 2010). Vegetation is defined as the part not covered by cropland or anthropogenically used grassland. (van Vuuren et.al. 2011). Click image for larger version
Comparisons with SRES equivalents
Table 5: From Rogelj et.al. 2012 Extended Concentration Pathway Emissions and Forcing
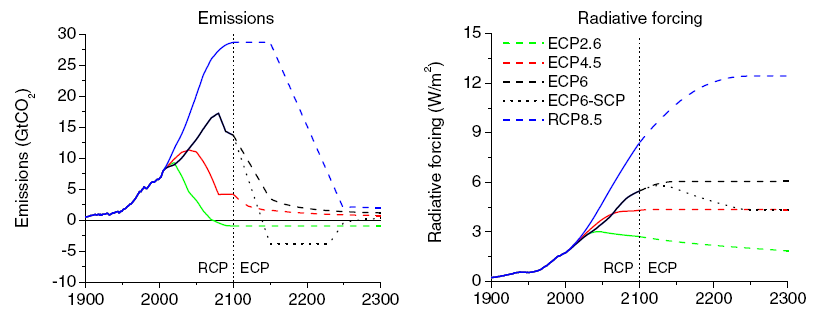
Figure 16: Extension of the RCPs (radiative forcing and associated CO2 emissions) from van Vuuren 2011. (ECP is Extended Concentration Pathway). The SCP6to4.5 (supplementary concentration pathway) shows an alternative extension for RCP6…(Meinshausen et al. 2011b). Click image for larger version Figure 16 shows the CO2 emissions and radiative forcing trajectories for each of the four extensions of the RCPs (ECPs). As explained in the method sections, these have not been based on integrated assessment modeling, but on simple extension rules consistent with the rationale of each of the RCPs to which they connect. This has resulted in a set of extended concentration pathways to be used for climate model runs. Jump to Part 1 Jump to Part 2Click here to download the full RCP Guide as a PDF
Further Reading:Summary PublicationsTowards New Scenarios for Analysis of Emissions, Climate Change, Impacts, and Response Strategies, IPCC Expert Meeting Report, 19–21 September, 2007 The representative concentration pathways: an overview, van Vuuren et. al 2011, Climatic Change (2011) 109:5–31, DOI 10.1007/s10584-011-0148-z The next generation of scenarios for climate change research and assessment, Moss et.al. 2010, Nature, doi:10.1038/nature08823 Global warming under old and new scenarios using IPCC climate sensitivity range estimates, Rogelj, Meinshausen and Knutti 2012, Nature Climate Change, DOI: 10.1038/NCLIMATE1385 IPCC Data Distribution Centre on-line documentation of the scenario process, including documentation of narrative development and usage: http://sedac.ipcc-data.org/ddc/ar5_scenario_process/index.html RCP8.5 specific papers (MESSAGE):Scenarios of long-term socio-economic and environmental development under climate stabilization. Riahi K, Grübler A, Nakicenovic N (2007) Technol Forecast Soc Chang 74:887–935 RCP-8.5: exploring the consequence of high emission trajectories. Riahi K, Krey V, Rao S, Chirkov V, Fischer G, Kolp P, Kindermann G, Nakicenovic N, Rafai P (2011) Climatic Change. doi: 10.1007/s10584-011-0149-y RCP 6 specific papers (AIM):Multigas mitigation analysis on stabilization scenarios using aim global model. Fujino J, Nair R, Kainuma M, Masui T, Matsuoka Y (2006) The Energy Journal Special issue #3:343–354 A emission pathway to stabilize at 6 W/m2 of radiative forcing. Masui T, Matsumoto K, Hijioka Y, Kinoshita T, Nozawa T, Ishiwatari S, Kato E, Shukla PR, Yamagata Y, Kainuma M (2011) Climatic Change. doi: 10.1007/s10584-011-0150-5 Global GHG emission scenarios under GHG concentration stabilization targets. Hijioka Y, Matsuoka Y, Nishimoto H, Masui T, Kainuma M (2008) J Glob Environ Eng 13:97–108 RCP 4.5 specific papers (GCAM):RCP4.5: a pathway for stabilization of radiative forcing by 2100. Thomson AM, Calvin KV, Smith SJ, Kyle GP, Volke A, Patel P, Delgado-Arias S, Bond-Lamberty B, Wise MA, Clarke LE et al (2011) Climatic Change. doi: 10.1007/s10584-011-0151-4 Scenarios of greenhouse gas emissions and atmospheric concentrations. Clarke LE, Edmonds JA, Jacoby HD, Pitcher H, Reilly JM, Richels R (2007) Sub-report 2.1a of Synthesis and Assessment Product 2.1. Climate Change Science Program and the Subcommittee on Global Change Research, Washington DC MultiGas forcing stabilization with minicam. Smith SJ, Wigley TML (2006) The Energy Journal Special issue #3:373–392 Implications of limiting CO2 concentrations for land use and energy. Wise M, Calvin K, Thomson A, Clarke L, Bond-Lamberty B, Sands R, Smith SJ, Janetos A, Edmonds J, (2009) Science 324:1183-1186 RCP 2.6 (RCP3-PD) specific papers (IMAGE):RCP2.6: Exploring the possibility to keep global mean temperature change below 2°C. Van Vuuren DP, Stehfest E, Den Elzen MGJ, Deetman S, Hof A, Isaac M, Klein Goldewijk K, Kram T, Mendoza Beltran A, Oostenrijk R et al (2011a) Climatic Change. doi: 10.1007/s10584-011-0152-3 Long-term multi-gas scenarios to stabilise radiative forcing—exploring costs and benefits within an integrated assessment framework. Van Vuuren DP, Eickhout B, Lucas PL, den Elzen MGJ (2006) Energ J 27:201–233 Stabilizing greenhouse gas concentrations at low levels: an assessment of reduction strategies and costs. Van Vuuren DP, Den Elzen MGJ, Lucas PL, Eickhout B, Strengers BJ, Van Ruijven B, Wonink S, Van Houdt R (2007a) Clim Chang 81:119–159 RCP Development papers:Evolution of anthropogenic and biomass burning emissions at global and regional scales during the 1980–2010 period. Granier C, Bessagnet B, Bond T, D’Angiola A, van der Gon HG, Frost G, Heil A, Kainuma M, Kaiser J, Kinne S et al (2011) Climatic Change. doi: 10.1007/s10584-011-0154-1. (An assessment of a range of historical emissions data as context for the harmonized emissions used as a common starting point for the future trajectories of the RCPs.) Global and regional evolution of short-lived radiatively-active gases and aerosols in the Representative Concentration Pathways. Lamarque JF, Page Kyle G, Meinshausen M, Riahi K, Smith S, van Vuuren DP, Conley AJ, Vitt F (2011) Climatic change. doi: 10.1007/s10584-011-0155-0. (Describes how information on air pollutant emissions was used for deriving future concentration and forcing scenarios for aerosols and ozone). Land use Change and earth system dynamics. Hurtt G, Chini L, Frolking S, Betts R, Edmonds J, Feddema J, Fisher G, Goldewijk KK, Hibbard KA, Houghton R et al (2011) Climatic Change. doi: 10.1007/s10584-011-0153-2. (The paper by Hurtt et al. (2011) is the first to harmonize land-use history data with future scenario data from multiple IAMs to form a single consistent, spatially gridded, set of scenarios on land-use change, to study human impacts on the past, present, and future Earth system). The RCP greenhouse gas concentrations and their extensions from 1765 to 2300. Meinshausen M, Smith SJ, Calvin K, Daniel JS, Kainuma MLT, Lamarque J-F, Matsumoto K, Montzka SA, Raper S, Riahi K et al (2011b) Climatic Change. doi: 10.1007/s10584-011-0156-z . (Describes how the IAM’s emission projections of long-lived greenhouse gases were harmonized and used for calculating concentration trajectories for these gases, including the Extended Concentration Pathways (ECPs) from 2100 to 2300. AcknowledgementsThe author would like to thank Detlef Van Vuuren and Allison Thomson for their helpful suggestions, and to John Cook for the cover artwork for the PDF version of this guide. This guide quotes extensively from The representative concentration pathways: an overview, van Vuuren et. al. 2011, a special report first published by Climatic Change, and made available through Springerlink.com as an Open Access document, distributed under the terms of the Creative Commons Attribution Non-commercial License which permits any non-commercial use, distribution, and reproduction in any medium, provided the original author(s) and source are credited. All other works excerpted or quoted here are copyright their respective authors/publishers. CopyrightThis document is published under the terms of the Creative Commons Attribution 3.0 Unported License, which permits any non-commercial use, distribution, and reproduction in any medium, provided the original author(s) and source are credited. Written by Graham Wayne (http://gpwayne.wordpress.com) for Skeptical Science, August 2013. PDF cover artwork by John Cook.
|
||||||||||||


THE ESCALATOR

(free to republish)