


 Arguments


Recent Comments
Prev 858 859 860 861 862 863 864 865 866 867 868 869 870 871 872 873 Next
Comments 43251 to 43300:
-
chris at 04:22 AM on 28 July 2013A tale told in maps and charts: Texas in the National Climate Assessment
Good point Ray (#2). However one does need to be careful in assessing these very-difficult-to-attribute events especially based on single studies.
For example Rahmstorf, S., and D. Coumou (2011) Increase of extreme events in a
warming world, Proc. Natl. Acad. Sci. U. S. A., 108(44), 17905–17909 concluded that background global warming in Western Russia has increased the probability of extreme warming events by around 5-fold and explicitly contridict the conclusions of the Dole paper you cite in terms of the predictability of the event.Otto et al (2012) Reconciling two approaches to attribution of the 2010 Russian heat wave Geophys. Res. Lett., VOL. 39, L04702,doi:10.1029/2011GL050422, 2012, suggest that the two studies (Dole and Rahmstorf) are not necessarily in contradiction in that "the same event can be both mostly internally-generated in terms of magnitude and mostly externally-driven in terms of occurrence-probability" (easier to quote than to paraphrase!).
In other words global warming increases the probability of extreme warming events (this isn't controversial I think) such that we expect a greater probability of extreme weather (esp warming), even if a detailed local attribution gives the appearance of largely natural inputs.
It's worth noting that even 'though the Dole paper you cite indicates that natural variability doinates local inputs for the Moscow heatwave in their analysis ('though contradicted by the Rahmstorf study), Dole et al do warn that:
"Nevertheless,there is evidence that such warming has contributed too observed heat waves in other regions, and is very likely to produce more frequent and extreme heat waves later this century [Intergovernmental Panel on Climate Change, 2007]. To assess this possibility for the region of western Russia, we have used the same IPCC model simulations to estimate the probability of exceeding various July temperature thresholds over the period 1880–2100 (Figure 4). The results suggest that we may be on the cusp of a period in which the probability of such events increases rapidly, due primarily to the influence of projected increases in greenhouse gas concentrations."
-
Christopher Gyles at 03:50 AM on 28 July 2013A tale told in maps and charts: Texas in the National Climate Assessment
chriskoz, from Wikipedia a CDD seems to be approximately each one degree of external temperature above that which would maintain an internal temperature at a preditermined baseline (commonly 60°F or 65°F) without energy being expended on cooling. Wikipedia explains it in terms of degrees C, but I'm sure Texas' data would be in F°. The current annual average for Houston, according to ClimateZone.com, is 2700 CDD, so it appears that 2800 CDD would be an annual average also. I found some more accurate formulae for calculating degree days at http://www.vesma.com/ddd/ddcalcs.htm
-
Ray at 03:08 AM on 28 July 2013A tale told in maps and charts: Texas in the National Climate Assessment
I wonder if, in time, this heatwave in Texas will be put down primarily to natural variability as was the Russian heatwave in 2010 (Dole et al Geophysical Research Letters 2011) and the hot US summer of 2012 (Dole et al Bulletin of the American Meteorological Society 2013). It is fascinating to see the changes in opinion that the passing of time brings. For example Skeptical Science in 2012 ran this piece by Rob Painting
"An American Heatwave: The United States Glimpses its Hot Future" As indicated by the title the implication was that AGW rather than natural variability could be the causative culprit. That said, it is necessary to note that the 2010 paper by Dole was very fairly critiqued by Rob Painting. It still seems uncertain whether AGW or natural varability is the primary cause of extreme weather events but to discount either at this stage may be premature
-
BillWalker at 02:48 AM on 28 July 2013Scientists can't even predict weather
Editing problem in the Intermediate version.
I can't parse this sentence. Can you?
"Or expressing that in weather terms, you can't predict the exact route a storm will take but the average temperature and precipitation will result the same for the region over a period of time." -
chris at 01:57 AM on 28 July 2013The climate change policy discussion I wish Andrew Neil would have on BBC
Interesting Barry, thanks.
Curiously, Dan Kahan, who is also referred to on the blog thread you refer to considers that the "97% consensus" paper is:
"an elegantly designed and executed empirical assessment".
Like Hulme, Kahan is opinionating. However it is interesting that a study can be described as both "elegantly designed and executed" and "poorly designed and ...executed" by individuals who seem not to like it very much to the point that they're exercised to make public prononcements on it!
Obviously the "97% consensus" paper doesn't "depict... the world into categories of ‘right’ and ‘wrong’" at all, and no doubt Prof Hulme, were he to publish something in a scientific forum on this topic would make a more considered judgement than his blog comment you reproduced.
In fact we would all probably agree that the "97% consensus" paper is a comprehensive assessment of the scientific literature on the scientific consensus relating to the role of anthropogenic greenhouse gas release in the marked global warming of the last ~ 50 years.
Hulme's comments (assuming you've faithfully transcribed these) on the Anderegg PNAS paper, are similarly odd since that paper doesn't "divide.. publishing climate scientists into ‘believers’ and ‘non-believers" either. It divides publishing climate scientists into those that are convinced or unconvinced by scientific evidence on anthropogenic climate change (and assesses the apparent relative scientific expertise of these according to their publishing history).
It's almost as if Prof. Hulme would like to wish away the essential element of scientific evidence from these assessments and portray the deceit that this is all about "beliefs"! Any idea why he would take such an approach Barry?
-
Tom Curtis at 01:50 AM on 28 July 2013Update on BC’s Effective and Popular Carbon Tax
I notice that Russ R. is running through the same routine again. That is the routine in which somebody notices that something might be evidence against a particular view. They therefore conclude that it is evidence against that view without bothering with analyzing the data to find out whether conjecture is correct or not. It is a very efficient form of argument in that it leaves all the hard work of analysis to your opponents.
In this case Russ R has identified a factor which may have called into question price comparison data I have already presented. And yes, I accept his claim that international exhange is calculated only at current rates at pricebuddy. But granted that, depending on the pattern of exchange rates that could refute my claim, strengthen it or have no effect. Russ does not know, or at least shows no analysis to indicate one way or the other. The evident reasoning is that this new data may support my argument, therefore it must support my argument.
As it happens, I dislike people being mislead by my mistakes, so I looked into it. I had to download a digitizing program, convert the graph to monochrome so that the program would read it; digitize the data, find a table of exchange rates, and do the analysis. It took considerably more than twenty minutes and I can see why people would prefer to leach of the intellectual labors of others by presenting possibilities as conclusive evidence.
The data compares prices in terms of US dollars per gallon. Therfore I left US prices unchanged. Canadian prices where first divided by the current exchange rate (ie, the value in US dollars per Canadian dollar) to reconvert to original value Canadian dollars. They were then multiplied by the exchange rate to convert the Canadian dollar price into a (contemporary) US dollar price. If anything thinks I have done that wrong, please let me know.
The result:

The trend of the price differential is clearly downward. There is a large jump about the time of the introduction of the carbon tax, but it rapidly falls back to historical levels, and trends further down. The slight recovery at the end still leaves the price differential lower than in 2005.
-
Michaelf at 01:27 AM on 28 July 2013Murry Salby finds CO2 rise is natural
Thanks. Had not come across it before, read it, thought it was very similar to what Salby was trying to get published but couldn't, so was surprised to see those theories published. Probably because he left the question open about where the CO2 was coming from and did not answer the question of where our CO2 had gone. So before I had that argument I thought I would check over here. Glad I did :-) will go and do some reading.
-
Barry Woods at 01:02 AM on 28 July 2013The climate change policy discussion I wish Andrew Neil would have on BBC
Prof Mike Hulme's comment about the 97% consenus paper and the Ed Dvaey / Andrew Neil interview has caught a few blogs attention. Perhaps it would be best discussed here:
“Ben PIile is spot on. The “97% consensus” article is poorly conceived, poorly designed and poorly executed.
It obscures the complexities of the climate issue and it is a sign of the desperately poor level of public and policy debate in this country that the energy minister should cite it.
It offers a similar depiction of the world into categories of ‘right’ and ‘wrong’ to that adopted in Anderegg et al.’s 2010 equally poor study in PNAS: dividing publishing climate scientists into ‘believers’ and ‘non-believers’.
It seems to me that these people are still living (or wishing to live) in the pre-2009 world of climate change discourse. Haven’t they noticed that public understanding of the climate issue has moved on?” - Mike Hulme
——————————–
from this article at Making Science Public - Nottingham University
http://blogs.nottingham.ac.uk/makingsciencepublic/2013/07/23/whats-behind-the-battle-of-received-wisdoms/As Prof Mike Hulme (founding director of the Tyndall Centre for Climate Change) is not exactly a 'sceptic', the debate and issues raised should be of interest to all that are interested....
-
MA Rodger at 00:55 AM on 28 July 2013The anthropogenic global warming rate: Is it steady for the last 100 years? Part 2.
KK Tung.
I did indicate @194 that I had further concerns stemming from the graph presened @193. With no prompt reply to the first two such concerns expressed @193/197 & @194 apparently forthcoming, perhaps presenting my remaining concerns would be helpful.
These last concerns from the graph @193 stem from the trace labelled SolVolENSO. This trace represents the total of the temperature changes attributed by the MLR to Solar, Volcanic & ENSO forcing and it is derived simply by subtracting the data within T&Zh13 fig5a from HadCRUT4. There are two features that I consider problematical within this SolVolENSO trace. Firstly its amplitude is so tiny. And secondly, along its entire series it is so flat.
Note that these two problems are also present in Zh&T13 fig 1a.(1) In the graph @193, the spread of values in the SolVolENSO trace is visibly smaller than the spread of values in the HadCRUT4 trace labelled "Had oscillations" in that graph (which is HadCRUT4 - 10yearsAverageHadCRUT4). While there may be an explanation for this difference, Zh&T13 does say that it obtains results very close to the 1979-2010 results of Foster & Rahmsdorf 2011. (Zh&T13 does explain that its Fig 1a equivilant to T&Zh13 Fig5a is effectively the FR11 analysis but for 1856-2011). In FR11 the attributed temperatures & HadCRUT4 have very similar amplitude, and thus FR11 is able to attribute the majority of the fluctuations within the HadCRUT3 signal to Solar Volcanic & ENSO effects. It appears Zh&T13/T&Zh13 has failed to do likewise for HadCRUT4.
(2) The data used by T&Zh13 to create Fig 5a are as follows:- Sol = Wang et al 2005, Vol = Sato et al 1993 and ENSO = Cold Tongue Index. (As an aside, it would be interesting to learn how the lack of Cold Tongue data during the 1860s was overcome, given that the alternative MEI.ext was not chosen because it does not go back before 1871.) Given these three inputs, it would appear to me sensible to expect periods with long term trends within the SolVolENSO trace.
As an instance of this, consider the period 1910 to 1930. Solar forcing of course fluctuates with each solar cycle but there is a strong rising inter-cycle trend over solar cycles 14-19 which encompasses this entire 1910-30 period. Volcanic forcings also fluctuate with the individual volcanic eruptions yet these are diminishing over the period 1910-30 and would thus at the very least not counteract the rising Solar trend. CTI (and MEI.ext) also fluctuates but again too is rising significantly over the period 1910-30.
So why is it that when I plot SolVolENSO from T&Zh13 fig 5a, the 1910-30 plot does not feature any significant upward trend? Rather it is very flat, a flatness that extends over the rest of SolVolENSO with onlyshort sub-decadal trends being evident.These two features of the MLR output SolVolENSO, coupled with the wobbles in the residuals (as discussed @193/197) and the problems with the AMO index used (as discussed @194) do, I feel, need some explanation. Otherwise the integrity of this MLR analysis becomes drawn into serious question.
-
Russ R. at 00:31 AM on 28 July 2013Update on BC’s Effective and Popular Carbon Tax
In case you're still in doubt about the gasbuddy.com data, I emailed them to confirm. Here is my email and their response:
-----Original Message-----
From: GasPriceData.com Support
Sent: Friday, July 26, 2013 4:58 PM
To: xxxxx@gmail.com
Subject: RE: GasPriceData.com Feedback - Data Question - RussHello,
Thank you for sending in an email.
Historical prices are given in the currency of the country that the city is
located in. Unfortunately we do not convert the prices to different
currencies in the case of comparing prices between the U.S. and Canada. That
would be done by the individual themselves, rather than us.I hope you find this information helpful.
Regards,
Jess
-----Original Message-----
From: xxxxx@gmail.com [mailto:xxxxx@gmail.com]
Sent: Friday, July 26, 2013 2:27 PM
To: feedback@gaspricedata.com
Subject: GasPriceData.com Feedback - Data Question - RussFor comparing historical gas price data between Canadian and US cities, how is the CAD/USD exchange rate factored in?
Are historical Canadian gas prices translated to USD at the current exchange rate, or at the historical rates?
-
MA Rodger at 00:27 AM on 28 July 2013Levitus et al. Find Global Warming Continues to Heat the Oceans
dvaytw @52.
Oceans acting as the damper on any rising temperatures is not too difficult to establish. So a reference could well be found way back in time. But before 1997? Anything post 1990 will be preceeded by the IPCC FAR. A quick look at the Summary yields.
IPCC WG1 1990 Policymakers' Summary p xxvi
Info box - EQUILIBRIUM AND REALISED CLIMATE CHANGE
"When the radiative forcing on the earth-atmosphere system is changed, for example by increasing greenhouse gas concentrations, the atmosphere will try to respond (by warming) immediately But the atmosphere is closely coupled to the oceans, so in order tor the air to be warmed by the greenhouse effect, the oceans also have to be warmed, because of their thermal capacity this takes decades or centuries This exchange of heat between atmosphere and ocean will act to slow down the temperature rise forced by the gieenhouse effect."
IPCC WG1 Policymakers Summary p.xxix
"Global-mean temperature alone is an inadequate indicator of greenhouse-gas-induced climatic change Identifying the causes of any global-mean temperatuie change requires examination ot other aspects ol the changing climate, particularly its spatial and temproal characterisitcs (and?) the man-made climate change signal." -
andrewii at 23:52 PM on 27 July 2013IPCC is alarmist
Thanks DSL, gws and Glenn Tamblyn!
-
Tom Dayton at 23:47 PM on 27 July 2013Murry Salby finds CO2 rise is natural
Michaelf, a debunking by Masters and Benestad was published in the July issue of the same journal. The article is paywalled, but Masters explained the approach on his blog, and Benestad debunked previous, annoyingly similar "work" by Humlum on RealClimate. Masters discusses their Masters and Benestad critique on his blog, including a discussion by he and Richardson about the complementarity of their critiques.
Moderator Response:[TD] Mark Richardson wrote a whole Skeptical Science post summarizing his comment.
-
Tom Dayton at 23:39 PM on 27 July 2013Murry Salby finds CO2 rise is natural
Michaelf, Mark Richardson debunked Humlum's 2013 article in the latest issue of the same journal.
Moderator Response:[TD] Mark Richardson wrote a whole Skeptical Science post summarizing his comment.
-
Russ R. at 21:33 PM on 27 July 2013Update on BC’s Effective and Popular Carbon Tax
Andy,
I apologize for not having read your previous post.
My rant was not directed at you.
-
Michaelf at 19:18 PM on 27 July 2013Murry Salby finds CO2 rise is natural
Just been pointed to this article that seems to support Salbys work. Do you have a rebuttal for its conclusions?
http://www.sciencedirect.com/science/article/pii/S0921818112001658
Moderator Response:[TD] Just more of the same for Humlum. Search for "Humlum" on this page. Also enter Humlum in the Search field at the top left of this page to find more.
[TD] Sorry, I should caffeinate before typing in the morning. Mark Richardson wrote a Skeptical Science post about this Humlum paper!
-
chriskoz at 18:28 PM on 27 July 2013A tale told in maps and charts: Texas in the National Climate Assessment
I have problem understaqnding the nomenclature of some figures.
Figure 4.3 introduces "Cooling Degree Days" on the scale from 0 to 2800. What does it mean that CDD==2800? Per year is impossible, so maybe per decade or per the entire period shown?
On the other hand, Figure 19.3 shown delta of "Number of Dry Days" on the scale from -8 to +6. Again, what does this measure mean? What was the base of that delta? Per year, per decade or per entire period like in the previous example?
I cannot have a "feeling" as to the magnitude of those changes because the measures is so poorly defined that you don't really know what numbers they show.
Is it only me having problems here ? Maybe someone else who understands the undefrlying research can explain the nukmbers to me...
-
Andy Skuce at 16:31 PM on 27 July 2013Update on BC’s Effective and Popular Carbon Tax
Russ R
i suggest that you read the previous post I made on the subject just a few weeks ago. I addressed points 1 and 2 there, but probably, by the sound of it, not to your satisfaction. Yes there are other gasoline taxes apart from the carbon tax, some of them bigger in the Vancouver area. And yes, the decline in consumption is bigger than expected from what these taxes should produce according to standard models.
You should also read the working paper by Rivers and Schaufele that I linked to that discusses this issue at length. You may be interested to read there that they do not discount entirely the idea that cross-border gas fill-ups may have played a role in the consumption reductions. They wrote:
Two alternative explanations, cross-border shopping and contemporaneous vehicle efficiency policies, could also potentially explain our findings. Both are discussed in turn. We believe that neither is credible and think that there are good reasons to trust that it is the carbon tax that caused the change in consumer behaviour. The first alternative explanation is that the carbon tax coefficient is actually capturing a cross-border shopping effect. Higher prices due to the carbon tax may have encouraged drivers to begin filling their gas tanks in neighbouring jurisdictions. We are unable to dismiss this explanation, yet believe that it is unlikely. Alberta is to the east of BC, while Washington State is to the south. Both jurisdictions have had lower gasoline prices than BC for many years, including a lengthy period prior to the introduction to the carbon tax (refer to Panel B in Figure 1). Further, over 95% of BC’s population would need to drive more than two hours to reach the Alberta border, while crossing into Washington involves an international border. It is doubtful that a sizeable share of residents suddenly began cross-border shopping because of the carbon tax. Nonetheless, this is a potential alternative explanation for our findings.
I understand that a peer-reviewed version of this paper is in the works.
Rather than jump to the conclusion that everyone here is gullible, you perhaps should have considered the possibility that some of us had already thought through some of these issues more thoroghly than you have.
-
dvaytw at 16:15 PM on 27 July 2013Levitus et al. Find Global Warming Continues to Heat the Oceans
Thanks for all the info, guys.
The dude is also trying to say that the ocean heat content is just climatologists making AGW theory unfalsifiable by changing their story after the fact. I recall there was a study quite a while back predicting oceans would take up most of the heat. I know Hansen had something about this as early as 1997, but I remember there was something even earlier. Does anyone know what this was?
-
Russ R. at 11:59 AM on 27 July 2013Update on BC’s Effective and Popular Carbon Tax
(-snip-).
Rather, all of the skepticism has been directed at the small side-effect of leakage that I raised.
(-snip-).
1. You should maybe have been a bit skeptical about a claim that a ~5% carbon tax resulted in a ~19% decline in per capita fuel consumption. That would imply a long-run price elasticity equal to -3.8. That should have immediately raised a few eyebrows, since no econometric analysis has ever observed a sensitivity figure of nearly that magnitude... the median estimate for long-term fuel (gasoline) price elasticity is only around -0.5. (Source: Gasoline demand revisited: an international meta-analysis of elasticities, Molly Espey (1998) Fig. 2) That implies a ~5% increase in price should result in only a ~2.5% decline in consumption, certainly not ~19%. The authors themselves noted the reduction was 7.1x greater than expected, (-snip-).
2. (-snip-) in 2010, Translink (the public transit authority) raised its vehicle fuel levy by 3 cents per litre, and by an additional 2 cents in 2012 on all gasoline and diesel sales in the South Coast region (covering all of Greater Vancouver) . (-snip-). (-snip-).
3. I suggested that some amount of the massive decline should be attributed to people filling up their tanks outside the province... as a) there is a substantial tax gap, and b) the number of cross-border trips have more than doubled during the period. (-snip-). Never mind that Andy Skuce kindly supported my point @16.2, estimating that around 11% of the decline in domestic sales could be due to cross-border day trips by BC residents. I agreed that his estimate was reasonable, and pointed out @18.2, 18.3, 18.4 and 18.5 that there are at least 4 other smaller factors contributing to the decline in domestic sales, and suggested that he might want to consider them if he's going to be doing more detailed analysis. (-snip-). (-snip-).
4. And then the clincher.... Tom Curtis @15 produced a historical gas price chart he pulled from gasbuddy.com showing that the spread between BC and Washington prices hasn't widened, rather it narrowed as much as 20% by his pixel counting method. And just like that, case closed. (-snip-)... except for one detail. The gas price differential didn't really narrow. (-snip-). Tom (-snip-): "When comparing US cities to Canadian cities you have a choice of price units. The standard unit of measure in the US is dollars per gallon and in Canada the standard is cents/liter. Comparison of US and Canadian cities is done using recent currency exchange rates and uses the conversion factor of 1 US gallon being equal to 3.78 liters." Gasbuddy doesn't apply historical exchange rates. (-Snip-) But nobody here stopped to apply a moment of skepticism (or common sense). News reports of people lining up across the border to buy gas, people complaining of the rising tax gap, 400 thousand more trips per mont... but no... ignore all of those people. Tom concludes that LESS people bought gas because he downloaded a chart that he erroneously interpreted as evidence that the price differential had narrowed. (-snip-).
Moderator Response:[DB] Multiple inflammatory tone violations snipped. Please familiarize yourself with this site's Comments Policy and comport future comments to comply with it (link adjacent to the user comment box).
-
Brianc at 11:04 AM on 27 July 2013BC’s revenue-neutral carbon tax experiment, four years on: It’s working
In 2008 1,714,031,000 liters of diesel fuel was sold in B.C. In 2011 2,221,338,000 were sold.
I know this data doesn’t have 2012 but you’d have to have one heck of a drop to get over a forty percent drop in diesel fuel. It makes me wonder what data they are using, or maybe I’m using the wrong data.
http://www.statcan.gc.ca/tables-tableaux/sum-som/l01/cst01/trade37c-eng.htm
-
Andy Skuce at 09:33 AM on 27 July 2013Update on BC’s Effective and Popular Carbon Tax
Tom, KR, Philippe,
I disagree on a couple of points.
One is that I think the data show that BC same-day crossing have gone up faster than elsewhere in Canada. Here's a plot I made. I did running 12 month sums of the monthly data, so the number of cossings is for a yearr centred on a given date.
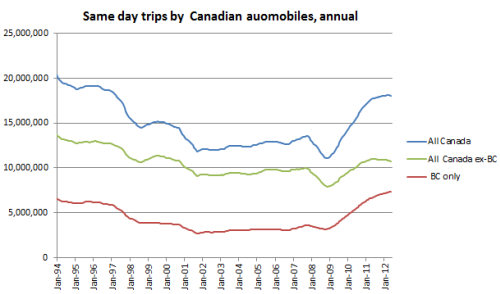
(Forgive the typo in the label.) The BC same-day trips increase from 2008 to 2012 more in absolute terms than the rest of Canada and in population relative terms much more. As I said above, I don't think this was driven significantly by the carbon tax. I would speculate that this is a result of other pressures and due to the fact that a lot bigger proportion of the population in BC live close to the border compared to other provinces and they can more easily respond to economic incentives by shopping in the US.
But, regardless of the motivation for taking the additional trips, more people filling up in the US in 2012 than in 2008 would depress reported fuel sales in BC, other things being equal. The question is by how much. My provisional estimate is that this may account for a small part (about 10%) of the observed decrease reported per-capita consumption relative to the rest of the country. The decrease reported since the introduction of the carbon tax is huge, 18.8%; if the cross-border-corrected number turns out to be 16%, it would still be a very large decline, far bigger than econometric models would predict from a carbon tax of $30/tonne.
-
Philippe Chantreau at 06:24 AM on 27 July 2013Update on BC’s Effective and Popular Carbon Tax
"I'll add that the burn of driving to WA from BC would in general lose more than any advantage"
Let's see, at about 7 cents a liter, the total on a 60 liters tank comes to $4.20, which would buy how much exactly? At $1.45 a liter, that would be less than 3 liters. And how much distance can be covered with that much gas in the kind of vehicle that has a 60 liters tank? 40 km at best in real conditions, perhaps 50 (I think that's overly generous). Therefore, I estimate one would have to be within 18 to 24 km of the nearest station across the border (not the border itself) and avoid long waits to just break even. It would have to quite a bit closer to create a measurable gain and that gain would be so minimal that it becomes problematic to justify the hassle if no other factor is involved in the trip. The cost of mileage for the car (maintenance, tires, oil, etc) should be factored in too.
For anyone in Vancouver with that kind of vehicle, it seems it would be a total no brainer: not worth it. A vehicle with a 40 liters tank capacity and a 30 mpg mileage wouldn't give a much better deal. That's what I can come up with, in 3 minutes by head, based on an outlook from the Washington State side. I doubt that the numbers I'm not aware of (BC gas prices) are so off that they can radically change my conclusion but I'm open to better informed, more accurate calculations.
-
KR at 04:35 AM on 27 July 2013Levitus et al. Find Global Warming Continues to Heat the Oceans
dvaytw - Note that the experimentally measured parameter that I discussed above is the thermal gradient of the ocean skin layer and its changes WRT downward atmospheric IR, averaged over multiple days. The gradient is the result of all acting processes, including IR, ocean turbulence, winds, evaporation and condensation, passing fish, etc - indicating that these other processes (while undoubtedly affecting the gradient to some degree) do not override or overwhelm the IR related changes.
Any increase in evaporation in particular (one of the more common off-the-cuff objections to this information), results in its own increase in GHG absorption and re-radiation near the surface - increasing the IR input to the skin layer, and again acting to reduce the thermal gradient and ocean heat loss.
-
MA Rodger at 04:05 AM on 27 July 2013Levitus et al. Find Global Warming Continues to Heat the Oceans
dvaytw @46.
Courtesy of SkS, some light reading for you or your 'friend'. How Increasing CO2 Heats the Ocean.
-
davidsanger at 03:20 AM on 27 July 2013Why doesn’t the temperature rise at the same rate that CO2 increases?
Timothy @12 and Glenn @14
Thanks for the explanation and references which led me to the Rob Painting posts, extensive comments, and the two Meehl papers (2011 and 2013). Very helpful.
Modeling of the deep ocean currents and vertical mixing does indeed seem to be extraordinarily complicated and and I'm glad to see it's an area of ongoing development -
KR at 02:16 AM on 27 July 2013Update on BC’s Effective and Popular Carbon Tax
Russ R. - What I said, and I thought I was being clear, is that given the lack of (and in fact reduction of from 10 yrs ago) differential in gasoline prices, there is little reason to expect significant gasoline purchasing in WA rather than BC. I'll add that the burn of driving to WA from BC would in general lose more than any advantage.
Additional information over and above the lack of economic gain: less increase in day trips to the US from BC than from Canada overall which by itself invalidates the hypothesis, and changes in exchange rate that seem far more likely to be the variable of interest in cross-border travel.
Do some people drive across the border to fill up? Of course - people do all kinds of things for all kinds of reasons. Is it significant as an economic influence? You have presented no evidence to that point, and the economics and travel data say otherwise.
Keep in mind that the carbon tax applies across the board - heating, electrical, industrial, etc. What percentage of the carbon reduction comes from those other sectors, from improved insulation, compact fluorescent lights, and so on? If you want to make a point regarding carbon leakage, find out if (and if so, show your data) whether the carbon tax has displaced electrical generation across the border. But the relative rate of cross-border trips from BC has not increased (it has decreased) relative to Canada overall during the period of the carbon tax, nor for that matter has Ontarios as far as I can see. There's no evidence for fill-up carbon leakage.
You have (IMO) shifted back and forth from multiple data sources in an attempt to support your hypothesis, but (again, IMO) you have not succeeded in producing evidence.
-
Tom Curtis at 01:57 AM on 27 July 2013Update on BC’s Effective and Popular Carbon Tax
Russ R @22, in your first post here you cited an article based on information from the Canadian Taxpayers Federation suggesting that a surge in British Columbians crossing the border was due to high tax rates on fuel in British Columbia. Being fair, it may be. The CTF cite high taxes in general, and it was you (SFAIK) who attributed that to the Carbon Tax specifically. Regardless, we now know that the surge is almost entirely a function of changes in the exchange rate, and that the price differential on fuel between BC and WA is at least not unusual, and so cannot be the cause of the surge. In fact the cause is (at least mostly) changes in the exchange rate.
It took about twenty minutes to gather together and present the data to determine that. Nor is it a tricky operation. Normalizing the data involved subtracting from each entry the mean of the column, then dividing by the standard deviation of the column. It is the sort of thing any bright twelth year student could do, and quite a few grade ten students as well. I am certain I could talk my youngest daughter (grade 10), who is currently learning how to use the ANOVA function, through the proceedure in no time flat if she had the slightest interest in the procedure.
So the question is, why did not the CTF do it? By not doing it, the simply took two random facts and combined them to make an argument that was clearly not justified by the data they used. Indeed, with full context, the argument was refuted by the data they used. How is that not an unsubstantiated argument? How is the argument not bullshit when it is refuted by the very data presented as establishing it?
What this episode tells me about the CTF is that they prefer propoganda to understanding. I know this because either they did not do the analysis, or they did. In the latter case they knew the argument was not supported by the data, but presented it anyway in what could only be called a deliberate lie. In the former case, the merely found data that could be construed as supporting their argument, and did not bother checking whether it did or not. The truth of the matter was immaterial to them, at least when set against the imperative of getting their message out.
What it tells me about the CTV British Columbia was that it had a massive failure of editorial standards. A type of failure, I might add, which seems like standard practise for most news organizations nowadays - who again appear to have no concern that what they report is true, merely that it gain viewers or readers.
Despite the apparent moral bankruptcy of the CTF and CTV British Columbia, however, I did not make my statement merely on establishing their original unsubstantiated story was false. It was not until I established that the change in relative prices was opposite to that which might be naively supposed that I insisted that anybody mounting the argument without a proper statistical analysis is spreading sunsubtantiated bullshit. The significance is that that unexpected change in price differential undercuts the logic of the argument entirely. So, we are not in a position of ignorance anymore. We have good reason to believe the fundamental premise of the argument is false. But you still think its OK to spread the argument without any sort of analysis to show the argument is, despite the information we have to hand, still valid? Or indeed, that it is OK to set yourself up as knowledgable on this topic by presenting the argument without having first taken the twenty minutes it requires to check your facts?
Frankly, if that is your approach, I don't care for your good opinion.
I do care about truth, and repudiate utterly the idea that it is OK to ride roughshod over it as a means to an end as the CTF and CTV BC have done in this case.
-
Russ R. at 01:37 AM on 27 July 2013Update on BC’s Effective and Popular Carbon Tax
KR,
"I see no justification for claiming carbon taxes have driven the BC population to displace significant gasoline purchases, 'carbon leakage', to Washington state. The price differential doesn't support it, and in my opinion more supporting data is needed before accepting such a claim. "
Let me get this straight... you have no skepticism about a claim that a rougly 7¢ per litre carbon tax is responsible for a huge (18.8%) relative reduction in per capita fuel consumption and are willing to accept it at face value, but you won't accept that some amount of that reduction should be attributed to leakage?
Is that about right?
-
KR at 01:16 AM on 27 July 2013Levitus et al. Find Global Warming Continues to Heat the Oceans
dvaytw - I took a look at your discussion, and have some comments.
- The oceans represent about 93% of the climate thermal mass. Ignore 90+% of the climate at your peril.
- Ocean energy, and temperatures, continue to rise throughout measured depths. That includes waters below 2000m, see Pukey et al 2010 on abyssal temperatures.
- Focusing only on air temperatures and their short term variations (under 25-30 years) is a fools game; you can choose any apparent trend you want out of short term noise. That's one advantage of ocean heat content as a measure - the oceans have tremendous thermal inertia and lower short term variability as a result.
- No matter how you parse Eschenbachs graphs, the oceans are warming at a rate that has been quite stable over the last half century.
- If you look at sufficient air temperature data for statistical significance, or account for even some of the variability to look at shorter terms (Rahmstorf et al 2012), you see that the air is also continuing to warm at a stable rate.
If your friend wants to discuss science, he's welcome to read or engage in topics on SkS, or RealClimate, where points are best backed by published peer-reviewed science and data. Rather than WUWT, where bloggers toss off the random and (a critical point here) contradictory objections of the day, and the wildest unsupportable hypotheses hold sway.
-
Bob Loblaw at 01:07 AM on 27 July 2013Update on BC’s Effective and Popular Carbon Tax
Russ R @ 22:
That's odd. When I read Tom saying that, I thought is represented a very succinct summary.
-
Bob Loblaw at 01:04 AM on 27 July 2013Levitus et al. Find Global Warming Continues to Heat the Oceans
dvaytw:
Nobody "forgets" evaporation. Nobody ignores thermal loss to the atmosphere, either. Everyone looks at the enire energy balance in their models/analysis:
- absorption of solar radiation (can penetrate metres, as pointed out)
- reflection of solar radiation (energy that arrives at the surface, but immediately is lost again)
- absorption of IR radiation (a few mm)
- emission of IR radiation
- evaporation (an energy transfer to the atmosphere, due to the latent heat of evaporation)
- thermal transfer to the atmosphere (driven by turbulent mixing in the atmosphere)
- and finally, thermal transfer ito the ocean (conduction, turbulent mixing, etc.)
None of these exists in isolation. Change one, and all are likely to change in response. Increase the downward IR absorbed at the surface, and the energy has to go somewhere. If the water surface temperature increases, then the likely response is that emitted IR will increase, thermal losses to the atmosphere will increase, and thermal transfer into the ocean will increase as well.
Your "opponent" is suffering from Single Factor Syndrome, where he/she thinks that compartmentalizing your thinking to look at only a small part of the picture means that the rest doesn't matter. The statement "Greenhouse radiation will only increase that evaporation" is just simply wrong. The word "only" is the warning flag: as soon as someone thinks that there is only one factor in climate, they are mostly likely talking through their hat.
-
KR at 00:44 AM on 27 July 2013Levitus et al. Find Global Warming Continues to Heat the Oceans
dvaytw - See How Increasing Carbon Dioxide Heats The Ocean, or the RealClimate Why greenhouse gases heat the ocean posts.
Long story short - IR gets absorbed in the first millimeter or so of water, visible light penetrates a few meters. But that surface layer, with surface tension, is relatively stable (not turbulent), heat from solar warming has to go through the skin layer by relatively inefficient thermal conduction, not mixing or radiation, and the downward IR from the atmosphere reduces the thermal gradient across that last millimeter and hence the ability of the oceans to lose energy. Conduction is a function of thermal conductivity and of gradient; IR decreases the gradient and slows cooling.
Hence the oceans gain energy until the increased temperature of the ocean re-establishes a thermal gradient across that skin layer once again sufficient for the oceans to lose as much energy as they gain from the sun - warmer waters.
I will note that this surface layer effect is experimentally confirmed.
-
dvaytw at 00:10 AM on 27 July 2013Levitus et al. Find Global Warming Continues to Heat the Oceans
KR and MA Rodger thanks for the feedback.
I actually relayed KR's response directly and he said some stuff back. I feel silly copying back and forth, but if anyone's interested, the debate is here:
http://www.forumosa.com/taiwan/viewtopic.php?f=86&t=120785&start=250
He and I get into it about ocean heat content on page 25 (if you want to comment, I think you can do so as a guest poster.)
Most of what he said suggests to me he doesn't really understand what KR said, but I would like to ask about this one thing:
"Of course we all know that the sun's radiation has effect on the oceans, especially on the top layers. To count the energy on the top layers and combine it with the energy rise in the deep ocean, which they hope is caused by greenhouse gases, is deceptive.
The radiation caused by greenhouse gases, on the other hand, is very shallow and only hits the surface, compared to that of the sun, which goes in deeper. What they often forget is that surface water evaporates. Greenhouse radiation will only increase that evaporation, carrying away that precious energy back into the sky."
That bit about deep and shallow penetrating radiation... is there any truth to that?
-
KR at 23:54 PM on 26 July 2013Update on BC’s Effective and Popular Carbon Tax
I believe the gas price differential between BC and WA, or for that matter between Vancouver and Seattle, indicates that there is little if any economic justification for driving across the border merely to fill the tank. 10 years ago (prior to the carbon tax) the Vancouver price was about 2x the US price, currently it's ~1.5x the US price, and has remained between roughly 1.3-1.5x over much of the last six years.
I see no justification for claiming carbon taxes have driven the BC population to displace significant gasoline purchases, 'carbon leakage', to Washington state. The price differential doesn't support it, and in my opinion more supporting data is needed before accepting such a claim.
-
KR at 23:06 PM on 26 July 2013CO2 effect is saturated
As Tom Curtis correctly points out, the LBL codes are quite accurate and are direct computations from the spetroscopy, not complex models, confirmed by satellite meaasures. And the primary uncertainty in direct effects is from varying composition of the atmosphere, not the LBL models.
However - the uncertainties (+/- 5-10%?) in direct forcing are once again smaller than, and subsumed by, uncertainties in climate sensitivity, which is estimated at 2°C to 4.5°C per CO2 doubling. A high estimate in direct CO2 forcing will lower the CS estimate, and vice versa, as they are related by the total effects on the climate.
So: ΔF = 5.35*ln(C/C0) W/m2 is a demonstrably solid estimate for CO2 direct forcing, quite small uncertainties, and incidentally not affected by the computation methods of GCMs. To bring this discussion back to the opening post, CO2 direct forcing is by no means saturated; it has a logarithmic relationship to CO2 concentration. And the total effects on the climate of GHG increases are bounded by climate sensitivity, not the far far smaller uncertainties with line-by-line radiative code.
Can we leave this particular dead horse in peace now?
-
Russ R. at 22:19 PM on 26 July 2013Update on BC’s Effective and Popular Carbon Tax
Tom Curtis,
"I and anybody else following this excercise would be quite justified in dismissing it as unsubstantiated bullshit."
I have to say, I was very impressed with your responses right up until that.
-
Tom Dayton at 21:47 PM on 26 July 2013CO2 effect is saturated
Stealth, in addition to Tom Curtis's excellent reply to you, see Chris Colose's post "Adding Up the Greenhouse Effect: Attributing the Contributions," being sure to click on his links to coverage of that topic by RealClimate among others.
-
Paul Barry at 20:59 PM on 26 July 2013The Consensus Project data visualisation - a history
The consensus project is good work. Just a couple of comments - late to this post.
(1) I'm not sure everyone loves interactive or animated graphics. Many people find animated graphics a little annoying and prefer to see all of the data in a simple static graph or chart. Animated, novel graphics appeal to people who perhaps are unused to examining data and graphs, but others prefer to look at old-fashioned, "professional-looking" static graphs (think of all those analysts who look at economic and financial data) that don't move about. It would be very useful to provide some nice static graphics using other formats too: trend lines, bars etc. which could be reproduced and published elsewhere easily.
(2) Many with a scientific bent (if not necessarily a good understanding of the science) will be more curious about the 3% of the papers expressing an opinion which rejected the consensus - the "outliers".Of the 11944 abstracts analysed in the Cook paper, these amount to 0.3% or 36 papers. 36 might even sound like a significant number of papers to some who may adopt what they believe to be a Popperian approach believing that just one paper is all that is required to "falsify" the consensus!
It would be nice to get more information on these papers. How many people are behind them? Are they they the usual suspects? It could be useful too to compile some data on them answering questions like the following:
(1) How many of these papers had their findings refuted or superceded subsequently by others? (2) What arguments/evidence do they papers put forward to contradict the consensus on climate change (3) To what extent to they deviate from the consensus position.
There being only 36 of them, it should not be too difficult to do this kind of analysis. Perhaps someone already has?
-
Tom Curtis at 18:58 PM on 26 July 2013The Economist Screws Up on the Draft IPCC AR5 Report and Climate Sensitivity
Richard Lawson @24, a dedicated question page would be a nice addition to SkS, and has been suggested before. It, like a number of other good suggestions has been side lined because the time available from volunteers is limited, and a number of other very worthwhile projects have been pursued instead. (The Consensus Project comes to mind.) However, we live in hope, and as I am not in on current planning, one may be coming soon (or not).
-
Richard Lawson at 18:32 PM on 26 July 2013The Economist Screws Up on the Draft IPCC AR5 Report and Climate Sensitivity
Tom Curtis @21. Many thanks again for your response. Yes, the impression I had was from the discussion on CS that is penetrating through to the general news, where the picture is that CS values are being revised downwards by recent work. It was an Economist article that stated that EB models gave lower values than GCM models.
There are a few of us out here, non climatologists who are engaging in the thankless and often depressing task of debating with delayers on blogs and Twitter. We do search sks &c for answers, but there is often no answer to a specific question, which is why it is so useful to be able to put questions here.
It might be useful if sks had a dedicated standing page for us to put questions which arise from the debate.
-
Tom Curtis at 17:49 PM on 26 July 2013Update on BC’s Effective and Popular Carbon Tax
Andy Skuce has drawn my attention to an error in my calculation @14. In fact, in BC 36,000 million vehicle-kilometers were driven, ie, the aggragate of all kilometers by all vehicles 4.5 tonnes and smaller was 36 billion km, not as I had mistakenly interpreted it an average per vehicle of 36,000 km. That means the real average per vehicle was 13, 850 km, or just over 1150 km per month. The net effect is to increase the upper bound of BC fuel purchased from US pumps to 21.6%, if we remember to allow for the additional correction discussed @20.1
This correction has no impact on estimates of carbon leakage, ie, additional fuel purchased outside the taxed area in order to avoid the tax. Because US prices have always been cheaper than BC prices, and because for most of the period of the tax, the price differential has decreased (see @14 {third paragraph} and @20.6 above) there will be effectively no carbon leakage other than a small amount across provincial borders that is severely restricted by population distribution. Nevertheless, it will impact assessments of the tax in another way. Specifically, by reducing the proportion of the BC economy directly effected by the tax, it reduces the effective tax rate by a small (and difficult to calculate) amount. The economic impact would be equivalent to the situation if all fuel were purchased in BC, but the tax rate was X% less, where X depends on the actual proportion of fuel purchased outside British Columbia, and the proportion of fuel expenditure as part of the total economy.
I would like to thank both Andy and Russ for picking up on my errors so that they could be corrected promptly.
-
Tom Curtis at 16:00 PM on 26 July 2013CO2 effect is saturated
Stealth @261:
1) You appear to not understand what models are. They are simply the worked out predictions of scientific hypotheses. In the case of LBL models, they are the worked out predictions of hypotheses that have been repeatedly tested to very greate detail in laboratories along with more or less accurate estimates of atmospheric temperature, humidity and gas concentration profiles. The working out is not mathematically complex, although it is tedious. Nor is it chaotic, so errors in initial conditions will be proportional to errors in the final results. In that context, saying that an LBL model predicts something is no different from saying that the only well confirmed radiation theory predicts that thing. It would be like disputing the planned trajectories of space craft as entirely hypothetical because they were worked out on a computer using only Newton's laws of graviation and the known masses and trajectories. Indeed, more absurd in that Newton's laws of gravitation and motion for more than two bodies and a sufficient time are chaotic.
2) Despite that, satellite observations have been used to directly confirm the accuracy of LBL models. One of the earliest attempts to do so was published in 1970:
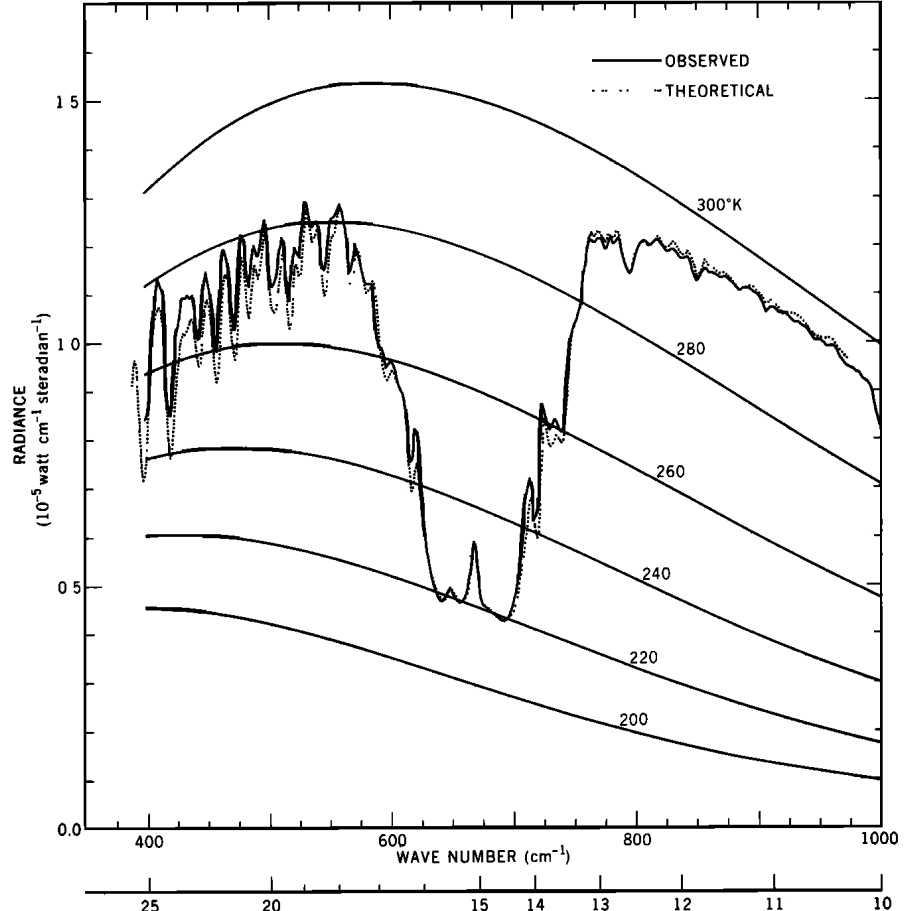
In this case, the data about temperature and humidity profiles was gathered by a radiosonde near simultaneiously with the satellite observation. The accuracy, even back in 1970, was extraordinary.
More recently (2008), a comparison between two LBL models and satellite observations was made. The following is a scatterplot of measured OLR for 134,862 observations between the satellite and the more accurate of the two LBL models:
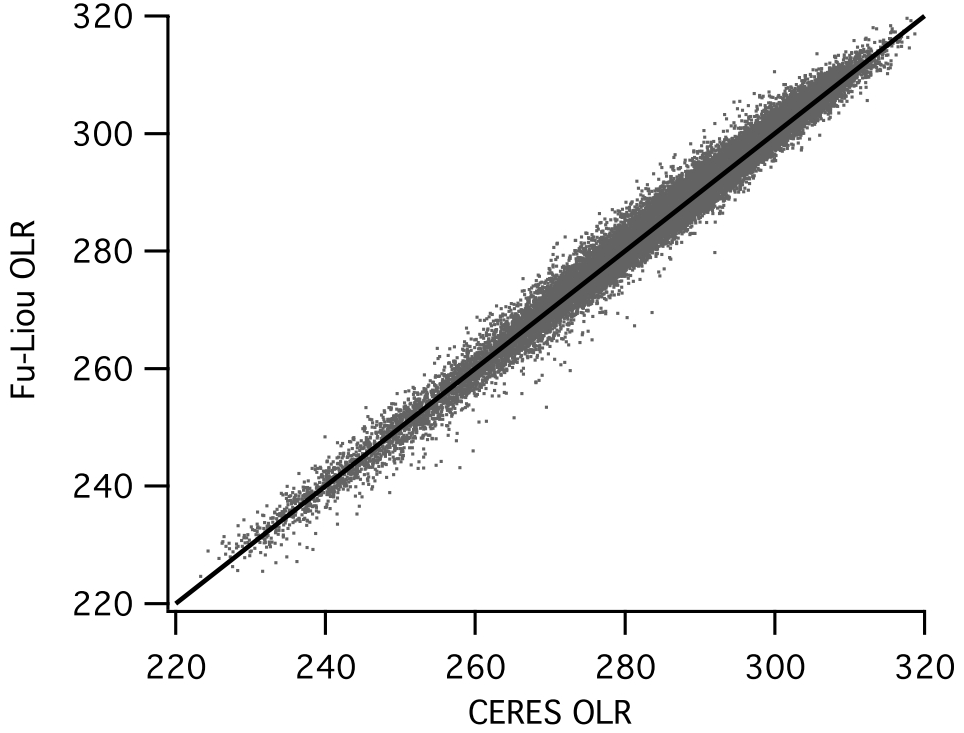
And here is a fuller comparison of both models with the satelite:
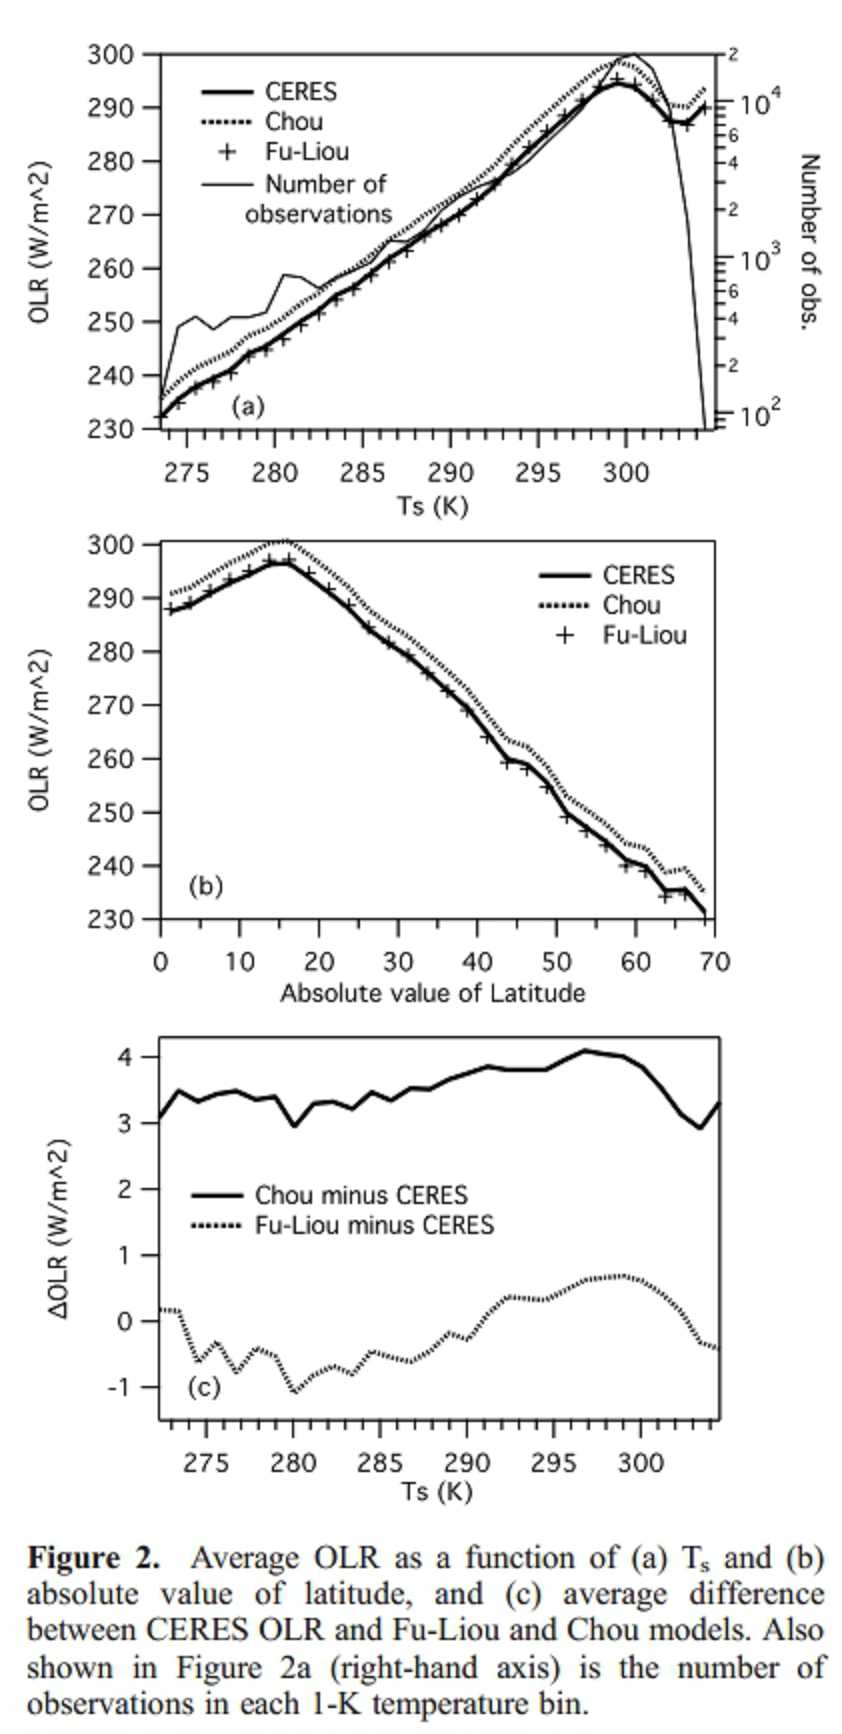
Note that the least accurate of the two models is never less accurate than 1.33% error, while the more accurate is never less accurate than 0.33% error.
Similar comparisons can be found for even broad band models such as Modtran:

Broadband models use the same well understood physics as LBL models, but use simplifying approximations to reduce the number of calculations needed.
It should be very clear from this that uncertainty from radiative models is almost entirely from uncertainty about the specific composition of the atmosphere; and that Myhre et al's model based estimate of 3.7 W/m^2 +/-10% is sufficiently justified by the data.
3) Your suggestion that estimates of the CO2 contribution appears to be based solely on Lindzen's 1991 throw away comment. Certainly the 1990 IPCC (Houghton) estimate of 60-70% water vapour and cloud contribution is reasonably close to the 1997 Khiel and Trenberth estimate of 72-79%, which is yet closer to the Schmidt et al 2010 estimate 75%. That seems like a fairly smooth refinement of a value as methods (and computers) improve, with the initial estimate being by no means unreasonable.
In contrast Lindzen's "estimate" has no basis. He does not even provide sufficient information as to how the estimate was done to know whether he was estimating the current increase in radiative forcing of CO2 as a proportion of the total greenhouse effect (as assumed by Schmidt et al), or whether he estimated the relative contributions to back radiation (as I have previously assumed). In the first case he is, completely without warrant, assuming that H2O and clouds accounted for 100% of the natural greenhouse effect. In the latter case he is showing a fundamental misunderstanding about the nature of the greenhouse effect (which is about the TOA energy balance). In neither case is his estimate a scientific estimate because he has not provided the necessary detail for reproducibility.
What is more, you are showing a throrough inconsistency. You are calling into doubt detailed and accurate estimates because they are "model based", but are prepared to give Lindzen's "estimate" credence when it appears to be based on no more than a back of the envelope calculation. Frankly, all Lindzen's estimate shows is that he stopped doing science and became a simple denier far earlier in his career than I had previously estimated.
-
Tom Curtis at 15:12 PM on 26 July 2013Update on BC’s Effective and Popular Carbon Tax
Russ R @18:
1) I apologize. You are correct. I merely looked for the most recent data without comparing the date to the border crossing data (for which I plead tiredness). Extending the vehicle data back to 2005 (the earliest year with data in html format) to establish a trend, and allowing somewhat crudely for the decreasing trend in new vehicle ownerships, I have recalculated the value for the last 12 month interval as 33%, yielding an approximately 8.3% upperbound on US purchases of BC fuel. Of that some small fraction may be an increase due to the Carbon Tax (but see 6 below).
2) We have indeed neglected provincial border crossings. I have done so based on your contention above that the major population center in BC is very close to Washington State, and ergo relatively distant from provincial borders. Indeed, no major BC city is close to a provincial border, and for the most part they need to cross a mountain range to enter Alberta. I suspect this term can be neglected as well within error of the first term.
3) While we have neglected this term, the usual pattern for people taking a day trip is to fill up before leaving. This must be especially the case when there is a substantial price hike on crossing the border, a pattern that has been the case for at least a decade. Therefore negligible numbers of US citizens entering BC for day trips will started filling up before crossing the border when previously they filled up in BC.
4) As >48 hours requires at least a long weekend, such trips require specific planning and will only occur, for most people a few times a year. Again the impact will be negligible.
5) Again we have ignored this factor, but again the impact will be negligible for similar reasons to those given in (3). IE, the price advantage would already have made this the dominant pattern of behaviour before the carbon tax, and is not likely to have much changed after the carbon tax.
6) This whole discussion todate has been premised on the assumption that the carbon tax made BC fuel more expensive relative to Washington State fuel. I have already alluded to the possibility that this is not the case based on the chart shown @15. In fact, measuring by pixel count at peaks in that chart, I find that there is an approximate 20% fall in the price differential over much of the period post Carbon Tax relative to that prior to the Carbon Tax, although in 2013 prices returned to there former margin. That means prices have moved in the opposite direction to that which you have supposed. Therefore, if anything, over the period of the tax less BC fuel would have come from US pumps than prior to the case, although no doubt for reasons other than the tax. This would have lead to an increase in fuel purchases in BC, rather than a reduction so that we must suppose the Carbon Tax to have been even more effective than we imagined based on naive assumptions.
I would like to confirm this for you with a better statistical method than pixel counting, but gasbuddy charge for the data (and at quite a steep rate). I will note, however, that it is incumbent on people making the argument that changes in cross border fuel purchases have limitted the effectiveness of the carbon tax to provide the relevant data. Given the chart above, and absent an actual statistical analysis of the data, I and anybody else following this excercise would be quite justified in dismissing it as unsubstantiated bullshit.
For what it is worth, there has been a substantial and obvious increase in BC fuel prices relative to Alberta since the introduction of the Carbon Tax, but that is of limited concern given the relative locations of the BC population.
-
Russ R. at 14:19 PM on 26 July 2013Update on BC’s Effective and Popular Carbon Tax
Andy Skuce,
...estimated this way, the increase in cross-border shopping would amount to approximately 11% of the drop in fuel sales in BC.
Your estimate of 11% of the reported drop in fuel sales sounds pretty reasonable for BC drivers going to the US. Please see my notes to Tom Curtis above, as there may be other factors you might wish to include in your calculations.
It is worth noting that cross-border traffic has recently increased in other non-carbon-taxed Canadian provinces also.
It's also worth noting that starting in 2010 Ontario applied a tax on fuel (and a bunch of other things) amounting to 8% (an even bigger increase than the BC carbon tax), so comparing changes in BC to the rest of Canada isn't a perfectly controlled experiment.
I live in Toronto, and I've certainly been doing more frequent trips to Buffalo. I go for more than just gas, but I routinely fill up my gas tank every time, just before I return.
-
Russ R. at 13:50 PM on 26 July 2013Update on BC’s Effective and Popular Carbon Tax
Tom Curtis,
Again, let me compliment your analysis. I only have a few minor points to add:
1. Your calculation of 14.4% of vehicles doing a cross border day-trip was for 2009, the lowest year in the data set. The number of visits has more than doubled since then. That percentage would be substantially higher today (assuming the size of the BC vehicle fleet hasn't also doubled.)
2. Our analysis has only focused on BC residents buying gas in the US (Washington and Alaska). We've neglected British Columbians driving across the provincial borders, and I have no idea how many of those there would be.
3. We've also entirely neglected the flipside of the coin... a decline in BC gasoline bought by visitors to the province, who instead wait until they get back home before filling up where it's cheaper. (StatsCan also has data for US residents visiting BC by car.)
4. We've ignored multi-day trips. These are probably material because Canadian residents have higher duty-free allowances (especially for alcohol and tobacco) if they've been out of the country for at least 48 hours. Looking back at the StatsCan data, the number of multi-day trips has also approximatly doubled (and yes, the exchange rate is most likely the dominant factor) and these people will also be buying gas.
5. We haven't at all accounted for commercial vehicles... truckers are pretty price sensitive when it comes to fuel, as they have greater fuel capacity and range and will likely have more opportunities to fill up outside the province rather than in it.
My point with all of this is, it's impossible to calculate the magnitude of "leakage" and pretty complicated to even estimate it, but it is obviously a factor (as the lineups at gas stations across the border will attest) and the article makes zero mention of it. They simply assume that 100% of the reduction in domestic fuel sales translates into lower consumption and emissions. Remember, if the tax is high enough to encourage people to change their behaviour and consume less fuel, then it's also high enough to encourage people to buy more of their fuel outside of the province. Both result in lower domestic fuel sales, but only the former results in lower emissions.
I'll close by saying that I'm not at all opposed to the carbon tax, but only because it has maintained its revenue-neutrality. I would probably have distributed the tax rebates differently than BC chose to, but I pretty firmly believe it's more economically sensible to tax consumption than to tax income.
-
DSL at 13:25 PM on 26 July 2013CO2 effect is saturated
SASM, is this what you're looking for: http://www.cccma.ec.gc.ca/papers/jli/pdf/puckrin2004.pdf?
-
StealthAircraftSoftwareModeler at 12:58 PM on 26 July 2013CO2 effect is saturated
Moderator [TD] @260: My apologies; I will try harder to stay on topic.
Back to the CO2 forcing equation: ΔF = 5.35*ln(C/C0) W/m2
I have read the Myhre 1998 paper, and it appears that the 5.35 coefficient was derived from a combination of using LBL, BBM, NBM, and HITRAN models.
I have read the Schmidt 2010 paper (http://meteo.lcd.lu/globalwarming/Schmidt/attribution_present_GH_effect_2010.pdf) and it uses the NASA GISS ModelE as an attempt to arrive at CO2 affect at absorbing IR radiation. The paper also references peer reviewed sources for CO2 effects that are all over the map: Houghton 1990 states water vapor is 60% to 70% of the greenhouse effect and CO2 is 25%. Lindzen 1991 states water vapor is 98% and CO is 2%. The effects of clear sky, clouds, water vapor distribution vary enormously. Schmidt also states that many “cloud treatments tended to be quite simple.”
It appears that coefficients for the CO2 forcing function equation have been derived from models -- is this true, or have I misread these papers? Are there any empirical measurements made with any land or space based instruments, and if so, how did they separate out CO2 absorption from IR absorption of other gases?
-
Andy Skuce at 06:33 AM on 26 July 2013Update on BC’s Effective and Popular Carbon Tax
Russ R @7
I also pass through Tsawwassen frequently to catch the ferry to Vancouver Island. Although the Shell station in Point Roberts is only a mile or two out of my way, I have never filled up there, partly because I don`t usually carry my passport with me on trips to Vancouver. I note that the gas price at that station is very high by Washington standards, $4.69 a US gallon, probably because Point Roberts is a pene-exclave of the US (that was a new word for me too!) and it's a 35 minute one-way drive (not counting two border crossings) for Point Roberts drivers to get cheaper gas in Blaine WA. And the gas in Blaine is 50 cents per gallon more than in Seattle.
If my Toyota Yaris was 3/4 empty I could buy maybe 32 litres at Point Roberts and save just over $4 compared to gas prices in Victoria. It's not worth the hassle to cross the border twice for that. But if I lived in Tsawwassen and had a Nexus card, I probably would fill up there from time to time.
-
scaddenp at 06:23 AM on 26 July 20132013 SkS Weekly News Roundup #29B
JvD - cost of production for puposes of supplying energy need is frankly pretty much irrelevant. What matters in terms of consumer choice is price that they are able to buy power.
You are avoiding the main question here. I assume that you do in fact agree that removing price support will result in energy cost of FF fuel go up? And that this will make renewables cheaper? And that higher cost of FF will result in less consumption? If you agree with this, then removing these forms of price support will be an effective means of reducing CO2 emissions.
Prev 858 859 860 861 862 863 864 865 866 867 868 869 870 871 872 873 Next


