


 Arguments


Recent Comments
Prev 886 887 888 889 890 891 892 893 894 895 896 897 898 899 900 901 Next
Comments 44651 to 44700:
-
jdixon1980 at 03:06 AM on 4 June 2013The 5 characteristics of global warming consensus denial
John Hartz @67 - I think the denial rationale based on "strings attached" to funding is a bit more subtle than simply alleging an explicit, quid-pro-quo arrangement like, "we provide funding, you provide evidence and explanations supporting AGW." Their rationale, as I have heard it explained, is that climate scientists live in fear of the entire field becoming obsolete (or at least massively downsized) if they acknowledged the alleged "truth" that there is no AGW, because then there would be no crisis to contend with and money would be better spent elsewhere. Therefore, they have all agreed, either tacitly or explicitly, to falsify, manipulate, and/or explain away data that does not tend to support AGW, on a massive global scale.
This cynical theory is not so easy to refute simply by saying that academic researchers are not paid huge salaries - one might even argue that living on a low income makes you all the more dependent on and defensive of the income you do have, because you are not able to put much away as a safety net. Therefore, I don't believe that it is so easy to refute this type of conspiracy theory in a framework of cold, amoral, economic self-interest.
What makes the theory so implausible to me is precisely its extreme cynicism. I simply cannot believe that 97% of the thousands of researchers in an entire field of science are so profoundly corrupt that they would devote their careers to systematically publishing lies. The economics of academic research science do also tie into my view, in that I think self-selection would tend to remove most people who would so compromise their morals for financial gain from the pool of people who end up in a career that they knew from the start would not be very lucrative.
But that said, I even doubt that 97% of business executives are that corrupt. You will sometimes get this retort from a "skeptic"/denier conspiracy theorist: "How can you assign only noble motives to scientific researchers and only evil motives to corporations and/or their executives?" Thus trying to turn tables and make you look like the conspiracy theorist. But this is a misleading comparison. Even if it is the case that 97% of fossil fuel executives publicly deny AGW (I don't know that in reality the figure is that high), it would not be analagous to what they are accusing scientists of, namely, systematically distorting the truth in their field of expertise. At least oil executives could be excused for misunderstanding the science of AGW because it is not their expertise. What skeptics/deniers are accusing the climate science community of, on the other hand, is far more damning - knowingly and deliberately lying to the public about a subject that they understand better than anyone else, such that there is no higher authority to step in and correct them! It would be more analogous to 97% of oil execs, for example, systematically lying to their shareholders about their reserves/assets, their revenues/costs, their business plans/strategies, their negotiations/projects, their "prospectus," or whatever it is that they understand better than anyone else.
It is very, very hard to reach someone who is cynical enough to believe that sort of thing. Case in point - one of my coworkers is an adamant AGW denier (which, incidentally, is what got me interested in actively researching the topic - before talking to him, I didn't expect to ever encounter an educated person who held such views, and so it kind of woke me up and spurred me to action). After one of the recent mass-murder tragedies, I think it was either Newtown or the Boston Marathon bombing, I overheard him saying to someone in the office that he was surprised that this kind of attack didn't happen more often than it does, given that there is no way to be 100% secure against it. In contemplating these words, I found myself thinking that I am not surprised. Rather, I think that the most obvious explanation is that people who are so mentally disturbed (or what he would probably call "evil") to do something so terrible are few and far between. For the profoundly cynical, however, there often must be some other hidden explanation, if the most obvious explanation is not nefarious enough.
-
dana1981 at 02:25 AM on 4 June 2013Imbers et al. Test Human-Caused Global Warming Detection
Stealth @3 - the solar contribution appears 'stable' because the change in solar forcing is so small compared to the change in GHG forcing. And there is no evidence that solar wind, CME, etc. have a non-negligible impact on global temperatures. That's not an assumption, it's what the scientific literature says.
Kevin @2 is also correct about the baselining being the reason some of the values are negative.
-
StealthAircraftSoftwareModeler at 02:00 AM on 4 June 2013Imbers et al. Test Human-Caused Global Warming Detection
Having gone and looked at the paper itself, I do not get the impression that the 0 point is meaningless. In order to extract the components (ENSO, Volcanoes, AGW, Sun, Other) of the temperature change, they must conclude that the AGW component prior to 1985 was negative in order to get all the numbers to "balance." That doesn't seem right to me.
I guess I can understand that they can pull ENSO and Volcanic effects from the global temperature record based upon physics modeling, but how did they separate out Sun and Other effects from ANT? This shows that the Sun is very stable – perhaps it is in total solar intensity, but the Sun does a bunch of other things that may affect the climate – like solar wind, coronal mass ejections (CME), magnetics fields, to name a couple of major ones. These clearly are not very stable and are highly related to sun spots and the solar cycle. If you assume the sun is stable and other factors are stable, then I suppose you can easily conclude the ANT is a major player. But what if the Sun and Other are not as stable as assumed? Then the ANT contribution would be much lower.
-
Dikran Marsupial at 01:08 AM on 4 June 2013CO2 increase is natural, not human-caused
Falkenherz to add to what MA ROger has already said, if you want a specific mechanism, the transport of carbon dioxide between the atmosphere and surface oceans is proportional to the difference in partial pressure of CO2 between air and ocean. Therefore if we increase the partial pressure of CO2 in the atmosphere (e.g. by burning fossil fuels) then this difference increases, and more CO2 passes from atmosphere to the ocean than in the other direction. This causes the oceans to take up more CO2 until the partial pressures are in equilibrium again.
David Archer has written a very good primer on the carbon cycle, which is well worth a read.
-
MA Rodger at 00:59 AM on 4 June 2013CO2 increase is natural, not human-caused
Falkenherz @2.
If we say there was pre-industrial equilibrium with 280ppm CO2 by volume, NE-NA=0, but the natural carbon cycle is still at work. NE=NA= 770 GtCO2 pa.
Now we are at 400ppm having pumped something like 2,200 GtCO2 into the atmosphere over the previous century or so and seen a little over half of it get absorbed by the oceans and biosphere, if we stopped emitting tomorrow (HE=0), equilibrium will not be achieved for a millenium or so. The eventual level of atmospheric CO2 would be somewhere near 340ppm.
Archer et al 2009 is usually seen as a pretty definitive study on the subject.
-
Kevin C at 00:56 AM on 4 June 2013Imbers et al. Test Human-Caused Global Warming Detection
No, the zero point on that graph is meaningless. They've rebaselined everything so the mean on 1980-2000 is zero - presumably for comparison purposes.
-
StealthAircraftSoftwareModeler at 00:38 AM on 4 June 2013Imbers et al. Test Human-Caused Global Warming Detection
Am I reading Fig 2 correctly? It appears that this chart is saying that the human contribution before 1985 was negative, which implies cooling. That doesn't seem to make sense to me. I thought that most of the warming since 1900 was man made?
-
Dikran Marsupial at 00:36 AM on 4 June 2013The anthropogenic global warming rate: Is it steady for the last 100 years? Part 2.
I am no longer confident that my MATLAB programs actually do repeat the analysis in the JAS paper, at least it is difficult to reconcile the explanation given in Prof. Tung's first SkS post with the description in the paper (although the description in the paper seems rather vague).
It seems to me that the actual regressors used are: ENSO, volcanic, linearly detrended AMO and a linear trend acting as a proxy for anthropogenic forcing. So I shall modify my thought experiment accordingly.
Again, let us perform a simulation of 150 years
T = (1:150)';where again the anthropogenic forcing is quadratic, rather than linear
anthro = 0.00002*(T + T.^2);
and the effect of known natural forcings and variability (other than AMO) is sinusoudal
natural = 0.1*sin(2*pi*T/150);
As before, the observations are a combination of natural and anthropogenic forcings, but does not depend on AMO in any way
observations = anthro + natural + 0.1*randn(size(T));
Instead, AMO is a consequence of temperature change, rather than a cause
AMO = 0.4*anthro + 0.5*natural;
We can use regression to estimate the true linear rate of warming due to anthropogenic forcing
X = [ones(size(T)), T];
[beta,betaint] = regress(anthro, X);which we find to be 0.03 +/- 0.001 degrees K per decade.

Again, we linearly detrend the AMO signal, in order to remove the anthropogenic component.
X = [ones(size(T)), T];
beta = regress(AMO, X);
AMOd = AMO - beta(2)*T;
Next, lets perform the regression exercise:
X = [ones(size(T)) natural-mean(natural) AMOd-mean(AMOd) T-mean(T)];
[beta,beta_ci,residual] = regress(observations, X);
model = X*beta;
The model provides a good fit to the data:

The regression coefficient for AMOd is 2.7685 +/- 1.2491, note that this interval DOES NOT contain the true value, which is zero.
The regression coefficient for the linear trend is 0.0011 +/- 0.0010, which does not contain the 'true' value of the linear trend due to anthropogenic emissions (0.003).
Following the procedure, we add on the residual to the linear component, and compare it with what we know to be the true anthropogenic influence:
deduced_anthro = X(:,4)*beta(4) + residual;we can also calculate the deduced anthropogenic trend
X = [ones(size(T)), T];
[beta,betaint] = regress(deduced_anthro, X);
Note that the residuals have no appreciable trend, so this step does not solve the problem. The deduced anthropogenic trend is less than the true value, and the true value does not lie within the confidence interval.
Now one of the reasons for this failure is that not all of the anthropogenic component of AMO is removed by linear detrending. If we look at the deduced anthropogenic signal (green) we can see that it is rising approximately linearly, rather than quadratically like the true anthropogenic signal (red). The reason for this is simple, the quadratic part of the anthropogenic signal remains in the detrended AMO signal. This means that when we regress the observations on AMOd, AMOd can 'explain' the quadratic part of the anthropogenic forcing on the observations, so it doesn't appear in the residuals.
-
Falkenherz at 00:03 AM on 4 June 2013CO2 increase is natural, not human-caused
Question on the part on "simple accounting":
I assume if we set HE to 0, then NE-NA would result in a deltaC of 0, representing the pre-industrial equilibrum. This puzzles me: Why is nature (oceans, plants, soils) suddenly able to absorb 15 billion tons more CO2 with an atmosphere with ~400ppm, as opposed to the pre-industrial equilibrium with ~200ppm?
-
Falkenherz at 22:39 PM on 3 June 2013Shakun et al. Clarify the CO2-Temperature Lag
Hi! My questions above, from half a year ago, are too muddled and unclear. Just to fully understand the article's "What's going on?":
Complementary to what's going on when an ice age ended: What happened when an ice age was started by the Milankovitch cycle?
-
Tom Dayton at 22:17 PM on 3 June 2013It's CFCs
David Karoly pointed out that the HFC replacements for CFCs have just as much greenhouse effect as CFCs, so the reduction in CFCs that Lu insists has been and will cause cooling, is being offset by HFCs. So Lu's assertion is just plain wrong for that reason, too.
-
Tom Dayton at 22:10 PM on 3 June 2013Hockey stick is broken
There is an awesome new post on RealClimate about tree rings, soundly refuting McIntyre and other critics.
-
kiwipoet at 17:38 PM on 3 June 2013The 5 characteristics of global warming consensus denial
Thanks for these 5 characteristics of global warming consensus denial. I would, tentatively, add a sixth: head-in-the-sandism. A complete refusal to engage. The mind simply shuts down as soon as the words climate change or global warming are uttered. Active denial, of the kind outlined in this post, can be met with evidence. The passive denial I am talking about is blind, deliberately autistic. I suspect that if you prodded a passive denier hard enough he/she would have to revert to one or more of the five characteristics outlined. The willfully complacent head-in-the-sand denier is perhaps the most difficult to deal with as no communication is possilbe.
-
[1and0nly] at 16:42 PM on 3 June 2013It's CFCs
An updated rebuttal of the CFC theory needs to be on the homepage ASAP. Some mainstream media are throwing the ridiculous claims made in Lu's new study around as if they were facts (notably The Australian).
-
jyyh at 14:52 PM on 3 June 2013Video: Lake El'gygytgyn, Pleistocene super-Interglacials and Arctic warmth
And this would be why I think southern Greenland will enter a period of constant melt (through winter) in my remaining life time.
-
Bert from Eltham at 11:25 AM on 3 June 20132013 SkS Weekly Digest #22
The denialists are acting far more strangely than usual. They seem to have a consensus that consensus does not matter! Bert
-
citizenschallenge at 11:12 AM on 3 June 2013The 5 characteristics of global warming consensus denial
Psst,
I decided to share this with those skeptical folks at the so-called SkepticForum:
The 5 characteristics of global warming consensus denial
http://www.skepticforum.com/viewtopic.php?f=40&t=20381&p=337071#p337071
Might turn into a raucous discussion ; - }
-
Andy Skuce at 10:27 AM on 3 June 20132013 SkS News Bulletin #14: Alberta Tar Sands and Keystone XL Pipeline
william: There is a small bitumen sand quarry in the Amazon rainforest in Ecuador that I visited years ago; where, just as you suggested they quarry the sand and use it to surface the local roads. It's not exactly ideal as blacktop, but it is cheap and better than mud.
There is a rather repetitive short video of the Ecuador tarsands that somebody posted.
-
KK Tung at 03:58 AM on 3 June 2013The anthropogenic global warming rate: Is it steady for the last 100 years? Part 2.
In reply to post 116 by Dikran Marsupial: My previous attempt at posting a figure on AR4 projection was not successful. A gentleman at Skeptical Science offered to host my figures for me but needed clear copyright for the figurs. I do not currently have the time to search to ascertain the copyright. May I send it to you privately? Or we can wait for me to have more time.
-
KK Tung at 03:52 AM on 3 June 2013The anthropogenic global warming rate: Is it steady for the last 100 years? Part 2.
Minor correction to my post 120: " confidence level" should be "confidence interval".
The last sentence is confusing and should be deleted. I will explain in more detail on Dumb Scientist's post in a separate post.
-
Chris8616 at 03:46 AM on 3 June 2013Video: Lake El'gygytgyn, Pleistocene super-Interglacials and Arctic warmth
How much resolution does the new sediment record reveal? How fast?
And, if with 320 ppm all the ice melts, 350 doesn't seem legit.
-
Andy Skuce at 02:22 AM on 3 June 2013The 5 characteristics of global warming consensus denial
William Haas: I should make the obvious point that The Consensus Project and the associated discussion is centered around a peer-reviewed article published in a mainstream scientific journal. Even if we adopted your narrow definition of what SkS should cover, TCP would still be be within that scope.
-
DSL at 02:01 AM on 3 June 2013The 5 characteristics of global warming consensus denial
Wrong, William Haas. This site is about the communication of climate science to the general public. That task is essentially political (in the broad sense, not the crude RepDem, LibCon, RightLeft sense). Comments are expected to be supported with evidence, preferably that generated through the scientific process.
-
Tom Dayton at 23:18 PM on 2 June 2013It's CFCs
Eli Rabett has commented on the "new" (i.e., recycled) 2013 Lu paper claiming CFCs are responsible for everything.
-
R. Gates at 22:39 PM on 2 June 2013Video: Lake El'gygytgyn, Pleistocene super-Interglacials and Arctic warmth
chriskoz,
There are many factors which go into the unique nature of each interglacial, with the actual combinations of Milanokovitch forcings being one. The rising CO2 levels, which seem to be a positive feedback to the initial Milanokovitch forcing are a good gauge as to the overall temperature of the interglacial, but there are natural negative feedbacks, such as increased rock weathering and decreased dust in the atmosphere that act to remove CO2 from the atmosphere during interglacials. During the current interglacial, the explosive release of CO2, and other greenhouse gases by humans (a virtual human carbon volcano) has overwhelmed all natural feedbacks. On the current trajectory, certainly 450 or 500 ppm seems assured. Absent any massive geoengineering efforts to reduce CO2 in the atmosphere, certainly a Pliocene-like, and even a Miocene-like climate in the coming centuries in which both Greenland and Antarctica are eventually ice free is likely. This rapid shift in climate would be not unlike the shift we saw during the PETM, with the related massive loss of species, of which we are already seeing.
-
MA Rodger at 20:16 PM on 2 June 2013The anthropogenic global warming rate: Is it steady for the last 100 years?
(The previous graphs illustrating Where's Amo? should now also be visible.)
A selection of US States can also be used to create a temperature profile for a North-South band of the country. This is done here to create 4 more temperature records westward across the US. (Eg (1) Ohio, Kentucky, Tennessee, Alabama. (2) Minnesotat, Iowa, Missouri, Arkansas, Louisiana. (3) Montana, Wyoming, Cloorado, New Mexico. (4) Washington, Oregon, Calafornia.) With one exception, the individual state data in each N-S band again provide similar temperature records (the exception being Montana which experiences a cold spell all of its own in the late 40s-early 50s). (The data all has the same E Coast 'de-trending' trend subtracted from them for sake of the comparison.)
The graph below is rather busy but still gives no indication of AMO affecting US temperatures. The 'saw-tooth' profile of the East coast actually amplifies beyond the Appalachians but disappears by the Rockies where, if you really want it to be there, the profile looks a bit like AMO. But, no, it is gone by the West Coast. So Where's Amo?
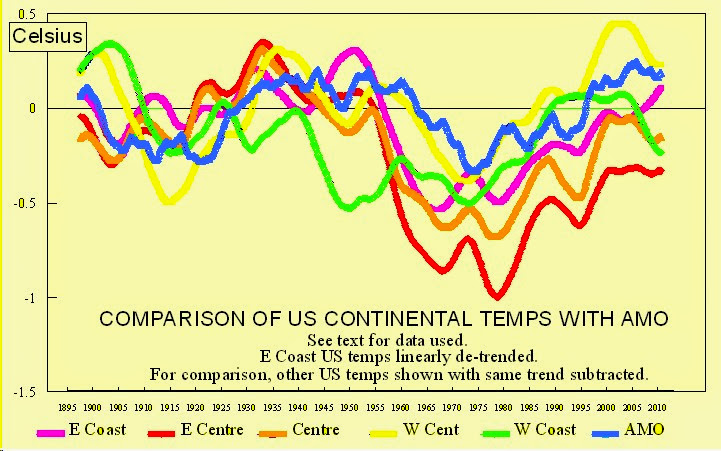
When the US average temperature anomaly is plotted, something a little like AMO starts to appear with a strong amplitude, stronger than AMO. However it still remains different enough not to be AMO, certainly not a temperature profile driven by AMO.
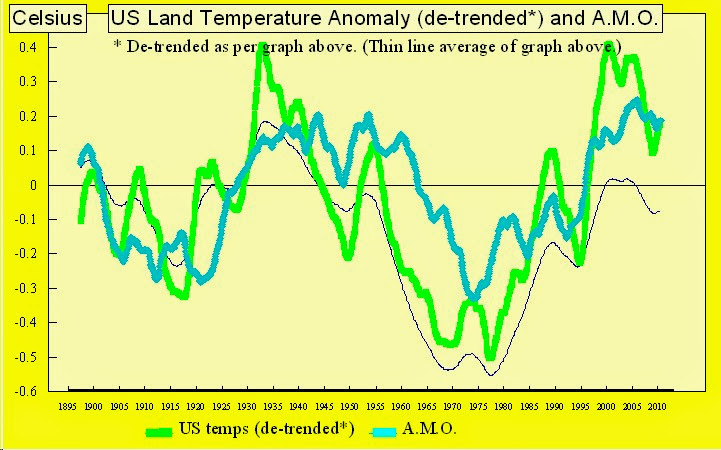
So Where is Amo?
-
Dikran Marsupial at 20:01 PM on 2 June 2013The 5 characteristics of global warming consensus denial
William Haas, the TCP is a survey that tells us where the mainstram scientific position lies on the question of AGW, that is a question about science, not politics. Try reading up on the philosophy of science (e.g. Kuhn), you will find that the emergence of a concensus is essentially what defines a scientific paradigm
-
chriskoz at 19:07 PM on 2 June 2013Video: Lake El'gygytgyn, Pleistocene super-Interglacials and Arctic warmth
Hmm, this stage 11 (420-400ka) ecxeptional warmth in the Arctic (+8 deg according to foraminifera resord) was accompanied by only 300-320ppm CO2. That means Arctic can be emxtremely sensitive. Admitedly, the Milankovic forcings (eccentricity and obliquity) must have been aligned accordingly.
So the question is now, how 400+ ppm today (realisticly 450+ ppm because politicians will not be pressing FF industries to cut emissions more than the agreed maximum target) would affect Arctic, given today's Milankovic alignment? I think 450ppm can easily overpower Milankovic forcings although I don't have numbers to show that. So, essentialy ice-free Greenland is likely in the longer, few-century term?
-
William Haas at 18:58 PM on 2 June 2013The 5 characteristics of global warming consensus denial
This site is suppose to be about science and not politics. Consensus is a political argument and not a scientific one. Accordingly the consensus project should be deleted from this site.
Moderator Response:[JH] You are skating on the thin ice of sloganeering. Please cease and desist.
Also. please read and adhere to the SkS Comments Policy.
Posting comments on SkS is a privelege, not a right.
-
KK Tung at 15:36 PM on 2 June 2013The anthropogenic global warming rate: Is it steady for the last 100 years? Part 2.
In reply to post 115 by Dikran Marsupial:I appreciated your willingness to invest the time to code up the Matlab code and run the case you constructed in your post 57. You continue to focus on the technical issues. I owe you a technical answer. As far as we can tell, there is nothing wrong with your code and the procedure. However, you neglected to report the error bars of the your result. Without that information, you cannot legitimately conclude that the MLR underestimated the true value. This is an area that is your expertise, I believe, and so my explanation below is only for those readers who are not familiar with statistics or uncertainties in parameter estimation: one is comparing two quantities, A and B. A is the true value and B is the estimate of A. Since there is uncertainty in the estimate, B is often given in the form of b+/-c, with b being the central value and c being two standard deviations that defines the 95% confidence level for the estimate B. B is said to contain the true value A with 95% confidence if A lies within the range b-c to b+c.
In my post 114 commenting on your post 57, I mentioned that your artificially constructed case of an AMO that is 40% the same as the anthropogenic response is problematic because you have created a problem of collinearity between the two regressors In your multiple linear regression (MLR). The degree of collinearity matters because its effect shows up in the MLR result in the size of the error bars in the parameter estimates that MLR produces.Since you did not provide them, we have recreated your code and reran it to produce the error bars. Your MLR model is:
Observation=b(1)*one+b(2)*anthro+b(3)*natural+b(4)*AMOd+ noise.The b's are the elements in your vector beta. From one simulation we get b(1)=0.1364+/-0.0154, b(2)=0.6241+/-0.9336, b(3)=0.2155+/-2.1516 and b(4)=1.4451+/-3.3582. Note that these error bars are often larger than their central values. Ignoring b(1), which is the regression coefficient for the constant offset, the other b's are the estimates for anthro, natural and AMO, respectively. The true values for them, 1,1 and 0 are within the error bars of the estimate by MLR. So could should not have concluded that they are different.
Since you used a random noise model in your model, each simulation will be somewhat different from the other and from the one set of values that you reported in post 57. We repeated the simulation 10,000 times with different realizations of noise. We can report that 95% of the time the 95% confidence level includes the true value.In conclusion, the MLR is giving you the correct estimate of the true value of anthropogenic response within the 95% confidence level range. Such a range is large in your case because of the serious collinearity of the model you constructed. In the MLR analysis of the real observation the degree of collinearity is much smaller, hence our error bars are much smaller, and so our MLR analysis gave useful results while your artificially constructed case did not yield useful results.
I will also try to reply to Dumb Scientist's post in a day or two. The problem of collinearity in his case is even more severe.
-
Peeve at 12:46 PM on 2 June 2013Will Tropical Forests Remain Carbon Sinks?
I am assuming that the amount of rainforest in these models are kept constant and the quality of rainforest remains at today's level.
Tuening rainforest to pasture (or non proud soils due to nutrient depletion or production of laterite soils) will reduce the abilitottoman continue as a carbon sink.
-
grindupBaker at 10:41 AM on 2 June 2013Global warming is here to stay, whichever way you look at it
Me@39corrections/clarifications. UK NPL table sea water 3985J/Kg/K so 5.58*10**24J to heat oceans 1C. My ocean heat content 1.61<*10>**27J is hugely incorrect because water is ice at <273K and 3985J/Kg/K will not apply at 0-273K. Re Dr. Trenberth and/or Dr. Randall lectures re land ~6.5m deep at ~50% ocean specific heat capacity - I don't recall whether sea bed is included, probably not, complex because it's not warmed by sun. Geothermal heat flux stated as average entering oceans 0.097 +-0.004 Wm**-2 by M. Hofmann & M. A. Morales Maqueda "Geothermal Heat Flux and its Influence on the Oceanic Abyssal Circulation and Radiocarbon Distribution"
-
Tom Curtis at 08:14 AM on 2 June 2013The 5 characteristics of global warming consensus denial
RomanM @64:
1) "Is this argument based on some sort of technicality?"
You can call it a technicality if you like, but the post above says that:
"Some blogs advanced a related logical fallacy by claiming that this shows 'an increase in uncertainty.'" (My emphasis)
The bolded phrase is a direct quote from Watts' gloss on your blog. In contrast, the word "uncertainty" appears only twice on your blogpost, once in quoting Watts' title in a trackback, and again in quoting Watts in the same trackback. Your blogpost makes a technical point about a (purportedly) superior methods for calculating the trends calculated in Cook et al. Watts puts a gloss on that by presenting a "reason" for the trends. It is the latter that is criticized above, not the former.
Curiously, although you have been invited to comment on Watts "reason", you have not done so - either here, nor at WUWT (although at WUWT you did take the time to misrepresent a PR campaign as a source funding for scientific research).
2) Thankyou for calculating the GLM trends for endorsement and rejection of AGW as a percentage of papers taking a position. For readers who missed them, I think they need highlighting:
"Endorse (from Endorse + Reject): Mean annual change in percentage points over the period of the study = 0.26, p-value = 0.0159
Endorse (from Endorse + No Position): Mean annual change in percentage points over the period of the study = -0.56, p-value = 0.009"I note that the figures are statistically significant.
I further note that:
- If there was an increase in uncertainty about AGW, there would be an increase of rejection papers relative to endorsement papers. Therefore these statistics clearly falsify Watts explanation of the trends you calculated in your blogpost.
- If the increase in endorsement papers relative to rejection papers were due to scientists chasing funding, then there would be an increase in endorsement papers relative to neutral papers as well. (Afterall, if your funding is premised on your getting the "right results", there is no point in leaving people in doubt as to whether or not you got the "right result".) Ergo the total figures refute your explanation as well.
Further, despite your claim that the figures are not robust, the 97% figure (or close to it) turns up in study after study of this sort. The claim of a lack of robustness is hardly credible. What is more, the mere fact that noposition percentage can be boosted or reduced by variations in publications in non-related fields, or by the simple increase in papers that take AGW as read, shows that it is the percentage of endorsement or rejection papers among papers taking a position that is germane. Your argument to the contrary is simply not credible.
3) I did not ask you to discuss your particular theory, but the theory advanced in the post above, and that advanced by Watts. I find it odd that despite the fact that you appear to disagree with Watts when he claims the trends in the data are explained by increased uncertainty, you have now twice declined to state your disagreement publicly when asked to do so. Further, you posted on Watts thread without feeling it necessary to correct his error. I have noted the reticence in "climate auditors" to correct even the most outragious errors by Watts and his ilk before.
4) Given the fact that you cannot defend your position in detail on this site, I will not pursue this matter beyond rebutting the specific argument you did make. I note, however, that others have responded more than adequately IMO.
Turning to the specific point you made, the time frame of the funding exceeds that of a typical funding grant and the time taken to publish papers. That being the case, if the funding had started up in 1998, we would expect a ramp up of papers over five years, followed by a plateau. Instead we see an accelerating rise in the number of climate change papers.
Further, you claim in defence of your argument that, "Add in new sources at various intervals and the rate goes up dramatically." Your only evidence of these "new sources" being added in, however, is the increase in papers which makes your conjecture entirely circular. Without that conjecture, the evidence shows that researching global warming shows that more and more researchers are trying to divide up a constant pie; making climate related research a field researchers guided by money would avoid.
Finally, your claim is not that increased funding explains the increase in research; but that the (assumed) increased funding explains the increasing proportion of endorsement papers. That is only an explanation if the funding is premised on certain results, or the researchers are shaping their results to gain funding. Both charges are clearly libellous. As your intention in making the charge is clearly to denigrate climate scientists, you should not pretend otherwise. The pretence is cowardice, pure and simple.
-
ralbin at 08:11 AM on 2 June 20132013 SkS Weekly News Roundup #22B
Parker is a very fine scholar and an acknowledged expert on 17th century Europe. For those who don't want to read the whole book, a good summary was published by Parker as a long article in the prestigious American Historical Review a couple of years ago. This book is essentially a followup to a longstanding historical discussion of the "17th century crisis," which followed the realization some decades ago of parallelisms between social, political, and demographic crises in Europe and China. Parker ably summarizes a large volume of historical research on this topic and links it to the nadir of the Little Ice Age. This is a theme that other scholars have discussed but he makes an effort to produce a truly global analysis. As a demonstration of climate fluctuation impacts on a pretty well documented period of human history, this is a very good book and a really sobering reminder that changes of smaller magnitude than predicted for the next century under business as usual scenarios can have a profound impact.
-
KR at 07:07 AM on 2 June 2013The 5 characteristics of global warming consensus denial
While the Union of Concerned Scientists and the Government Accountability Project are advocacy organizations (i.e., like all advocacy groups, consider sources and data carefully), their 2007 report on political pressure regarding climate science is very interesting.
They conducted in depth interviews and document examinations (GAP) and surveyed federal climate scientists (UCS, 1,600 queried, 279 replies), arriving at similar conclusions:

Asked to quantify the number of incidents of interference of all types, 150 scientists (58 percent) said they had personally experienced one or more such incidents within the past five years, for a total of at least 435 incidents of political interference.
This interference increased with direct involvement in climate science, with more than 3/4 of active climate researchers reporting incidents, 1/4 of those having 6+ incidents over the last five years.
There were also complaints about inadequate funding, poor morale, and blocking of press releases that "..highlight research into the causes and consequences of global warming."
---
RomanM's assertions about a pro-AGW research bias don't seem to hold in the US.
-
grindupBaker at 06:23 AM on 2 June 2013Global warming is here to stay, whichever way you look at it
noelfuller @5 "anyone actually genearted a graph of global heat content" if you mean "global heat content anomaly" then 97.5% yes. NOAA "has" a graph of 97.5% global heat content anomaly (I've seen Dr. Trenberth present it also) and it's called the ocean heat content anomaly. The other 2.325% is the ecosystem fresh water (air=0.09%, land to 6.5m deep=0.085%). I've no spare time to search internet for most ecosystem fresh water mass & any information on its heat increase. If you Googlify "great lakes global warming" that's a start. "the LLO study found that summer surface water temperatures on Lake Superior have increased approximately 4.5°F (2.5°C) during the period 1979–2006". It'll need some time from you and others to find >80% of the fresh water mass & temperature anomaly data for a high enough quality assessment. I assume you'll accept 99.5% of global heat content as "all" global heat content (assuming you actually mean the anomaly) given that the final 0.5% of global heat content is only ~42 months of present 0.85wm**-2 warming if final balanced AST is +2.0C (7 yrs if it's +4.0C and so on). Either add your fresh water heat gains to NOAA graph if you can find >=80% of the fresh water data or, if time-stressed like me, simply divide NOAA global heat content graph by 0.975 and you've got global heat content within +/-~1%.
With paper scrap & calculator I have oceans weigh 1.40*10**21 kg so to heat 1K takes 5.82*10**24J and temperature is 277K so heat content is 1.61**27J. Some Wiki entry says oceans weigh 40 times as much as all fresh water so global heat content is 1.65**27J give or take a few trillion nuclear bombs worth. The preceding guesstimate is if you actually do mean the current ecosystem heat content. I expect that's why climate scientists use "anomaly" and only deal with the changes.
-
michael sweet at 06:04 AM on 2 June 2013The 5 characteristics of global warming consensus denial
The hypothesis that climate research funds have pro-AGW strings attached includes the premise that during the George Bush administration there were pro-AGW strings attached to funding. James Hansen widely documented that the Bush administration attempted to gag climate scientists who had pro-AGW information. This directly contradicts and falsifies the hypothesis that funding is based on supporting the science of AGW.
At one time I saw a post online asking skeptical scientists to document funding problems they had due to being skeptical of AGW. The only case of funding being cut was documented by James Hansen who had funding cut because he was pro AGW. Can RomanM document cases of skeptics losing funding because of their climate position, or is he just making this up? It is easy to slander climate scientists with baseless claims of bias.
In reality, scientists like Lindzen and Spencer have trouble obtaining funding because they have a long history of being wrong and their proposals have no merit. Who would you want to be a graduate student for: a scientist like Hansen who has a long history of making important discoveries or a scienitst like Lindzen who has a long history of being wrong? Who would you give a grant to? I would work for and fund Hansen, since he has used his past grants wisely and has interesting new proposals. We see that Lindzen has no grad students and few scientists want to work with him. This is because his ideas have no merit to informed graduate students and scientists.
-
william5331 at 06:00 AM on 2 June 20132013 SkS News Bulletin #14: Alberta Tar Sands and Keystone XL Pipeline
Perhaps they should stop refining tar sands, ship them to roading companies, add a little gravel heat it up and pave roads with the stuff. Long term sequestration and a useful purpose for tar sands. I wonder what the relative economics would look like.
-
gws at 05:56 AM on 2 June 2013Skeptical Science Study Finds 97% Consensus on Human-Caused Global Warming in the Peer-Reviewed Literature
Is there a list somewhere of the papers that ended up in the 3% category?
-
grindupBaker at 05:36 AM on 2 June 2013Global warming is here to stay, whichever way you look at it
Nick Palmer #37 I have quibbles (not disagreement). "at least temporarily" I see no logical reason for it to be "temporarily" but understand it takes a full book to define what "temporarily" means for this. Tiny puffs of heat go in and out, they only seem large to us because air=0.09%, land to 6.5m deep=0.085% of ecosystem heat. My logical reasoning with no education on topic is if AST must rise, as example, +2.8C to balance radiation then ocean must rise +2.8C. Does anyone know a reason why it would significantly differ ? That's long-term, decades, centuries...millenia on a "diminishing returns" curve where it takes up last smidgin of heat at a decelerating rate after centuries (thus, mine is hypothetical/approximate because the TOA balance is unlikely to be entirely steady this long). Meantime, ocean will occasionally accelerate a previously-slowed "global warming" (due to AST getting close to the balance point) by taking some heat down, reducing AST and thus increasing radiative imbalance. "temporarily" as I infer you mean it is that some increased puffs of ocean outbound heat might well happen over the coming decades, the ocean being fluid and with increasing energy content, which seems logical. Long-term it all goes into the oceans (ummm, and freshwater 2.5%).
In "From that perspective, the pathological sceptics are right that the pause was not really predicted" suggest you might add "in short-term AST increase" after "pause" because "global warming" has not paused. You initiated surface temperature trends as the topic in the prior paragraph but I think the repetition is important, not pedantic, because most of the audience has limited knowledge (a euphemism) and a significant minority is a teeny tad mischievious regarding the "quotes" of others.
-
John Hartz at 03:46 AM on 2 June 2013The 5 characteristics of global warming consensus denial
RomanM's postulates that increased funding for climate science research will distort the objectivity of the scientists receiving the funds.
The implicit assumption embedded in this argument is the false belief that there are pro-AGW strings attached to the funding.
I challengte RomanM and his denier brethren to provide hard evidence that such strings exist. If they cannot, their belief is nothing more than another imaginary conspiracy theory.
-
KR at 03:38 AM on 2 June 2013The 5 characteristics of global warming consensus denial
RomanM and others - Refreshing a page on this site will resubmit a comment; a known limitation/bug on this site. It's certainly happened to me on occasion.
If I correctly recall previous mentions of this issue, it's a known bug that just hasn't reached the top of the webmaster list yet...
-
RomanM at 03:27 AM on 2 June 2013The 5 characteristics of global warming consensus denial
I refreshed the page to check for further comments and somehow, my comment seems to have reappeared in its original format.
I do not intend to post here again.
Moderator Response:[Dikran Marsupial] As KR says, it is a known bug feature of the site, I've deleted the duplicate.
-
RomanM at 02:26 AM on 2 June 2013The 5 characteristics of global warming consensus denial
@Tom Curtis #53
[moderation complaint snipped] However, I will first address the points in your comment.
1) The blog post referenced in the article above was not yours, but that by Anthony Watts...
Is this argument based on some sort of technicality? The WUWT post paraphrased the title of my CA post, showed a graph created by me from that post and provided a link to my post, and it has nothing to do with my work? Possibly the fact that my name was misspelled caused some confusion.
"The number of papers endorsing AGW is falling, while the number of papers with no position is increasing. Looks like an increase in uncertainty to me."
That sentiment was not attributed to you, and is unwarrented by your results. Ergo the article above does not criticize (or even take notice of) your blogpost.Do you wish to endorse Watts' understanding of the implications of your blogpost?
It may have mischaracterized my position slightly. Replace the word "number" by the word "percentage". The glm procedure applied to these two groups gives the results:
Endorse: Mean annual change in percentage points over the period of the study = -0.44, p-value = 0.0402
No Position: Mean annual change in percentage points over the period of the study = 0.60, p-value = 0.0041Both of these were characterized in the paper as showing no demonstrable trend.
2) Your blogpost seems very incomplete to me. Although it carefully analyzes the trends in papers for reject, endorse, and noposition, it does not analyze the relative trend of endorse to reject. By my calculation, a simple linear regression shows that endorsements are increasing at a rate of 0.34% a year as a percentage of papers that take a position (ie, papers excluding noposition papers) from an already high base (91.7% average over the first five years). I would be very interested to see your GLM trend and statistical significance for that statistic. I am also curious as to why you did not caclulate it in your original post, given that it is the most germaine statistic given your thesis and the headline result of Cook et al.
I didn't bother calculating them because the "germane" 97% statistic is ill-conceived. If you have 97 people in the Endorse group, 3 people in the Reject group and 0 in the No Position group, you get a 97% "Consensus". If you have 97 people in the Endorse group, 3 people in the Reject group and 1000000 in the No Position group, you still get a 97% "Consensus".This statistic would not be particularly robust by either statistical or common sense standards and could produce radically different results for just slightly different data sets.
However as a favour to you (and the authors), I have calculated what you have requested and one more for "completeness"
Endorse (from Endorse + Reject): Mean annual change in percentage points over the period of the study = 0.26, p-value = 0.0159
Endorse (from Endorse + No Position): Mean annual change in percentage points over the period of the study = -0.56, p-value = 0.0093) As an aside, it is clear that the increasing percentage of endorsement papers as a percentage of papers with a position completely refutes Watts' hypothesis as to why the percentage of neutral papers is increasing. Indeed, that fact shows that John Cook and Dana were entirely justified to claim above that:
"However, if uncertainty over the cause of global warming were increasing, we would expect to see the percentage of papers rejecting or minimizing human-caused global warming increasing. On the contrary, rejection studies are becoming less common as well. That scientists feel the issue is settled science actually suggests there is more certainty about the causes of global warming."
Do you disagree?
I have given what I consider to be a very plausible reason for why the percentage of "rejection" studies would well go down under increasing research funding , but it is apparently "off-topic ideology."
4) Your cited source on funding shows a near constant level of funding over the years 1998 -2009, a period over which self rated papers increased nine-fold. If your theory that it is desire for funding that drives climate science had any merit, a slowly increasing level of funding would be expected to be matched by a slowly increasing level of research. As a result, it appears to me that in addition to being libellous, your theory has no merit. The best that can be said for it is that it is a terribly convenient theory for people who find themselves rejecting the scientific consensus for ideological reasons.
Your argument is clearly wrong. Ask yourself how many of these approximately 12000 papers did NOT have any research funding. If as you say, the number of papers increased nine-fold during this period where did the nine times as much funding come from? Your argument that slowly increasing the funding will slowly increase the numbers is also wrong. Grants are often multiyear and various delays in writing and publication push some the papers into later time periods. Furthermore, I only referenced a single source of funding. Add in new sources at various intervals and the rate goes up dramatically.
From ny own personal experiences in academia, funding is extremely important to researchers. If the money becomes available, people willl apply for that money and papers will be written - some good, some not so good. How you get the idea that indicating the importance of acquiring research funding is "libellous" I can only wonder...
Moderator Response:[Dikran Marsupial] Moderation complaint snipped. Moderation complaints are by definition off-topic. Normally posts containing moderation complaints are simply deleted as off-topic. On this occasion I have edited the post instead, however this is an unnecessary burden on the moderators, and next time the moderator is unlikely to be so lenient. Please familiarise yourself with the comments policy.
-
John Hartz at 01:20 AM on 2 June 20132013 SkS Weekly News Roundup #22B
The author of the article, The Inevitable Climate Change catastrophe is Geoffrey Parker, a professor of history at Ohio State University. He is the author, most recently, of Global Crisis: War, Climate Change and Catastrophe in the Seventeenth Century (Yale University Press, 2013). His article appears to be a very brief summary of his book. More to the point, Parker is a historian, not a climate scientist.
-
Composer99 at 00:16 AM on 2 June 20132013 SkS Weekly News Roundup #22B
On the other hand, the article has this well-phrased (one might say Sphinxesque, if one were a fan of Mystery Men) gem:
In short, we can pay to prepare now or we can prepare to pay much more later.
-
Composer99 at 23:42 PM on 1 June 20132013 SkS Weekly News Roundup #22B
I'm under the impression that most megafauna were killed by humans: they had, after all, survived several episodes of glaciation-deglaciation up to that point.
-
Nick Palmer at 22:51 PM on 1 June 2013Global warming is here to stay, whichever way you look at it
noelfuller @comment 5 touches upon an important point. Anyone out there fighting in the trenches of the denialosphere, and the comment sections of newspapers etc, knows that the "it hasn't warmed for 15/16/17 years" meme is very powerful these days.
Recently, it has been clear to those who look at the whole picture, that much of the net energy from the radiative imbalance is, at least temporarily, being sequestered in the deeper ocean. But this is a relatively recent explanation and the denialosphere and media commentators tend to dismiss it as being a form of hand waving. As we are honored to have Dr. Trenberth here, perhaps we can get a definitive "admission" from the horse's mouth? Would it be fair to say, Dr. Trenberth, that the predicted trend in mean surface/atmospheric temperature was represented in the original IPCC literature as being expected to be somewhat more linear than it has proved? As you suggest in your post, there is a relatively recent (and presumably unexpected in the literature) change in ocean sequestering due, as you say, to:
"a particular change in winds, especially in the Pacific Ocean where the subtropical trade winds have become noticeably stronger, changing ocean currents and providing a mechanism for heat to be carried down into the ocean"
It seems very likely that the 15 to 20 year old science, that the denialosphere hark back to "prove" that the current pause in global surface/atmosphere temperature trends was not predicted by the science, did not explicitly predict this new ocean mechanism would act as such a temporary atmospheric heat sink.
I think most here realise that a long pause in surface temperature trends is in no way a good thing, but to the general public it looks like a) a good thing and b) that climate science got it rather wrong. Both of these sentiments are heavily exploited by the propagandists.
So, to sum up, I think the time is ripe for those climate scientists with a higher media profile, andt the climate science communication websites, to state that Earth has not behaved quite as most would have expected from reading the IPCC literature 20 years ago. From that perspective, the pathological sceptics are right that the pause was not really predicted. As they use that to jump to the unwarrented conclusion that, because the evidence now shows that the 20 year old science was incomplete, they can discount all the science. From a human perspective, the uncertainties and assumptions in the climate models, the known unknowns, and the unknown unknowns, if they exist, could go either way. To publicly counter the "16 year pause", so a sceptical public accepts the science again, it needs to be said that the unexpected has stepped in to complicate the outlook and the full ramifications and the concomitant risk analysis of this needs to be out there in the public arena so the public can judge whether they feel lucky or not...
-
perseus at 19:54 PM on 1 June 20132013 SkS Weekly News Roundup #22B
Re The inevitable climate catastrophe
About 13,000 years ago, the Northern Hemisphere experienced an episode of cooling (probably after a comet collided with the earth) that wiped out most species there.
Doesn't sound very likely, does he mean wiped out most megafauna? I presume this is the Quaternary extinction event he is referring to? I think the causes behind this extinction and the precise timeline are more contested than is suggested here.
https://en.wikipedia.org/wiki/Quaternary_extinction_event#Climate_change_hypothesis
-
gpwayne at 17:35 PM on 1 June 2013Global warming is here to stay, whichever way you look at it
Some comments here refer to nomenclature problems - Heat, Warming, Surface temps and so on - and I've had to adapt my own punter-level commenting to address this.
I now discuss climate change in terms of 'energy'. I have found it easier to discuss the potential of climate change in public discourse if I make clear that the climate is a system of energy imbalances continuously trying to achieve equilibrium, and that if there's more energy available to the climate, then all aspects of it (extreme weather, ice melting and the energy required for phase changes, cold snaps, precipitation, fires, floods, sea-level rise, general instability) must be affected, since the extra energy is indiscriminate.
I do think we need to develop our vocabulary, and trust in the intelligence of the public. Global warming is a misnomer that we spend a lot of time qualifying, and with the greatest respect to Trenberth, I'm not sure 'heating' is a better synonym (even though it is, of course, quite accurate).
Prev 886 887 888 889 890 891 892 893 894 895 896 897 898 899 900 901 Next


