


 Arguments


Recent Comments
Prev 888 889 890 891 892 893 894 895 896 897 898 899 900 901 902 903 Next
Comments 44751 to 44800:
-
JasonB at 18:46 PM on 17 July 2013CO2 effect is saturated
Stealth,
As for getting source, I’ve chased down through many of the links provided and yet have been able to get to any source code. I recall doing this a while ago, and getting code is not as easy as you all imply.
Step 1: Click on the link I provided to RealClimate.
Step 2: Click on the very first link in the list, "GISS ModelE".
Step 3: Scroll down to the section "CMIP3 Model Configuration and Description". Where it says "The frozen version of the ModelE code used for CMIP3 simulations and the controls for model description papers is denoted as ModelE1 (internal version number 3.0, dated Feb. 1, 2004). This code can be freely downloaded (as a 1.2 MB gzip-ed tar file) from modelE1.tar.gz.", click on "modelE1.tar.gz". This is the source code for the version used in AR4.
Step 4: Un-zip and un-tar the source code from modelE1.tar.gz. I use 7-zip under windows.
Step 5: Open the "model" folder. Inside you'll find "all the model source code used in all possible configurations".
There are also instructions for downloading the historical forcings to be used as input. doc/modelE.html gives a brief overview. The NASA GISS page links to papers, etc.
I hope that wasn't too difficult.
The climate models seem to be coarse in resolution, and there seems to be uncertainty as to whether or not clouds are a positive or negative feedback.
Of course they're coarse. They're not trying to forecast weather, they're trying to forecast climate, and they're trying to do so in a reasonable time frame. You can predict that summer will be hotter than winter on average, and Miami will be hotter than Boston on average, without knowing what the exact weather will be on a micro-scale.
And as Tom points out, those uncertainties are already baked in to the forecasts. But note that the uncertainty about what we're going to do about AGW is larger than the models' uncertainties about what the consequences of each course of action will be.
Regarding clouds, the reason why we can't be certain whether they will be a positive or negative feedback is precisely because so far it seems to be a wash; the latest results indicate they may be slightly positive. If they were a strong feedback either way then it would be easy to identify. To argue that the models significantly over-state future warming on that basis is to argue that clouds will become signficantly negative in the future despite no evidence to support that — in other words, wishful thinking.
-
old sage at 18:29 PM on 17 July 2013Trenberth on Tracking Earth’s energy: A key to climate variability and change
There seems to be a lot of misunderstanding here due to a little knowledge being a bad thing. My physics dna prompted me to say co2 molecules were in the ground state so I tried to check and could only confirm this indirectly. I did find the figures for H2O - and these probably copy across reasonably well. The extra dimensions to the translational degrees of freedom have critical temperatures of 5170,5400,2290 degs K.
Glen Tamblyn - all radiation is quantised these numbers tell you just how high the temperature has to be to jiggle your molecule enough to radiate. (Of course, by QM there will always be the rare event corresponding to a freak combination of collisions) Also, fwiw, the surface of a body is primarily formed of outer electrons, it is their transitions stimulated by the underlying lattice which generate BB radiation. I do know the magnitude of difference thank you for atomic - and molecular energy transitions.
-
Tom Curtis at 14:25 PM on 17 July 2013CO2 effect is saturated
Stealth @254, of course the models have large margins of error. Have you not seen the error bars on the temperature predictions:

That does mean we might luck out and bring in a temperature increase of 2 C (the upper limit of what is considered safe) by 2100 even doing nothing; but we equally might get unlucky and see a temperature increase over 5 C. Further, the two scenarios are not equal, with the increase in damage for each extra C of increase in temperature being highly non-linear. Therefore rational policy making should weight the unfortunate outcomes more.
One thing is very clear, however, even given the wide margins of error. Not curtailing emissions will see temperature increases to values that have never been seen by Homo sapiens, and which are likely to radically reshape our world.
-
Tom Curtis at 14:14 PM on 17 July 2013CO2 effect is saturated
Stealth @252, from Myhre et al 1998, the mean global clear sky forcing of CO2 in 1994 was 1.78 W/m^2 (model range 1.759-1.8 W/m^2). The mean global cloudy sky forcing of CO2 was approximately 1.32 W/m^2 (model range 1.313 to 1.37 W/m^2). The global value for 1994 CO2 concentrations (358 ppmv) using their simple formula is 1.315 W/m^2. From that I deduce that by "cloudy sky" they meant what would now be called "all sky" conditions.
Although clouds will reduce the CO2 forcing, only thick clouds with very high tops will eliminate it entirely. Other than cumulo-nimbus clouds, most low clouds will have very little effect on the CO2 forcing because their tops are well below the altitude at which CO2 radiates to space. Those clouds still have a greenhouse effect because their absorb and radiate across the entire IR spectrum, including in regions in which well mixed gases do not absorb and radiate.
In the more recent Lacis et al (2010) (Preprint version) shows the clear sky CO2 greenhouse effect is 26% stronger than the all sky effect. The single factor addition effect (ie, no overlaps with water vapour) is 29% stronger than the all sky effect. That compares with about 33% stronger for Myhre et al.
-
Klaus Flemløse at 14:09 PM on 17 July 2013Nils-Axel Mörner is Wrong About Sea Level Rise
Many thanks for the comments on post No 80.
Prof Nils-Axel Mörner and Nils-Finn Munch Petersen are using photos to substantiate their claims of a falling sea levels at the Maldives. As I see it , they are using photos as an attempt to deliberate and manipulate readers to believe in their claims. None of the used photos support their claims of a falling sea level. They have chosen photos that have been changed by cutting and photo-shop manipulations.
There is a ongoing formation and decomposition of a coastline. Therefore, it is impossible from a picture to infer anything unless there is a systematic and comprehensive changes to a coastline over many years.
Their view of the water level at the Maldives may not be supported by scientific analysis.
Their view is repeated again and again in many newspapers and climate skeptic circles. Therefore it is necessary reply again and again. -
Tom Dayton at 13:50 PM on 17 July 2013CO2 effect is saturated
Stealth, how about Clear Climate Code?
-
StealthAircraftSoftwareModeler at 13:29 PM on 17 July 2013CO2 effect is saturated
As for getting source, I’ve chased down through many of the links provided and yet have been able to get to any source code. I recall doing this a while ago, and getting code is not as easy as you all imply. The NASA GISS ModelE is restricted to those with a nasa.gov IP address. When I try to download one of the ModelE snapshots, I just get an invalid ZIP archive. CESM from NCAR/UCAR only talks about the various versions, but I don’t see any accessible source code. EdGCM 4D appears to be built on top of ModelE and doesn’t provide source code. It looks like a pre built package that one can install and play with, but no source code. The subversion source code repository for CCSM4.0 requires a username and password.
Well, this is enough wasted time looking for model source code with no luck. I’ll look more at a later time. Have any of you that provided links (most of whom implied that I'm an idiot that can't do a 2 second Google search) actually download any source code for any model?
But I was stuck by this statement from the Azimuth project (http://www.azimuthproject.org/azimuth/show/Climate+model):
“General circulation models used to simulate weather and climate do not operate at fine enough grid resolutions to resolve many observed regional weather and climate features.”
This comment from the Met Office on the same page is also interesting:
“Clouds could create positive or negative climate feedbacks and are an ongoing area of research. One example is low-level clouds, especially stratocumulus, which help reflect sunlight and keep the Earth cool. The more stratocumulus we get over the planet, the more cooling effect. If our warming climate creates more low cloud, this would be a negative feedback — helping to offset the heating by reflecting more sunlight away from Earth. If our current climate change means there will be less low cloud overall, then this would be a positive feedback — contributing further to the warming by allowing more sunlight in.”
The climate models seem to be coarse in resolution, and there seems to be uncertainty as to whether or not clouds are a positive or negative feedback. This seems to be an admission that the models a) do not model clouds well, and b) that they could either warm or cool the planet, and c) induce a lot of doubt about the accuracy of the models. How do you develop so much confidence in the accuracy of the climate models when the model developers make statements like this? They seem to be agreeing with me and saying there is sizable uncertainty.
Moderator Response:[TD] Cloud feedback claimed to be negative is covered here. But the bottom line of course is how well the models have actually performed, both in hindcasting and in forecasting; that topic is covered here. If the models perform well enough to tell us what action we should take, then it really doesn't matter whether anyone personally believes that they should perform poorly, nor does it matter how much they might be improved.
-
KR at 13:10 PM on 17 July 2013CO2 effect is saturated
Stealth - "Is the 5.35 value true for clear skies only, or entire average of the whole atmosphere?"
Myhre 1998 refers to and builds upon Myhre 1997, which states that "Spatial and temporal variation in the radiative forcing due to variations in temperature, humidity, and cloudiness has been taken into account on the basis of observed data." This supported the rational for (and accuracy of) using multiple atmospheric columns in computing the Myhre 1998 results. So, yes, the CO2 forcing function is for the atmosphere as a whole, not just clear skies.
-
StealthAircraftSoftwareModeler at 12:48 PM on 17 July 2013CO2 effect is saturated
Scaddenp @242: I don’t think I’m confusing models. I think understand the differences between them and their various purposes, at least in a high-level way.
As for the 5.35 value, I read a paper (which I cannot find now) that was trying to find the CO2 finger print in satellite measurements, and they only looked at clear skies over the Pacific Ocean. I thought it was Harries et al 2001, but it must have been something related. Nevertheless, the forcing value for CO2 has been stated as:
ΔF = 5.35*ln(C/C0) W/m2
Is the 5.35 value true for clear skies only, or entire average of the whole atmosphere? Others in this thread have implied that this is the forcing for CO2, which implies all conditions. But the empirical measurements seemed to be done only for clear skies. If it has been measured in clear skied only, then what does the forcing equation look under cloud conditions? If clouds completely absorb all IR in the bands that CO2 can affect, then this would imply that CO2 cannot absorb any more and the forcing function would be zero when there are clouds. If 65% of the earth is covered with clouds then wouldn’t the 5.35 value be multiplied by .35 since only 35% of the sky is clear? This would imply that the value is 1.87. Or, is the value for clear skies really 15.29 and then when it is averaged over the globe it becomes 5.35? I am not making any claims about the value, just asking if this forcing equation for CO2 is valid through clouds.
-
villabolo at 12:28 PM on 17 July 2013Carbon Dioxide's invisibility is what causes global warming
Abbot: "invisible, odourless, weightless, tasteless substance".
Invisible: So is the oxygen in our atmosphere which would only burn us down if it were to double in proportion to the other gases.
Odourless: So is Methane.
Weightless: Take some physics. A Carbon Dioxide molecule has more "weight" - mass than an oxygen molecule.
Tasteless: It makes for a great flavor in phizzy drinks.
-
Tom Dayton at 11:28 AM on 17 July 2013CO2 effect is saturated
Stealth, I have replied to your comments about the quality of models on a more appropriate thread: the counterargument to "Models are Unreliable."
-
Tom Dayton at 11:26 AM on 17 July 2013Models are unreliable
Stealth (on another thread) wrote "I would love to examine the source code of some GCMs to see if Dr. Freeman Dyson’s claim that GCMs are full of fudge factors is true. I suspect that it is true because software modelers always have to make assumptions and design trades in order to get software to run in a reasonable amount of time."
Stealth, Freeman Dyson has no idea what is in climate models, as he himself has publicly admitted. For some reason he is comfortable admitting he knows nothing about climatology but in the same conversation stating his admittedly baseless speculations as if he is absolutely confident they are facts.
Probably what Dyson meant by "fudge factors" were parameterizations, which are not merely fudge factors. RealClimate has short explanations of parameterizations in its FAQ on Climate Models Part II.
Regarding the overall quality of the software engineering aspects of models: No software is perfect (not even software for controlling spacecraft), but good software is good enough for the purposes it is put to. Determining whether software is sufficiently good is a process called verification and validation (V&V). Climate models do go through V&V. The type of V&V must be appropriate to the type of software and the contexts of its construction and use. The same is true of V&V of climate models, as Steve Easterbrook explained; Steve used to do V&V for NASA software.
But the real test of GCMs' adequacy is in their ability to predict, which is quite good at the time scales they are expected to predict well. The forcing and feedbacks interact to produce temperature changes that bounce up and down. Those changes in periods of less then 30 years are called "weather," but those short-term weather changes average out across periods of 30 years or more, so 30 years is approximately the definition of "climate." Weather is not climate, so predicting weather is not the same as predicting climate. Weather, especially in small geographic areas, is nearly impossible to predict more than a week in advance, but climate, especially for large geographic areas such as the entire globe, is and has been successfully predicted decades in advance--notably by Arrhenhuis in the 1890s, with more fine tuning in each generation of model, for example by Hansen in 1988, and with increasing accuracy with each improvement in the models. The accuracy is most evident in graphics if you properly position the observed temperature line at its mean trend at the start of the graph, as explained with the last three figures in a post by Tamino.
-
KR at 11:23 AM on 17 July 2013CO2 effect is saturated
Stealth - "Can I get the source to any of the GCM models? I doubt that I can..."
From the first two pages of a Google search on "code for climate model":
- http://csdms.colorado.edu/wiki/Climate_models
- http://www.azimuthproject.org/azimuth/show/Climate+model
- http://www.giss.nasa.gov/tools/modelE/
- http://www.cesm.ucar.edu/models/ccsm4.0/
- http://data1.gfdl.noaa.gov/nomads/forms/deccen/
Not too difficult to find...
-
JasonB at 11:06 AM on 17 July 2013CO2 effect is saturated
Stealth,
I don’t have time to look at them all, and they give widely different projections based on the spaghetti graphs I’ve seen, so I’d only like to see the one that is considered the best.
This demonstrates a fundamental misunderstanding of what climate models are doing.
Weather is chaotic. The timing of even signficant events like El Nino/La Nina cannot be predicted years into the future. In order to distingish between long term climate change, and the effects of internal variability, it is essential that repeated runs of the same climate model exhibit different realisations of that internal variability. This allows them to be averaged together so that the random variations cancel out leaving behind the systematic changes that will dominate in the longer term.
Even then, there is a risk that the forecasts of individual climate models inadvertently contain systematic biases that won't be cancelled out by this procedure due to the choices that were made in designing them and potentially even software bugs. So different models from completely different groups are also combined, to see what is common in their forecasts and what varies between them. Given their varied nature, if they all predict the same thing to within some tolerance, then we can have a certain amount of confidence that the true answer lies within that range; if they disagree about something, then our confidence is reduced.
Of course, since they are all embodying known physics to varying degrees, they will all contain systematic biases towards "reality, as we understand it" in that regard.
Anyway, far from being an indication of failure, those spaghetti graphs are an essential element of determining the reliability of the forecasts and trying to predict the range of possible outcomes.
Can I get the source to any of the GCM models? I doubt that I can, but it is worth a try.
Perhaps you should check a little bit harder before beginning to "doubt"?
-
KR at 10:58 AM on 17 July 2013CO2 effect is saturated
Stealth - RealClimate has links to both climate data and a number of model codes here, including GCMs and others.
"...GCMs are full of fudge factors..."
Um, no. They are full of physics. There are parametric approximations of small-scale phenomena, and for limitations of sampling and scale - but those are anchored in physical measurements, they are not "fudge factors" or tuning knobs for giving a specific result. Temperature projections and climate sensitivity are outputs of the models, not inputs, and a great deal of the variation between individual model runs comes from differing initial conditions. That variation is in fact part of the results, indicating to some extent the range of potential weather we might see around climate trends. See scaddenp's link above for more discussion.
You do, I hope, realize that "fudge factor" claims are essentionally accusations of fraud aimed at the model authors? And unsupportable ones, to boot?
-
Tom Dayton at 10:58 AM on 17 July 2013CO2 effect is saturated
Stealth, the fancy computer models merely fine tune the basic projections that have turned out to be pretty accurate, starting in the 1800s, and the early ones certainly did not involve computer code because computers had not been invented yet. You can try some of those simple models yourself by getting an introductory textbook such as David Archer's Global Warming: Understanding the Forecast, or by taking notes while watching his free online lectures from his class at the University of Chicago.
Tamino has illustrated a simple climate model you can run without a computer if you have a lot of time, or with a spreadsheet if you don't mind using a computer. He also has a followup that's only a bit more complicated.
There are a bunch of other climate models that are simple enough for learning and teaching. One list has been compiled by Steve Easterbrook.
Code for slightly more complex or narrow models also is freely available. RealClimate's "Data Sources" page has a handy but short list. Even the full-blown General Circulation Models (GCMs) have freely available code. RealClimate's Data Sources page also has a handy list of links to those codes. Steve Easterbrook has a three-year old list of GCMs with links to whatever info he could find about getting their codes. See also Tamino's Climate Data Links.
-
JasonB at 10:51 AM on 17 July 20132013 SkS Weekly News Roundup #28B
This dropped in my Inbox this morning:
Huge iceberg breaks away from the Antarctic
Quote:
For the Western Antarctic ice shelf, an even faster flow of the Pine Island glacier would presumably have serious consequences. “The Western Antarctic land ice is on land which is deeper than sea level. Its “bed” tends towards the land. The danger therefore exists that these large ice masses will become unstable and will start to slide,” says Angelika Humbert.
If the entire West Antarctic ice shield were to flow into the Ocean, this would lead to a global rise in sea level of around 3.3 metres, inundating many coastal towns and cities.
-
scaddenp at 10:22 AM on 17 July 2013CO2 effect is saturated
Source code is available for many of them. See here for GISS ModelE. Weather is chaotic so the same climate model will different wiggles for different initialisations. They dont pretend to be able to predict weather. 20-30 years are what climate is about. There is a very useful article on interpretation here.
Understanding the real differences between different modelling approache is what CMIP5 (and its predecessors) is about.
-
JasonB at 10:20 AM on 17 July 2013Climate Change Denial now available as Kindle ebook
PG_Bill,
While it doesn't address your desire to boycott Amazon, note that Kindle readers are free and available for many platforms, including MacOS X, Windows, and Android, so at least you don't have to pay for that. See e.g. http://www.amazon.com/gp/kindle/pc/download.
-
StealthAircraftSoftwareModeler at 10:13 AM on 17 July 2013CO2 effect is saturated
John Hartz @239: I would love to examine the source code of some GCMs to see if Dr. Freeman Dyson’s claim that GCMs are full of fudge factors is true. I suspect that it is true because software modelers always have to make assumptions and design trades in order to get software to run in a reasonable amount of time. Can I get the source to any of the GCM models? I doubt that I can, but it is worth a try. I know there are a dozen so models, and if source code is available, which would you recommend I look at? I don’t have time to look at them all, and they give widely different projections based on the spaghetti graphs I’ve seen, so I’d only like to see the one that is considered the best.
-
JasonB at 10:02 AM on 17 July 2013Sea level rise is exaggerated
DSL,
What Earthling is saying is that because starvation is bad for you, obesity must be good. Or because drought is bad, flooding must be good. This seems like the appropriate place for that argument.
If he's worried about ice ages, perhaps he should ponder the selfishness of squandering what could have been a useful geoengineering resource to future generations faced with an imminent glaciation; carefully burning fossil fuels to enhance the greenhouse effect just enough to maintain temperatures in the face of declining northern-hemisphere insolation due to the Milankovich cycles may well be the most cost-effective method for them to do so, if those resources are still around at the time.
-
Tom Curtis at 09:56 AM on 17 July 2013Nils-Axel Mörner is Wrong About Sea Level Rise
Klaus @80, the lighthouse is located on the southern coast of the island, just north of the barren patch above the word "niveau" in your third picture. In that picture, it is covered by the icon for a photo, but you can still see some of the white cement(?) around its base.
If the description of the location of the photo is accurate, then it is clear it was not taken from the beach on the north side of the island adjacent to the lighthouse. That is because the photo is sighted along the beach, which clearly recedes leaving an expanse of water along the line of sight to the isthmus. Similar considerations indicate the photo was not taken along the shore of the bay that you indicate.
Rahter than either of those two locations, I suggest the photo was taken on the west end of the long white beach directly below the word "Minicoy" in your second photo. Indeed, it was probably taken pretty much directly below the second "i" (or the following two letters) of that word. As you will notice, the line of that beach directly aligns with the isthmus, which is clearly visible in the background of the first photograph.
The white sand at that location shows that wave action tends to deposit sand there, and given its location relative to currents, will not typically remove sand. It is a relatively sheltered location, however, and the rate of deposition is likely to be slow. Therefore I do not agree with your explanation of the photo.
To me, it is far more likely that the vine covered area on the beach is just that area that is most commonly wave swept only as a result of storm surge. Sea level in that area can vary by around 200 centimeters based on changes in large scale wind patterns (Indian Ocean Dipole) and by another 200 centimeters based on tidal action, but storm surge can lift sea level by one or two meters. Given such a low beach it would be extraordinary if occasional cyclones did not sweep that beach, and in doing so sweep the vine covered area of the beach. Such occasional storm surges would more than adequately explain the coverage of that area of the beach by rapid growing vines, but not by slow growing trees.
-
Tom Curtis at 09:26 AM on 17 July 2013Patrick Michaels: Cato's Climate Expert Has History Of Getting It Wrong
Old Mole @43, I believe Anderegg et al, 2010 is the more appropriate study for comparison purposes. They show that mean expertise of climate scientists unconvinced by the evidence of AGW (UC) as measured by lifetime peer reviewed publications is 60, about half of that of those convinced by the evidence (CE) at 119 publications. Michaels appears to fall just below the mean for those who are UC, with around 50 peer reviewed publications over his lifetime, although he has far more non-peer reviewed publications for Cato or Heartland. Restricted to publications from 2007 forward, my search only reveals three publications. If he has indeed published four over that period, and a similar level of inaccuracy applies to the whole search it is certainly possible that he has more than fifty lifetime publications, and may have as many as one hundred. For comparison, here is a graph of the number of publications by researchers analyzed by Anderegg. Michaels falls in the second smalles category:
-
Glenn Tamblyn at 09:14 AM on 17 July 2013Trenberth on Tracking Earth’s energy: A key to climate variability and change
old sage
You talk about "Co-operative movements due to thermal oscillation means that lattice waves involving many nuclei, phonons if you will, in collision have sufficient energy to cause photon energy level transitions in the electron bands"
In essence you are talking about Atomic spectrocopy. The absorption and emission of energy by an atom that involves transitions in that atoms internal energy levels.
This is not the basis of GH gas absorption/emission!
With GH gases we are dealing with Molecular Spectroscopy. The essential mechanism is as follows:
- Differing atoms have differing electro-negativities, differing tendencies to hold their elctrons closely or not. Oxygen for example is strongly elctro-negative, Hydrogen less so.
- When combined into molecules this can result in charge separations across a molecule, with one side of the molecule appearing to be negatively charged and the other positively so.
- Since the bonds holding the atoms together are not rigid, the individual atoms within a molecule are always jiggling around.
- So for molecules with a charge separation, this continual movement can result in a continuous movement of electrical charges.
- And based on Maxwells Eqns, moving electrical charges can generate EM Radiation(radiation). And conversely EM Radiation can cause a change in the movement of an electric charge (absorption)
Think of a ball on a spring, bouncing around. If you wack that ball with a stick the ball may end up bouncing more fiercely. You have trtansferred energy to the ball/spring system that is now stored as kinetic/potential energy of the ball/spring system.
Molecular absorption/radiation is about changes in the kinetic and potential energy of vibration of atoms within a molecule, the energy being trasnported into and out of the molecule based on Maxwells Eqns, not changes to the internal energy levels within the atoms.
It is an inter-atomic phenomenon, not intra-atomic.
-
Glenn Tamblyn at 08:56 AM on 17 July 2013CO2 effect is saturated
Stealth
A very important distinction needs to be made and clarified here. The models that are being referred that calculate the 5.35 ln(C/C0) result are not climate models! They are Radiative Transfer Codes; solutions to the equation of Radiative Transfer. As such what they do is, given a known state for a column of gas - temperature, pressure, humidity and composition profiles - they calculate the instantaneous radiative state at any point in that column. As such, the underlying maths is actually relatively simple. And they work from databases of very well established spectroscopic data. There are no assumptions or time based modelling or projections, they calculate a single snapshot.
A bit like engineering stress analysis programs, where they do the same simple calculations many times over for small cells to build up the composite picture. And their results are used in a wide range of applications, Climatology is only one of them. They are used in astronomy, military,, satellite communications modelling, a whole host of different domains. And their results have been extensively tested in the field and in the lab. -
Old Mole at 08:52 AM on 17 July 2013Patrick Michaels: Cato's Climate Expert Has History Of Getting It Wrong
I have a couple of problems with this article, although I am by no means a fan of Pat Michaels.
"Yet during that time [2007 to July 2011], Michaels only published four peer-reviewed climate articles. In comparison, 97 percent of the most actively publishing climate researchers agree that "most" of recent warming is manmade, and 84 percent of climate scientists say the public should be told to be worried or "very worried" about climate change. Despite this, USA TODAY, The Washington Post, and CNN all hosted or quoted Patrick Michaels in 2012."
I have no data to go on (although John Cook may well have, having just done a paper ) but based on no more than the SkS policy of citing learned articles as (Whozitz, 2013) and not (Whozitz, 2013a, b, and c) that one peer-reviewed article per year would put him in at least the upper quartile of those publishing, not the lower quartile as this paragraph rhetorically implies. I would be much more interested in how he got the sort of nonsense he persists in spouting in interviews past peer review.
Yes, he does get 40% of his funding from the fossil fuel industry, and yes, the Cato Institute was the Charles Koch Foundation for the first two years of its existence. You justifiably heap scorn on his claim that scientists support AGW because of "funding" (not money ... I think there is a difference) because that is an extraordinary claim for which he provides no evidence. But where is your evidence that Pat Michaels would be saying anything different if he did not receive any money from the fossil fuel industry? While not directly stated, the imputation is of venality on his part, and while I can believe there are some people who would be willing to prostitute themselves into saying anything in their client's interest, most of them go into law rather than science. Corelation is not evidence of causation.
Today is the 68th anniversary of the first field test of the biggest science project in history, in Los Alamos, New Mexico. I wish you all the best of luck keeping politics out of your science project ,,, at least much more than those scientists had.
Best wishes,
Mole
-
Philippe Chantreau at 08:13 AM on 17 July 2013Nils-Axel Mörner is Wrong About Sea Level Rise
Well, Klaus, by now, I think it's pretty obvious. You demonstrated what real skepticism is like.On one side, a photo with no context and an authoritative assertion that has no backing. On the other side, the same photo, with all the context and numeric data. Who is right is as clear as the waters around the Maldives on a good day...
-
scaddenp at 07:41 AM on 17 July 2013CO2 effect is saturated
ps. After getting the full picture on humidity from the link indicated, I'd be interested in your assessment of tactics used by Climate4you to mislead.
-
scaddenp at 07:32 AM on 17 July 2013CO2 effect is saturated
Stealth - you say. "That cannot be true, otherwise people would not be building models as a way to attempt to arrive at these values."
I think you are confusing different models here. I dont think anyone is doing much on work on refining the 5.35 value from Myhre. As pointed out, the uncertainities are low and matches observation.By comparison global GCMs are trying to model what will be climate response to this deltaF. These models do have significant uncertainities resulting in varying estimates for climate sensitivity from 2-4.5. Dont confuse the difficulties with modelling climate response with the modelling required for calculating the forcings. Different models.
-
MA Rodger at 07:27 AM on 17 July 2013Trenberth on Tracking Earth’s energy: A key to climate variability and change
old sage @231.
Do you mean this Stephan's Law? So what is j* = 5.76040e-8 x 300^4? Of course it could be the answer is 56 wm^-2, but bless my quintessense, the abacus has run out of beads!!
And one question. Does it matter a ha'p'eth that the receptor is at 0ºK? Your calculation is the Earthly emissions, not net Earthly emissions. And I'm still very worried by the bridge!!!
-
PG_Bill at 07:22 AM on 17 July 2013Climate Change Denial now available as Kindle ebook
Kindle is an Amazon product and Amazon have been getting a lot of stick here in the UK recently, firstly for managing to avoid paying any tax at all, then also for being anti-union and squeezing the competition. Many people (including me) are boycotting them, which of course includes not buying a Kindle.
But good luck with the print edition. -
Klaus Flemløse at 07:20 AM on 17 July 2013Nils-Axel Mörner is Wrong About Sea Level Rise
I have tried to investigate the photo from Minicoy Island from 2010 taken by Nils-Finn Munch Petersen – se post 56.
Figure 6 One of the locals of Minicoy, Ali Manikfan, showing how much the island has grown. What was once the beach is now located well above the wave-washing zone, is becoming overgrown (just as many beaches in the Maldives; Fig. 4; Mo¨rner et al., 2004; Mo¨rner, 2007a,b) and invaded by land-snails (photo: N.F. Munch-Petersen, 1992). Link.
This photo has been used as documentation that the water level in the Maldives is decreasing. The photo was taken at the north side of the south-western part of the island close to the light tower looking towards the isthmus.
Here is a picture of Minicoy Island:

Here is a picture of the isthmus:

In the bay protected by the isthmus on the inside of the atoll, it is expected in most cases that new land will be created. Prof Nils-Axel Mörner and Nils-Finn Munch Petersen have used this as the proof of the decreasing sea level around the Maldives.
Using Google Earth, it appears that there is erosion on large parts of the island and a buildup of sand in at least two places as a result of coastal protection programs.
It would be pleased if someone could check my argument.
From Colorado University, I studied the water level around Minicoy Island. This is shown in the following figure:

This figure shows that the water level has increased by about 3.2 mm per year during the years 1990-2013.
So we have a paradox as Prof. Nils-Axel Mörner and Nils-Finn Munch Petersen claim that the water level is decreasing whereas sea level based on satellite measurements show the opposite. Who is right?
-
Zen at 07:04 AM on 17 July 20132013 SkS Weekly News Roundup #28A
Does anyone know if there is a chart showing the long term trend in extreme weather events and, if so, could you provide a link?. Thanks.
-
PluviAL at 06:27 AM on 17 July 2013Global warming games - playing the man not the ball
I tried to go to SLDF to make a small contribution, but my virus scan tells me it is a dangerous site. Does anyone know what that is about?
-
cormac at 06:17 AM on 17 July 2013They didn't change the name from 'global warming' to 'climate change'
The premise is wrong for a third reason. According to the OED, the term 'warming' means gentle heating, and nothing about temperature
-
Phil at 06:15 AM on 17 July 2013Trenberth on Tracking Earth’s energy: A key to climate variability and change
Apologies to KR and Bob @219 @220, I should have explained in more detail, however Bob guessed my method correctly! it was really was intended as an "order of magnitude" calculation to suggest that old_sage's comments @216 were the result of a lack of sagacity on his part.
Since the conversation has moved on, I would add that there is, in fact no such thing as a ground state for a molecule, there are, of course, multiple. For a triatomic linear moeclue such as CO2 there are 2 degenerate rotational states, 4 vibrational ones (symmetric stretch, asymmetric stretch and double degenerate bend) as well as the electronic state. At STP CO2 molecules will be in many excited rotational states, several excited vibrational states - particularly the bend which is a lowest frequency, and almost exclusive in the ground electronic state. The black body radiation from Earth is absorbed and emitted by the CO2 bend since its frequency coincides with the radiation emitted by earth. This is in the Infra-red region of the EM spectrum and is what KR refers to as Thermal Radiation. old_sage's reference to excited electronic states is simply a strawman.
-
Lou Grinzo at 06:10 AM on 17 July 2013They didn't change the name from 'global warming' to 'climate change'
Thank you for this posting. I don't know why, but it seems that there's been a big uptick lately in the number of claims that "we" changed terminology as some sort of ploy to fool people.
Given how quickly we're losing ice just about everywhere on the planet, I guess we were VERY persuasive...
-
gws at 06:08 AM on 17 July 2013Trenberth on Tracking Earth’s energy: A key to climate variability and change
The distribution of energy levels in a gas is decribed by the Boltzmann distribution. For atmospheric temperatures, several vibrational states above the ground state are populated for CO2 and all other greenhouse gases. However, this would still not guarantee a greenhouse effect if our atmosphere were homogenous in terms of pressure and temperature, which it obviously is not.
Textbook knowledge in one field (e.g. solid state physics) does not mean one understands gas phase physics, or can directly apply one to the other. In this case, an understanding of both (infrared-) spectroscopy and radiative transfer are needed. As oldsage seems to display major misunderstandings of even some basics, I suggest to tone it down and start form the beginning. As he said: "Get your text book out." Will you do that too oldsage?
-
Composer99 at 06:00 AM on 17 July 2013Trenberth on Tracking Earth’s energy: A key to climate variability and change
This is practically impossible with CO2 molecules. CO2 molecules at STP are in the ground state - where do they get the energy to radiate? Your claim that they do is purely and simply due to external stimulation. CO2 is simply an agent, a receptor if you like, for radiation generated elswhere it then will obviously participate in transitions as it seeks to return to its groundstate. You confuse scattering, which involves re-transmission of a proportion of incident energy with spontaneous emission - which again cannot happen.
What parts of CO2 absorbs longwave IR from the Earth surface (or from radiating molecules elsewhere in the atmosphere) and CO2 molecules receive thermal energy from collisions with other molecules in the atmosphere are you having trouble understanding? Certainly these seem to qualify as "external stimulation" allowing CO2 molecules the opportunity to "get the energy to radiate".
Seriously, absorption and emission of longwave IR by greenhouse gases is observed & measured (as per graphs & sources provided in comments responding to you). Insofar as there is any actual contradiction between your claim (as quoted in this comment) and what is observed, you are putting readers into the position of having to accept one of the following:
- Observed and measured phenomena, consistent with known radiative physics, are false.
- old sage's claims are false
I put it to you that the choice is obvious (and unfavourable to you).
-
KR at 05:38 AM on 17 July 2013Trenberth on Tracking Earth’s energy: A key to climate variability and change
old sage - What I have been discussing is thermal radiation, observed in all matter at a temperature greater than absolute zero - where kinetic energies cause dipole oscillations and accelerated charges, and result in photon emission.
A significant percentage of CO2 at standard temperature and pressure is indeed above ground state, and radiating, as can be shown with IR spectroscopy. And that energy could come from incoming IR at CO2 absorption wavelengths or perhaps from a heated wire - spontaneous thermal emission, not scattering. The emission spectra is dependent on gas temperature, not on any incoming IR.
Again, your physics claims regarding thermal emission from gases are simply nonsense, contradicted by hundreds of years of both theory and observations.
-
Composer99 at 05:38 AM on 17 July 2013CO2 effect is saturated
Stealth:
Appeals to personal qualifications and arguments from incredulity such as on display in #236 and #238 are not terribly convincing.
All this:
Being a software modeler myself (for 30+ years) dealing with RF energy through atmosphere, I understand that what is measured in the lab, what is model in software, and what the real world does are almost always very different. The real world is so noisy and chaotic that I have found models are almost useless in predicting what will really happen in the real world. I would be stunned if this is not also true for this forcing equation, and GCMs in general.
Trying to measure this value for the real world, on average, is probably impossible given that the atmosphere is so different moment to moment and place to place, and changes in long term trends may be hard to determine since we have so little empirical measurement data.
I admit it *might be* correct, but I cannot prove or disprove it, nor can anyone else. This isn’t meant as a criticism of experts in this field, only a realization of my experience that the atmosphere is impossible to model accurately. [Emphasis mine.]
Your assertion that this is basic physics and models match the real world simply cannot be true. I understand physics (I have a physics degree) and I build software models for living (I also have a computer science degree) so I think I am qualified to speak to models and physics.
The climate is not that simple – far from it – so my assertion of uncertainty is, I believe, completely accurate and true.
strikes me as practically equivalent to:
I know what I'm talking about, trust me & not the data.
I don't believe this is true, therefore it is not true.
although I am sure it was not your intent to communicate such sentiments.
(I have highlighted in the quotes from your comments the three words that are often the butt of jokes on medical blogs: "in my experience" or variants there of are sometimes called "the most dangerous words in medicine". I see no reason why this maxim should not generally be applicable to other scientific domains, particularly when the person asserting it is arguing against the weight of evidence, as you are.)
-
KR at 05:17 AM on 17 July 2013CO2 effect is saturated
Stealth - Perhaps you should re-read just what you have quoted:
...net energy balance... This uncertainty is an order of magnitude larger than the changes to the net surface fluxes associated with increasing greenhouse gases in the atmosphere.
Since what we are discussing WRT Myhre 1998 are radiative transfer codes, and the change in forcings due to changes in atmospheric composition, we are indeed speaking of the 'net surface fluxes' which have far lower uncertainties. You seem to be conflating uncertainties in accounting for multiple energy flows into a total budget with uncertainties in computing atmospheric spectral response - applying an entire collection of uncertainties to a tiny portion of the puzzle.
If you wish to discuss the total energy budget, the sum of individual components (and their uncertainties) of the energy budget, there is an appropriate thread. However, the radiative transfer codes are well proven, giving results within under 1% of observations (Chen et al 2007) including dealing with compositional changes - arguing any significant uncertainties in that regard (as you have) is quite frankly unsupportable.
-
old sage at 05:13 AM on 17 July 2013Trenberth on Tracking Earth’s energy: A key to climate variability and change
I've made the physics as clear as a pike staff. The reason a solid emits as a black body is because the coming together of nuclei in close proximity forces the outer electronic bands so close together that they form a continuum of energy levels. Co-operative movements due to thermal oscillation means that lattice waves involving many nuclei, phonons if you will, in collision have sufficient energy to cause photon energy level transitions in the electron bands. It all goes on at the boundary layer as i/r cannot penetrate a solid for more than a skin effect depth so i/r cannot emerge from anything other than the skin.
This is practically impossible with CO2 molecules. CO2 molecules at STP are in the ground state - where do they get the energy to radiate? Your claim that they do is purely and simply due to external stimulation. CO2 is simply an agent, a receptor if you like, for radiation generated elswhere it then will obviously participate in transitions as it seeks to return to its groundstate. You confuse scattering, which involves re-transmission of a proportion of incident energy with spontaneous emission - which again cannot happen. Get your text book out.
I could also explain to you how phonon waves at very low temperature cause electrons to attract each other in pairs over very large distances (compared with the atomic diameter) but if you don't understand the above, you certainly wont understand that!
MA Roger - I just assumed stefans law with T 300 radiating to a body at 0K. -
MA Rodger at 04:54 AM on 17 July 2013The anthropogenic global warming rate: Is it steady for the last 100 years? Part 2.
KK Tunk @192.
I think this dialogue would benefit from my restating of the question @188. If you feel that you have answered this question adequately @190 & @192 then do say (although I would be surprised if this were so).
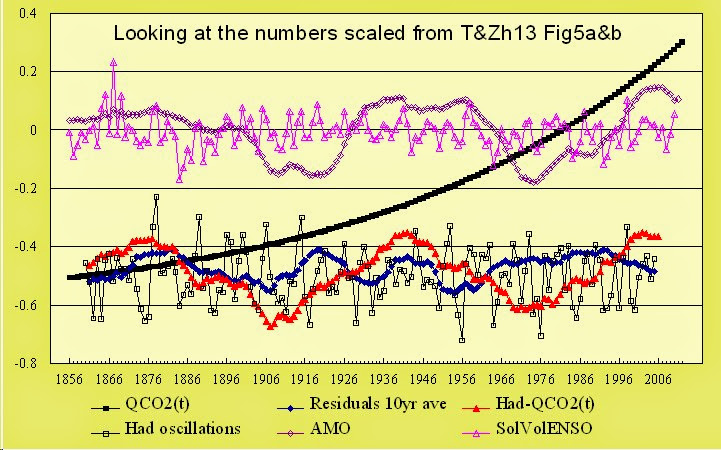
I here introduce a graph below showing the data from Tung&Zhou2013 Figs 5A&B. It presents quite a few questions but I will kick off here by asking about the wobbles in the blue trace.
The blue trace is the 10-year rolling average of residuals from the MLR obtained by subtracting the QCO2(t) function (introduced in your first SkS post) from the data presented in Fig 5B, and obviously re-based for clarity's sake. According to Zhou &Tung 2013 which covers your MLR analysis more fully than T&Zh13 "The residual ... should only consist of climate noise if the MLR is successful..." This conforms to my understanding of it.
Yet the blue trace showing the residuals from the MLR analysis in Tung&Zhou2013 shows a lot more than "noise." There are distinct wobbles and these are not small wobbles being 43% that of the original HadCRUT4 wobbles (red trace). The residuals thus contain a very significant part of the HadCRUT4 signal which the MLR analysis has failed to attribute.A cynic would point to such wobbles within the residuals as being indicative of curve-fitting.
For myself, I am more charitable and rather see the problem being that these wobbles have gone unreported in Tung&Zhou2013. Indeed, a very similar trace can also be derived from Fig 1B Zhou&Tung2013 yet that paper says of the data in Fig 1B "The global-mean temperature adjusted this way shows mostly a monotonic trend with some scatter." This blue trace is definitely not "scatter."
(Note that the graph below features data derived from your Fig 5A&B in Tung&Zhou2013 as there are other feature beyond the blue trace that I see requiring explanation & which I hope we can address in later comments.)Could you thus explain why this wobble is present in the residuals and why its presence has remained unreported?
-
John Hartz at 04:22 AM on 17 July 2013CO2 effect is saturated
@StealthAircraftSoftwareModeler:
Out of curiousity, which climate models have you analyzed in depth?
-
StealthAircraftSoftwareModeler at 04:13 AM on 17 July 2013CO2 effect is saturated
KR @237 To be honest, I’m fairly stunned by your response and I am not sure how to address it. Just out of curiosity, what is your background?
You seem to be asserting that the alpha coefficient of 5.35 of the CO2 forcing function is both accurate and precise because it has been empirically measured. That cannot be true, otherwise people would not be building models as a way to attempt to arrive at these values. Correct? Why build a model when you can just measure it. Your assertion that this is basic physics and models match the real world simply cannot be true. I understand physics (I have a physics degree) and I build software models for living (I also have a computer science degree) so I think I am qualified to speak to models and physics.
The climate is not that simple – far from it – so my assertion of uncertainty is, I believe, completely accurate and true. As further evidence to “prove” that there is enormous uncertainty in the climate, just read the TOA energy balance paper Stevens et al that was referenced by Tom Curtis @ 226. This is great paper! It is peer reviewed. At the end it states: “The net energy balance is the sum of individual fluxes. The current uncertainty in this net surface energy balance is large, and amounts to approximately 17 Wm–2. This uncertainty is an order of magnitude larger than the changes to the net surface fluxes associated with increasing greenhouse gases in the atmosphere.”
Think about that – the uncertainty in the energy budget is ten times larger than the fluxes associated with GHGs. This is clearly proof that my assertions of uncertainty are completely warranted.
-
KK Tung at 04:06 AM on 17 July 2013The anthropogenic global warming rate: Is it steady for the last 100 years? Part 2.
In reply to MA Rodger at post 191:As I said, I didn't quite understand your question and so it would help if you could ask it again if my reply in post 190 was not satisfactory. In that reply I was trying to address your corrected version---note that it did not address the incorrect references to Figure 2. It contains two parts, the first part was that you should not take the wobbles in Figure5AB as the original interannual variation in HadCRUT4. It is Figure 4A that should serve that purpose. The second part was the last two sentences, which explain what the residual should contain in practice. Ideally, the residual (after the anthropogenic response) should contain only climate noise, but in practice, especially in early decades of the data record, it could contain data inadequacies. Some of these data problems could also be amplified by the MLR procedure: Some of the timing of the occurrences of El Nino warming events in the HadCRUT4 data may not be consistent with the ENSO index we used a century ago. So the MLR may produce a negative spike, while the warming spike still remains. We could allow a lag in response that optimizes the removal of ENSO variations in the early decades, but the same lag then messes up the recent decades, which have better data.
-
KR at 03:37 AM on 17 July 2013CO2 effect is saturated
Stealth - Regarding Myhre 1998:
"I doubt it is realistic or correct relative to what is really happening in the real world."
You would be wrong. Those model results have been proven out, empirically measured by the satellite observations, such as those discussed in the opening post (Harries et al 2001 in particular). Have you read the opening post of this thread?
Yes, the Myhre results are based on numeric models of radiative absorption/emission - using column estimates from three multiple latitudes, three different models to minimize bias and atmospheric variation. And they have been confirmed - the satellite spectra show the same outgoing radiation as predicted by those models. And therefore the modelling of slightly different atmospheric compositions is trustworthy. There is really no doubt about them, no significant uncertainties in direct forcing calculations.
If your model reproduces observations from basic physics, it's a good model. Your issues about uncertainties are unwarranted.
-
DSL at 03:32 AM on 17 July 2013Sea level rise is exaggerated
Earthling, does that fact somehow make rapid sea level rise somehow benign?
-
John Fisher at 03:16 AM on 17 July 2013They didn't change the name from 'global warming' to 'climate change'
Here is one such example provided by Anthony Watts:
"Global warming" suggests a steady linear increase in temperature, but since that isn't happening, proponents have shifted to the more universal term "climate change," which can be liberally applied to just about anything observable in the atmosphere.
Climate Change without Catastrophe: Interview with Anthony Watts, oilprice.com, 11 March, 2013
Prev 888 889 890 891 892 893 894 895 896 897 898 899 900 901 902 903 Next


