


 Arguments


Recent Comments
Prev 893 894 895 896 897 898 899 900 901 902 903 904 905 906 907 908 Next
Comments 45001 to 45050:
-
KK Tung at 08:33 AM on 23 May 2013The anthropogenic global warming rate: Is it steady for the last 100 years? Part 2.
In reply to post 95 by Dikran: I liked your work investigating the effect of the change in baseline offsetting on the apparent model uncertainty.
-
KK Tung at 08:24 AM on 23 May 2013The anthropogenic global warming rate: Is it steady for the last 100 years? Part 2.
In reply post 95 by Dikran and post 96 by Dumb Scientist: I like the tone of our exchanges now. To understand the point I was trying to make, please first do not view my comments as saying there is anything wrong with the IPCC models. My comments concern the forced response vs internal variability. Since I do not know what the forced response is in the observation, I was using the model ensemble mean as a proxy for that. In fact this is an assumption that the model is perfect. Now we cannot do ensemble mean of the observation, because our climate is just one realization and we do not have the other ensemble members. So we cannot compare observation's forced response with the model's forced response. My statements were never intended to be a comparison of the two and see if the models are correctly simulating the real forced response. Subject to the caveat of my assumption of perfect models, my statement concerns the presence of internal variability. When the observation is below the model ensemble mean, I tentatively suggest that the explanation could be that there is an internal variability that is in a cool phase in the observation but is not (and should not be) in the model ensemble mean. The point I made previously was why we need it now during the hiatus period and not during the period of accelerated warming.
-
scaddenp at 07:52 AM on 23 May 2013Skeptical Science Study Finds 97% Consensus on Human-Caused Global Warming in the Peer-Reviewed Literature
rhJames - firstly, a consensus does exist. Secondly, while a consensus is not proof of a theory, it is the only reasonable basis for public policy so it is important to know what it is.
"Lets stick to the scientific evidence" _ well I wish deniers would but they instead prefer blog "science", cherry picking and misrepresentation. Cook13 is effectively a survey of the published scientific evidence.
-
grindupBaker at 07:45 AM on 23 May 2013It's satellite microwave transmissions
Rob Honeycutt #26 This is true but I have a single-tasking mind and like to keep the waters clear by considering physical realities as the indifferent entities that they are as much as I can. If I can ever manage to grasp them, might move on to spiritual & socio-political. I've scaled mentally by 5,000,000 because I can picture the Earth sphere knocking a small hole in the ceiling with the electromagnetic shining in, 1/8" 90% air, 1/20" oceans, gently warming until they lap the ice away, burping disasters across the land, and so on. It's a human scale.
-
Dumb Scientist at 07:32 AM on 23 May 2013The anthropogenic global warming rate: Is it steady for the last 100 years? Part 2.
Dikran Marsupial has performed an analysis which is relevant to this conversation.
Dr. Tung, if you'd like to comment on Dikran's method, we'd all appreciate your insight. Thanks.
-
Rob Honeycutt at 07:15 AM on 23 May 2013Skeptical Science Study Finds 97% Consensus on Human-Caused Global Warming in the Peer-Reviewed Literature
I have to say, one of the most compelling aspects of Cook13 is that the resulting consensus figures for the SkS rated papers almost precisely match the consensus figures coming out of the scientists' self-ratings. (97.1% vs 97.2% respectively)
If there was ever a great example of self-skepticism, this was it. John Cook made sure that we tested our own biases here at SkS against the evaluation of the scientists themselves. And not just a few cherry picked scientists. We tested against a very large number of scientists.
-
Rob Honeycutt at 07:03 AM on 23 May 2013Skeptical Science Study Finds 97% Consensus on Human-Caused Global Warming in the Peer-Reviewed Literature
rhjames said... "Let's stick to scientific evidence."
You seem to be operating under the erroneous assumption that Cook13 is a survey of scientists (a "show of hands"). It is not. It is a survey of the published research.
It's entirely likely that there is research within the survey that reflects different positions on papers coming from any one scientist. A researcher that has published a large body of research could potentially have papers that fall into each of the 7 endorsement categories. Certainly most of the researchers who have multiple papers in the study have them falling into at least two or more of the categories.
So, really, the opinions of the scientists themselves matter little. What matters is what their data show.
-
John Russell at 07:00 AM on 23 May 2013A Rough Guide to the Jet Stream: what it is, how it works and how it is responding to enhanced Arctic warming
If anyone wants to keep track of the jet stream position over the N Atlantic/UK on a daily basis, I've found this site to be very useful.
Damn good article, by the way. I'll be coming back. Thanks for the hard work, John M.
-
Composer99 at 06:41 AM on 23 May 2013Skeptical Science Study Finds 97% Consensus on Human-Caused Global Warming in the Peer-Reviewed Literature
Claims identical to yours have been examined before and rightly dismissed, for three reasons.
First, most orthodox or consensus positions before the scientific revolutions in various disciplines were not based on anything like as rigorous the methodologies used to generate consensus positions in the sciences today, and are an inappropriate point of comparison. Who cares whether or not there was a consensus about bloodletting in the past? The consensus about AGW is comparable to the consensus of other contemporary scientific topics: quantum mechanics, relativity, and the like. (*)
Second, the consensus of experts follows from the preponderance (or, if you will, the consensus) of the evidence, a point that has been raised on several occasions on this thread and any other occasion where the scientific consensus has been discussed.
Third, research shows that the public perception of the scientific consensus is an important component of public advocacy for action to reduce emissions and mitigate global warming. So it is in fact critical, if we want to avoid the worst consequences of rapid global warming, to spread the word about the consensus.
(*) In point of fact I have a hard time thinking of any case where a scientific consensus, in the modern sense, of over 90% of scientists has arisen that has actually been overturned, with the possible exception of what caused gastric ulcers. In past cases either the consensus was non-scientific, or there was no consensus position to speak of.
-
Kevin C at 05:51 AM on 23 May 2013Has the rate of surface warming changed? 16 years revisited
It has been suggested that we leave the video up but add annotations to explain where the problems are. This would retain the educational content (and in practice probably enhance it, because learning often progresses through correcting wrong understanding).
But the big advantage is that everywhere the video has been embedded the annotations will now be visible.
However, John is pretty busy with at the moment, so it may take a week or two.
-
Kevin C at 05:47 AM on 23 May 2013Has the rate of surface warming changed? 16 years revisited
Keith: I wouldn't include ocean heat uptake in a fitting calculation, but it's the sort of effect you might detect more clearly having removed the other terms. In otherwords, a change in trend.Troy is working on doing this without using fitting methods, which means you don't have to assume the warming signal and thus gives you a much better basis for detecting changes in the warming signal.
-
Dumb Scientist at 05:26 AM on 23 May 2013Has the rate of surface warming changed? 16 years revisited
jdixon1980: The total energy content of the climate system needs to be stressed much in the media. I've been making this point since 2009, and many of my colleagues have made similar complaints. So I'm inclined to place the blame on the media rather than on scientists.
Imagine filling a measuring cup at a constant rate while the water sloshes around. Sometimes the water will pile up against the side of the cup that doesn’t have the measuring tick marks. As it piles up, the water level against the tick marks might go down even as the faucet pours water into the cup.
In this analogy, the water level in the cup is the Earth’s total energy and the constant water flow is the extra radiative power added by human emissions. The side of the cup with the tick marks is the Earth’s surface, where most of our temperature sensors are. The other side of the cup is the deep ocean, which we can’t measure as well as the surface.
Water sloshing towards the tickmarks is like a temporarily warm El Nino, while water sloshing away from the tickmarks is like a temporarily cool La Nina.
Humans add extra water to the cup, but it sloshes around the cup naturally.
Humans add extra energy to the Earth, but it sloshes around the Earth naturally.
-
John Hartz at 05:20 AM on 23 May 2013Skeptical Science Study Finds 97% Consensus on Human-Caused Global Warming in the Peer-Reviewed Literature
@Barry #189:
You state: I'm discussing the academic merit of the Cook et al study.
What exactly do you mean when you use the phrase, "academic merit"?
-
keithpickering at 04:32 AM on 23 May 2013Has the rate of surface warming changed? 16 years revisited
Is it really correct to include both ENSO and ocean heat uptake changes? Aren't these pretty close to measuring the same thing?
-
Dikran Marsupial at 04:15 AM on 23 May 2013The anthropogenic global warming rate: Is it steady for the last 100 years?
Dumb Scientists yes I agree, however we need to determine if the basic approach is mathematically sound before worrying too much about the details!
-
Miriam O'Brien (Sou) at 04:09 AM on 23 May 2013Has the rate of surface warming changed? 16 years revisited
Jdixon1980, is this what you are looking for?
-
Dikran Marsupial at 04:04 AM on 23 May 2013The anthropogenic global warming rate: Is it steady for the last 100 years? Part 2.
Prof. Tung I do not understand the point you are trying to make with this image.
Nobody should expect the observations to lie any closer to the ensemble mean than is indicated by the spread of the model runs (as I have stated before). Note that in 1998 the observations were closer to the (upper) boundary of the 95% than current observations are to the lower boundary. However the 1998 event was not evidence that the ensemble mean was not a good approximation of the forced response, so I see no reason to think that the current observation-ensemble mean difference is indication of a systematic issue, but is probably just internal variability. Of course we are also interested in the physics of internal variability.
The diagram I gave uses the model projections actually used in AR4 and uses the same baseline period that is used in making the projection. Do you agree that it shows that the observations are consistent with the model projection, yes or no? If "no" please explain what is defficient in the figure I presented here.
Note that the choice of baseline has a large effect on the apparent uncertainty of the observations and the models at the boundaries of the baseline period. I suspect this is the issue that James Annan mentions on the twitter thread. Compare the width of the model spread using the two different baseline periods
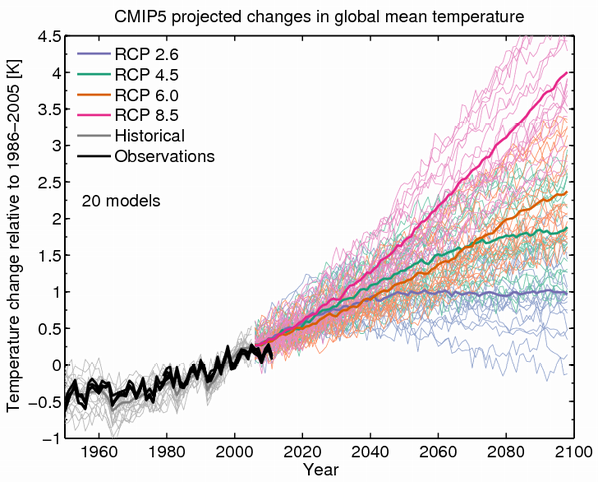

Note the observations are less close to the edge of the model spread if the longer baseline period is used, as the baselineing procedure minimises the differences between models in the baseline period. The longer the baseline period, the less this can over-fit the variability within the baseline period, so less of the model uncertainty is attenuated.
-
Rob Honeycutt at 04:00 AM on 23 May 2013It's satellite microwave transmissions
grindupBaker... But it would be the change in the Earth's climate system that matters to us tiny beings living on the planet's surface.
-
Dumb Scientist at 03:56 AM on 23 May 2013The anthropogenic global warming rate: Is it steady for the last 100 years?
Thanks Dikran! I have to rush off to a talk, but I wanted to nitpick: our CO2 emissions are rising faster than exponentially. Anthropogenic forcings might be rising quadratically...
-
KK Tung at 03:34 AM on 23 May 2013The anthropogenic global warming rate: Is it steady for the last 100 years? Part 2.
Still can't insert. But the figure can be found here.
https://twitter.com/ed_hawkins/status/299161479268139009
 Moderator Response:
[Dikran Marsupial] Image added, on my browser (Firefox) clicking over the image on the Twitter brings up a menu with an option to "view image", which loads the image in a new tab on the browser, which then gives a URL that you can use with the SkS image widget. I suspect other browsers have similar functionality but I only use Firefox myself. HTH
-
KK Tung at 03:33 AM on 23 May 2013The anthropogenic global warming rate: Is it steady for the last 100 years? Part 2.
I am still having problem inserting figures. I was able to insert a pdf but not a powerpoint figure previously on this site, but no more. I also don't have a server where I can host. SkS need to fix this problem.
I managed to find one figure, the one by Ed Hawkins, on his own twitter site. MA Roger's comment on the person who sourced Hawkins' figure is irrelevant. I thought it better to use a direct source and bypass the second quesssing of the motives of the person who sourced it.
Moderator Response:[Dikran Marsupial] I have sent an email suggesting an interim solution. I will raise this issue with the other SkS moderators. I don't think powperpoint images are directly supported by browsers, so perhaps converting it to png, jpg gif etc may resolve the problem.
-
KK Tung at 02:49 AM on 23 May 2013The anthropogenic global warming rate: Is it steady for the last 100 years? Part 2.
[image deleted]
Moderator Response:[Dikran Marsupial] I'm sorry Prof. Tung, SkS doesn't support uploading images to the site, only linking to images that are already hosted on other sites already. Perhaps the easiest approach would be to place them on your own webserver and then link to them here, or possibly use one of the photo sharing services, such as flikr (which is what I have to do for another blog to which I occasionally contribute). Specifically, the data for the image cannot be part of the URL.
-
Rob Honeycutt at 02:32 AM on 23 May 2013Skeptical Science Study Finds 97% Consensus on Human-Caused Global Warming in the Peer-Reviewed Literature
Jason said, "Next we'll be arguing what the meaning of "is" is!"
Exactly. At this point Cook et al 2013 is part of the published research on this matter. If there are people like Lucia and others who wish to challenge the findings, they should do so by the way of publishing their own paper.
They are more than welcome to craft their own methodology to test the level of consensus on AGW. But, like with the hockey stick, I think the results they would get would go against the conclusions they want to see, and to get the conclusions they'd prefer would require contortions that would not pass peer review.
-
grindupBaker at 01:51 AM on 23 May 2013It's satellite microwave transmissions
I only started looking at "Global Warmage" for science & math interest 3 months ago. I linked here from a 2013-05 post about revised AST processing. Oh boy. They have absolutely no concept whatsoever of the orders of magitude difference between the vast energy delivered non-stop to Earth by the sun & the trivial bits shoved around on Earth surface. Signs are that this inability to grasp simple quantity concepts is endemic among the public at large.
-
jdixon1980 at 01:49 AM on 23 May 2013Has the rate of surface warming changed? 16 years revisited
A helpful image could be somebody on an elevator going up while playing with a yo-yo - the height of the yo-yo goes up and down, and might be above or below the hand at any given time, but it's average height is increasing just as quickly as the average height of the hand.
-
jdixon1980 at 01:44 AM on 23 May 2013Has the rate of surface warming changed? 16 years revisited
DS @2: "As you say, the total energy content of the climate is a more direct measure of global warming."
One thing that bothers me about the way the warming trend is presented to the public in the MSM is that whatever is happening with surface temperatures is always the focus of the headline and the focus first several paragraphs, if not the entire article. If there is any mention of total climate energy content, it is usually buried in a later paragraph and not represented in a prominent figure, such that I would venture to guess that most casual media consumers skim over it, if they even get that far in the article before moving on to something more scintillating. A perfect example is the recent Economist article on climate sensitivity (http://www.economist.com/news/science-and-technology/21574461-climate-may-be-heating-up-less-response-greenhouse-gas-emissions), which, when it finally addresses ocean heat content about midway through the article, focuses on the top 700 m with an accompanying graph showing a flattening (but still positive) temperature trend, and only mentions the Balmaseda et al. study of trends in the total ocean temperature profile as an afterthought.
Do you think that climatologists need to do a better job of conveying the greater long term significance of total climate energy content (as opposed to surface temp fluctuations) to the MSM, so that the MSM might focus more on the significance of total climate energy?
Would it help to use more or better analogies of ocean heat content to something intuitive and mechanical, like Verner Suomi's famous "great and ponderous flywheel," but maybe not so lofty? What about the ocean heat content as a "hand" and surface temperatures as a "yo-yo," which can go up and down but is always tethered to and pulled back towards the hand?
-
JasonB at 01:38 AM on 23 May 2013Skeptical Science Study Finds 97% Consensus on Human-Caused Global Warming in the Peer-Reviewed Literature
barry,
I'm making no claim as to what the consensus statement is meant to be.
You said "there is no doubt that the consensus is that human activity is causing at least some global warming". Cook et al's results are far stronger than that, as I already explained.
I don't know how many times I can keep saying this; the original authors were asked whether their papers endorsed AGW. The results are being reported as the percentage of papers that endorse AGW. There is no discrepancy. What the general public wants to know is "is human activity causing global warming?". That's exactly the statement that the authors of 97.2% of the papers that expressed an opinion on the matter said their paper endorsed. QED.
Moderator Response:[JH] Be careful of excessive repitition.
-
Miriam O'Brien (Sou) at 00:19 AM on 23 May 2013Has the rate of surface warming changed? 16 years revisited
Kevin, I particularly like your animation of the possibly different effects of the volcanoes. I expect that each large-ish volcano can have different effects on climate to some extent, depending on what part of the world it erupts in, time of year etc. So that looking at other eruptions won't necessarily give an answer to what happened in any other case.
-
Miriam O'Brien (Sou) at 00:13 AM on 23 May 2013Has the rate of surface warming changed? 16 years revisited
@JohnRussell I wouldn't worry too much about what Bob Tisdale says. He's a one-trick pony just going on about ENSO jumping up and down and leaping and cavorting with 'natural' but completely unexplained magical warming (by Bob himself, that is). I've noticed many of the WUWT faithful don't put much credence on him these days. He's missed the main point that Kevin is making altogether in his haste to push his ENSO barrow.
I don't have a view one way or another on the video. I found it useful myself but didn't take it to be the last word on the subject (nothing ever is). Still, I'm happy to wait to see what new science comes out over coming months. Or for Bob T's El Nino - maybe next year? I wouldn't be surprised if it's a doozy when it comes.
I have to say articles like this are refreshing. It forces one to think about things more and realise that there is a lot to consider when it comes to what climate change will bring - and when.
-
Dikran Marsupial at 23:56 PM on 22 May 2013The anthropogenic global warming rate: Is it steady for the last 100 years?
I thought I would have a go at testing Prof. Tungs method via a simple thought experiment, where we can have ground truth. I've used MATLAB, so I'll add code snippets and diagrams as I go. I should however point out that it is possible that I have misunderstood the method, in which case hopefully setting things out very explicitly will help Prof. Tung to identify where i have gone wrong.
Lets assume that that anthropogenic emissions have been rising quadraticaly
anthro = 0.00002*(T + T.^2);
where T is time and goes from 1 to 150 years in the diagrams shown below. Rather than model ENSO, volcanic activity and solar forcing separately, for convenience, we can lump them all together as a single term "natural", and we will make it sinusoidal to keep things simple.
natural = 0.1*sin(2*pi*T/150);
For the sake of this thought experiment, I shall assume that AMO actually has no effect at all on global mean surface temperatures, so the observations are an equal combination of anthro and natural and some additive Gaussian noise
observations = anthro + natural + 0.1*randn(size(T));
Now lets assume that AMO is actually a consequence of anthropogenic and natural forcings/variability, so it is correllated with the observations, but only because the observations and AMO have shared causes.
AMO = 0.4*anthro + 0.6*natural;
Now this presents a stren test for Prof. Tung's method, but if his method is sound, it ought to still be able to deduce the correct anthropogenic forcing even in this case. If we plot everything, we get this:

Note I have set up my thought experiment, so the observations are vaguely similar to the actual observations.
The next step is to linearly detrend AMO, which can be easily achieved via linear regression:
X = [ones(size(T)), T];
beta = (X'*X)\X'*AMO;
AMOd = AMO - beta(2)*T;
Plotting the detrended AMO gives this:

Now linear detrending obviously does not remove the all of the effects of anthro from AMO as anthro is quadratic. Also if natural has a linear trend over the period considered, then that also will have an effect on the detrending.
We can now perform the regression analysis, where the means have been subtracted from the explanatory variables so that any offset in the observations are explained by the bias term, rather than using the explanatory variables.
X = [ones(size(T)) anthro-mean(anthro) natural-mean(natural) AMOd-mean(AMOd)];
beta = (X'*X)\X'*observations;We can look at the values of beta that we have extracted, and we find
beta = [0.1577; 0.6382; 0.1927; 1.1731]
Note that the regression model is using AMO to explain more of the variation in the observation than it uses anthro or natural, even though the observations are in no way causally dependent on AMO! The true set of regression parameters are:
beta = [0.1577; 1.0000; 1.0000;0.0000]
We know that by construction. This is a good illustration of why using regression methods for attribution is tricky. In this case, the problem is co-linearity. AMOd is correlated well with the observations, in face more so than anthro or natural are individually, and regression is a correlation based method.
We ccan then find the output of our regression model
model = X*beta;
and plot it, giving

So we can see that the regression model (blue) "explains" the observations (green) almost as well as the true model does.
The last step is to find the deduced anthropogenic forcing. My interpretation of Prof. Tungs explanation given in the post above is that we first find the residuals
residual = observations - model;
compute their least-squares trend
X = [ones(size(T)), T];
BETA = (X'*X)\X'*residual;and adding the trend in the residuals to the deduced anthro
infanthro = beta(2)*anthro + BETA(2)*T;
but if you do that, you get

where you can see that the deduced anthro is much less than the true anthro, which suggests that Prof. Tungs method is not reliable.
UPDATE: If we exactly deduct the anthropogenic influence on the AMO using
AMOd = AMO - 0.4*anthro;
then we get more or less the correct answer:

which suggests that the way in which the anthropogenic influence on the AMO is accounted for is very important, and linear detrending is unsatisfactory unless the anthropogenic forcing actually is linear.
I have also noticed that in both cases, the trend of the residuals is to all intents and purposes zero, so adding the trend of the residuals to a*anthro(t) as Prof. Tung suggests has only a negligible effect on the outcome.
Now I should stress, there are at least two possible explanations, either (a) Prof. Tung's method isn't reliable or (b) I have not propely understood or implemented Prof. Tungs method for my thought experiment. I try to be a self-skeptical sort of person, so I am assuming (b) is more likely. Hopefully Prof. Tung can point out the problem, providing MATLAB (or other) code for the thought experiment would be a really good way of getting his idea accross efficiently.
Moderator Response:[Dikran Marsupial] Oops, one error found already,
infanthro = beta(1)*anthro + BETA(2)*T;
should of course have been
infanthro = beta(2)*anthro + BETA(2)*T;
The penultimate figure has been updated to take this into account, sorry for the confusion.
-
barry1487 at 23:48 PM on 22 May 2013Skeptical Science Study Finds 97% Consensus on Human-Caused Global Warming in the Peer-Reviewed Literature
Jason,
I'm making no claim as to what the consensus statement is meant to be.
barry, the authors were asked to state whether or not their papers endorsed the proposition that human activity is causing global warming.
I agree. But if Authors rating at 2 and 3 (which comprise a huge bulk of the endorsement ratings) take that to mean anything between, say, 'some' influence and >50%, and Cook et al take it to mean >50%, then the rating criterion is different and this may signficantly affect the comparitive results.
Would I be correct in assuming you would say that options 2 and 3 rate the human influence on global warming as dominant (b)?
I'm hoping to garner clear responses to see if there are different interpretations by commenters here. Tom Curtis began as an author on Cook et al, but declined participation after a while. Judging by comments he has made at Lucia's he is saying that ratings 2 and 3 refer to >50% influence. Eg,
Lucia, excluding papers dealing with impacts and mitigation, 92.9% of papers surveyed (and that indicate a position in the abstract) implicitly or explicitly affirm that >50% of recent warming is due to anthropogenic causes.
http://rankexploits.com/musings/2013/on-the-consensus/#comment-113388
You write;
If they felt that their paper either implied or stated that human activity was a contributing factor but not the primary cause then they could have categorised their paper as level 5, 6, or 7, depending on how it was presented. (Remember, level 5 includes any proposition that something other than humans was the main cause, and level 7 includes any quantification less than 50%.)
Apart from 1 and 7, none of the ratings are quantified. The descriptors are "endorses" and "minimises" AGW. These are qualitative statements, and that was how I read them. That is also how Zeke Hausfather read them.
Categories 2 and 3 as well as 5 and 6 do not make any explicit assertion of attribution percent (e.g. they don’t assert < 50 percent, they simply don't provide enough information to imply a percent).
http://rankexploits.com/musings/2013/on-the-consensus/#comment-113263
That 2, 3, 5 and 6 relate to >/< 50% human contribution may be inferred in context, but other inference is also possible.
My point is, if reasonable people disagree on the ratings criterion (and the 2 I've cited are 'friendlies', there is yet more disagreement between other parties), then original Authors may have had different interpretations, and this may well undermine the comparitive results that are a strong corroborative feature of the paper. The similarity of results could be a fluke.
The only way to test that, that I can think of, is by asking the original Authors who rated their own papers what they assumed the criterion was for 2 and 3 (and 5 and 6).
If the point of the paper is to demonstrate there is a consensus that more GHGs in the atmosphere should cause some warming, then that is not as impactful as endorsing the IPCC statement. It's a much lower bar with a much smaller target audience. None of the contrarian climate scientsts dispute that, and neither do most prominent skeptics (including Anthony Watts, for example) and most of their followers.
The basic message is fine - and the effort has been successful on that regard. I'm discussing the academic merit of the Cook et al study.
-
KR at 23:46 PM on 22 May 2013Skeptical Science Study Finds 97% Consensus on Human-Caused Global Warming in the Peer-Reviewed Literature
barry - "And yet, KR, the ridiculous interpretation is how many reasonable people have taken 2 and 3."
Reasonable people? Perhaps... But many of the people raising this issue (this obfuscation, in my point of view) are not climate scientists, and are not as aware of the IPCC reports. Or at all fond of of the IPCC and its conclusions, for that matter (cf motivated reasoning).
"Can you explain why abstracts saying "human greenhouse gas emissions are causing global warming" means that they are, perforce, positing >50% human influence?"
As I pointed out above, because the category titles are part of the description as well, and because, quite frankly, anyone familiar with the science knows that AGW means human caused global warming:
Definitions of each level of endorsement of AGW.
- Explicit endorsement with quantification
- Explicit endorsement without quantification
- Implicit endorsement
-
Yvan Dutil at 23:13 PM on 22 May 2013Has the rate of surface warming changed? 16 years revisited
The key issue here as many of the linear decomposition is the potential hiden cross-talk between factor. Solar signal as at least some linear component in. Depending of the model, volcanic too. The same situation apply to any long period oscillation fitting used by skeptics.
Without physics statistical analysis are pretty limited tools. -
MikeArney3@aol.com at 22:33 PM on 22 May 2013Monckton Myth #11: Carbon Pricing Costs vs. Benefits
I guess this has been out there a while, but I think the sentence in the 3rd paragraph, "Here Monckton is implicitly assuming that the cost of preventing consequences will be less than or equal to the cost of adapting to consequences," should say, "greater than or equal". And I'd also take out the "implicitly", since he's pretty explicit about this (and very wrong, of course).
Thanks for all the great work you do on this site. I am very grateful for it.
-
rhjames at 22:25 PM on 22 May 2013Skeptical Science Study Finds 97% Consensus on Human-Caused Global Warming in the Peer-Reviewed Literature
Can we please stop talking about consensus. Science isn't about a show of hands. There used to be consensus that "bleeding" a patient solved most medical problems. So called consensus has proven to be wrong too many times in the past. Let's stick to scientific evidence.
-
John Russell at 21:47 PM on 22 May 2013Has the rate of surface warming changed? 16 years revisited
Pathetic. Bob Tisdale makes a meal out of SkS withdrawing the video and the reasons behind it. Does he not realise that a constant incremental adjustment to the consensus position is good science and how our knowledge actually advances? I guess not. A head-in-the-sand, entrenched denial of human-caused warming is much more comfortable.
-
JvD at 20:09 PM on 22 May 2013A Detailed Look at Renewable Baseload Energy
The fact that SkS *is* ignoring the cost question is clearly evidenced by the comments in this thread. It has taken a lot of discussion even to establish the fact that a WWS-only scenario is extremely difficult / extremely expensive. All this discussion would have been unnecessary if SkS would simply come out clearly and say: "WWS as a solution to climate change is extremely difficult/ extremely expensive." But SkS does not do this. On the contrary, according to SkS, a WWS-only scenario is called 'plausible'! In another article, SkS even goes so far as to seek to 'debunk the myth' that WWS cannot provide baseload!
So sure, you can look at snippets of SkS articles and tease-out citations and lines that in a round-about-way suggest that costs are 'not ignored', but surely you must agree that the basic conclusion of SkS is that WWS is or will be competitive with coal sooner rather than later. Which is a conclusion that flies utterly in the face of all major scientific institutions, which conclude that is will be extremely difficult / extremely costly.
If necessary, read back through the comments in this thread. Surely, you can see that most commenters are or have been under the impression (from reading SkS articles) that renewables can provide baseload with little or no problem and therefore that nuclear power is unnecessary or 'too expensive'. This is an absurd position to take, do you not agree?
-
MA Rodger at 19:48 PM on 22 May 2013The anthropogenic global warming rate: Is it steady for the last 100 years? Part 2.
Here is the Ed Hawkins graphic as sourced by the Daily Rail's David Rose (who is not the sort of person any self-respecting climatologists should associate with).

The AR4 projections are presented in fig 10.26 but also in fig SPM5 shown here. The shaded areas are 1sd. If you zoom really close in with your rulers (as I did), you will find the 2000 temperature sits at 0.241ºC with the 2012 central projection at 0.457ºC (1 sd +/- 0.18ºC) This would thus require a temperature drop (of 0.08ºC) below the 2000 level for the 2012 observed temperature to be below the AR4 model projection 95% range.

-
JasonB at 18:19 PM on 22 May 2013Skeptical Science Study Finds 97% Consensus on Human-Caused Global Warming in the Peer-Reviewed Literature
I've been playing with the search tool to tabulate the results; I managed to collect results for 11,942 papers using a space as the search term; that's two fewer than Cook et al. Curiously, I ended up with exactly one extra paper in levels 1-3, two fewer in level 4, and one missing in levels 5-7. Could have been a typo when I was entering the numbers into the spreadsheet, although I just double-checked level 4 and got exacly the same result.
Anyway, of interest to this discussion is the breakdown between papers that quantify the human contribution to global warming as >= 50% and papers that quantify the human contribution to global warming as < 50% (i.e. levels 1 and 7), since there is no interpretation required for those. The former represent 88% of all papers that quantify the human contribution to global warming (64 of 73). A small difference to the overall percentage, but the level of endorsement still overwhelming, and due to the relatively small sample size, a small difference is to be expected. (I would also not be surprised if papers purporting to refute the consensus would do so with quantification, so this group is perhaps more likely to include a higher percentage of contrarian papers.)
For the papers that make explicit statements about causation without quantification, those that explicitly state humans are causing global warming represent 98.4% of the total (923 of 938).
For the papers that imply the impact humans are having, those that imply humans are causing global warming represent 98.2% (2910 of 2963).
My figure for the overall endorsement percentage is 98.06%. Not sure why the paper gives a lower figure.
In any case, no matter how the results are spun, or words are interpreted, it is pretty clear that the literature falls heavily on one side. I think anybody who seriously wants to challenge the results really needs to show papers that were mis-categorised; all the abstracts are available together with the category that was applied, so nothing is hidden, and if someone wants to apply their own "interpretation" to the rating system they have the means to do so.
Perhaps, to make the problem more tractable, they could start by checking for papers that they know disagree with the consensus and make sure those show up in the right place.
-
JvD at 17:56 PM on 22 May 2013A Detailed Look at Renewable Baseload Energy
"In Part II of the study, J&D examine the variability of WWS energy, and the costs of their proposal. J&D project that when accounting for the costs associated with air pollution and climate change, all the WWS technologies they consider will be cheaper than conventional energy sources (including coal) by 2020 or 2030, and in fact onshore wind is already cheaper."
This is coded language which is actually saying that renewables will remain far more expensive than coal. There are many variables here: the price of coal in 2020 and 2030, and the cost of air pullution and climate change in 2020 and 2030. The authors assume great costs for these elements, which is how they arrive at the conclusion that WWS will be 'cheaper'. The elephant in the room is whether coal will really be more expensive in 10 or 20 years time, and more importantly: whether the external cost of climate change and air pollution will ever be internalised (requiring new international lawmaking).
In a way, J&D are saying: "if we get a global tax on carbon and air pollution, then WWS will be cheaper than coal".
But what if we never get such a global agreement? That is my point. 30 decades of complete failure on establiishing global climate and air pollution regulations could very well be followed by another 30 years of failure. Why should we take that risk? Why not use an energy source that is cheaper and more abundant and far cleaner than fossil fuels? That is the question SkS needs to answer. But rather than doing that, SkS is suggesting that replacement of fossils with WWS is 'plausible'. The message to the reader is: "Don't worry. WWS will (through international agreements on putting a price on air pollution and cliamte change) be competitive with fossils in time to stop climate change and air pollution (so we don't need nuclear power)".
-
JasonB at 17:21 PM on 22 May 2013Skeptical Science Study Finds 97% Consensus on Human-Caused Global Warming in the Peer-Reviewed Literature
Next we'll be arguing what the meaning of "is" is!
barry, the authors were asked to state whether or not their papers endorsed the proposition that human activity is causing global warming. If they felt that their paper either implied or stated that human activity was a contributing factor but not the primary cause then they could have categorised their paper as level 5, 6, or 7, depending on how it was presented. (Remember, level 5 includes any proposition that something other than humans was the main cause, and level 7 includes any quantification less than 50%.)
I said that the statement Cook et al were testing was very strong, so let's look at what you claim the "consensus" is: "that human activity is causing at least some global warming". Papers classified by Cook et al as levels 1-3 would obviously also agree with your claim. But so would papers classified by Cook et al as level 5, some of the papers classified by Cook et al as level 6, and any of the papers classified by Cook et al as level 7 that had a percentage greater than 0.
In other words, the only papers that Cook et al counted as rejecting their proposition that you would also claim reject your rendition of the consensus are those in level 6 that explicitly reject that humans are causing global warming and those in level 7 that state humans are causing 0% or less of global warming.
Clearly, Cook et al's statement is a lot stronger than yours, as it filters out many possible papers that you would consider endorsing your consensus. I would guess that very close to 100% of the papers would pass your test.
Finally, to point out that the authors of the original papers, when asked if their papers endorsed the claim that human activity is causing global warming, resulted in the same percentage of endorsement as Cook et al did by examing the abstracts alone, is not "post-hoc reasoning", it's evidence that the same criteria were applied, because it would be absolutely staggering for both groups to have arrived at the same percentage by coincidence, especially when the original authors added a large number of extra papers to the mix that Cook et al were forced to assess as "neutral" based on the abstracts alone.
It also means that the abstract examination process provided an unbiased estimate of what the full paper would actually say.
-
barry1487 at 16:18 PM on 22 May 2013Skeptical Science Study Finds 97% Consensus on Human-Caused Global Warming in the Peer-Reviewed Literature
If Zeke was here, I think he'd say c) and/or d).
What do others think?
-
barry1487 at 16:14 PM on 22 May 2013Skeptical Science Study Finds 97% Consensus on Human-Caused Global Warming in the Peer-Reviewed Literature
To clarify, c) - significant influence - was what I took to be the criterion for rating options 2 and 3 when I participated in the public survey.
But another person might have rated those with a lower (d) or higher (a,b) bar.
Lack of clear definitions is a problem for the paper as I've argued upthread.
-
barry1487 at 16:03 PM on 22 May 2013Skeptical Science Study Finds 97% Consensus on Human-Caused Global Warming in the Peer-Reviewed Literature
Jason, I'll point out again that the match could still be a coincidence if the Authors interpretation of the ratings system for their papers, was different than Cook et al for the abstracts to those papers. Post hoc reasoning is not acceptable.
You ask,...the graphic makes the statement that "97% of climate papers stating a position on human-caused global warming agree global warming is happening and [A] we are the cause".
How can you argue that a paper that says exactly the same thing — that [B] human greenhouse gas emissions are causing global warming — should not be categorised as endorsing that position?
[A] implies human influence as the dominant - in fact the ONLY cause.
[B] can be taken to mean that anthro influence is a contributing factor, but not necessarily dominant
They are different.
Whatever interpretation is taken, there is no doubt that the consensus is that human activity is causing at least some global warming.
If the consensus statement being tested by 1, 2 and 3 (and the rest) is meant to be whether human contribution is >50%, then I think the results are flawed, as this proposition is not explicit enough in the consensus statement emailed to Authros, and the rating system. It is also confusing in the paper, but I now strongly believe that this was indeed, the intention of Cook et al. (Why are they not commenting here?)
Perhaps participants here could select which of these statements is most accurate.
"97% of climate papers stating a position on human-caused global warming agree that human influence on global warming over the last 50 years is...
a) >50%
b) dominant
c) significant
d) a contributing factor
I think either of those are valid for rating options 2 and 3, depending on how the email is interpreted.
My own take doing the (public) survey was c).
-
JasonB at 15:37 PM on 22 May 2013Skeptical Science Study Finds 97% Consensus on Human-Caused Global Warming in the Peer-Reviewed Literature
barry,
Can you explain why abstracts saying "human greenhouse gas emissions are causing global warming" means that they are, perforce, positing >50% human influence? The quote I've just given is from Dana, one of the authors of Cook et al, and that unquantified statement was suffcient for the abstract to be rated as endorsing.
Because the hypothetical abstract says that human greenhouse gas emissions are causing global warming? Just because the statement omits a number doesn't mean it isn't endorsing the proposition, which didn't include a number anyway.
As I've already pointed out, the graphic makes the statement that "97% of climate papers stating a position on human-caused global warming agree global warming is happening and we are the cause". How can you argue that a paper that says exactly the same thing — that human greenhouse gas emissions are causing global warming — should not be categorised as endorsing that position?
And again, I'll point out that the original authors, given the explicit request to state whether their paper endorses the proposition, rejects the proposition, or doesn't address it, gave the same percentage of endorsements and rejections as Cook's team did, even while finding that many papers that Cook's team relegated to "neutral" on reading the abstracts alone actually did make a statement when the whole paper was taking into account.
-
JasonB at 15:13 PM on 22 May 2013Skeptical Science Study Finds 97% Consensus on Human-Caused Global Warming in the Peer-Reviewed Literature
barry,
Let's consider the original authors' ratings for the moment.
The authors were sent an email. That email quite clearly said, as you have already quoted yourself, "The second drop down indicates the level of endorsement for the proposition that human activity (i.e., anthropogenic greenhouse gases) is causing global warming (e.g. the increase in temperature)." They are not being asked to quantify the human contribution, nor state their certainty of the human contribution, but merely to say whether their paper endorses that proposition, rejects that proposition, or doesn't address or mention the issue of what's causing global warming. The very next statement says "we are not asking about your personal opinion but whether each specific paper endorses or rejects (whether explicitly or implicitly) that humans cause global warming". Then the seven "levels" are stated, and, sure enough, the only difference between 1, 2, and 3 is the manner in which that endorsement is manifested in the paper (i.e. implicitly or explicitly, and if explicit, with or without quantification), and the only difference between 5, 6, and 7 is the manner in which that rejection is manifested in the paper, in exactly the same way as the endorsement case.
Note, for example, that a paper classified as "level 1" could easily be less "alarmist" than a paper classified as "level 2" or "level 3". A level 1 paper is likely to be an attribution study whereas a "level 3" could be an impacts study and, as such, could well be far more alarming.
As I mentioned in an earlier comment, someone else at Lucia's managed to confuse the levels with a measure of climate sensitivity, which is nonsense. There is only one proposition being put, and that is whether humans are causing global warming or not.
Note that it's really quite a strong statement as well. There's no wriggle room here. If someone wrote a paper that accepts that greenhouse gasses cause global warming, and that humans are responsible for GHG emissions, but that e.g. natural variability had a larger role to play in the warming to date than humanity, their paper would be classified as rejecting the proposition.
Now for Cook et al. In the introduction to the paper they clearly state that
We examined a large sample of the scientific literature on global CC, published over a 21 year period, in order to determine the level of scientific consensus that human activity is very likely causing most of the current GW (anthropogenic global warming, or AGW).
This is simply a restatement of the IPCC consensus statement, quoted by KR, and it doesn't matter if other restatements of it elsewhere in the paper are less precise because this is the proposition they are evaluating.
"Most" translates into "> 50%" when expressed numerically and answers your question:
It can be argued that 'primary cause' or 'dominant cause' of global warming could mean as little as 33%, if other contributing factors are each not greater than 33%. Is this what 2 and 3 refer to?
No. If a paper quantified the human contribution to global warming at 33% then regardless of other contributing factors it quite clearly would have been categorised as "level 7": "paper explicitly states that humans are causing less than half of global warming".
There is no room for interpretation here. Level 1's "Explicitly states that humans are the primary cause of recent global warming" has to be read in the context of Level 7's "Explicitly states that humans are causing less than half of global warming", which rules out any possibility other than ">= 50%" for Level 1.
Likewise, levels 2 and 3 are symmetric with levels 6 and 5, respectively.
-
barry1487 at 14:47 PM on 22 May 2013Skeptical Science Study Finds 97% Consensus on Human-Caused Global Warming in the Peer-Reviewed Literature
And yet, KR, the ridiculous interpretation is how many reasonable people have taken 2 and 3.
Can you explain why abstracts saying "human greenhouse gas emissions are causing global warming" means that they are, perforce, positing >50% human influence? The quote I've just given is from Dana, one of the authors of Cook et al, and that unquantified statement was suffcient for the abstract to be rated as endorsing.
(the quote is linked a few posts upthread)
-
KR at 13:44 PM on 22 May 2013Skeptical Science Study Finds 97% Consensus on Human-Caused Global Warming in the Peer-Reviewed Literature
barry - In 2001 the IPCC consensus states that:
In the light of new evidence and taking into account the remaining uncertainties, most of the observed warming over the last 50 years is likely to have been due to the increase in greenhouse gas concentrations.
In 2007, the IPCC stated:
From new estimates of the combined anthropogenic forcing due to greenhouse gases, aerosols and land surface changes, it is extremely likely that human activities have exerted a substantial net warming influence on climate since 1750.
Greenhouse gas forcing has very likely caused most of the observed global warming over the last 50 years. Greenhouse gas forcing alone during the past half century would likely have resulted in greater than the observed warming if there had not been an offsetting cooling effect from aerosol and other forcings.
It is extremely unlikely (<5%) that the global pattern of warming during the past half century can be explained without external forcing, and very unlikely that it is due to known natural external causes alone. The warming occurred in both the ocean and the atmosphere and took place at a time when natural external forcing factors would likely have produced cooling.
Given that as the widely understood "consensus", I find claims of categories 2 and 3 not supporting a majority factor for human causes to be simply ridiculous.
-
barry1487 at 13:30 PM on 22 May 2013Skeptical Science Study Finds 97% Consensus on Human-Caused Global Warming in the Peer-Reviewed Literature
Jason, Dana said:
Our basis was the IPCC statement that humans have caused most global warming since the mid-20th century.
If that was the basis (and you, argue that ratings 5, 6 and 7 should be viewed as rejection of AGW at >50%, implying, in a symmetrical ratings scheme, that 1, 2 and 3 are endorsement at>50% (implied or explicit)), then I don't see much wriggle room.
Can you clearly state in a sentence, if you think ratings 2 and 3 refer to an endorsement at >50% level, or only that anthropogenic warming is signficant in a qualitative sense. Just something clear and simple.
It would be good to have clear statements from others. I'm pretty sure Tom Curits was arguing that 2 and 3 are >50% endorsements.
If you read the introduction to Cook et al, this is one statement of consensus:
We examined a large sample of the scientific literature on global CC, published over a 21 year period, in order to determine the level of scientific consensus that human activity is very likely causing most of the current GW (anthropogenic global warming, or AGW).
It is confusing in the paper, as other statements on what the consensus is are less exact, as in the abstract.
It is confusing in discussions about it because there is little agreement on what the ratings reflect. This disagreement does not fall on ideological lines (regulars at Lucia's are arguing about them, too).
The problem is that the definitions are unclear and open to misinterpretation. It doesn't matter that results are so similar if there is ambiguity in the methodology. Indeed, if Cook et al have a unified understanding that is different to interpretations made by original Authors, then that is a problem, weakening a number of key points in the study, namely to do with corroborating the impartiality/conservatism of Cook et al. The close matchup of results may be a result of these extraneous factors due to the ambiguity of definitions in the ratings schema.
It can be argued that 'primary cause' or 'dominant cause' of global warming could mean as little as 33%, if other contributing factors are each not greater than 33%. Is this what 2 and 3 refer to?
It's simply unclear. I'd like to know in simple terms how others view the ratings. When I took the survey, I only applied >50% to 1 and 7, and the rest were qualitative. If Cook et al rated all but option 4 as an endorsement/rejection at 50% human contribution, then they rated differently to me, and possibly to many of the responding Authors.
-
JasonB at 11:56 AM on 22 May 2013Skeptical Science Study Finds 97% Consensus on Human-Caused Global Warming in the Peer-Reviewed Literature
barry,
I think you (and others I saw at the earlier link you posted) are getting hung up on the "> 50%" figure, when that is not the outcome of the survey, it was a tool for categorising a certain subset of papers.
The title of this post says:
Skeptical Science Study Finds 97% Consensus on Human-Caused Global Warming in the Peer-Reviewed Literature
The first sentence is:
A new survey of over 12,000 peer-reviewed climate science papers by our citizen science team at Skeptical Science has found a 97% consensus among papers taking a position on the cause of global warming in the peer-reviewed literature that humans are responsible.
The graphic says:
97% of climate papers stating a position on human-caused global warming agree global warming is happening and we are the cause.
The email sent to authors asked them to state whether their paper endorsed the proposition:
that human activity is causing global warming
Every one of them is consistent. Not one of them mentions the >50% figure. Why? Because the point of the exercise is whether global warming is happening and we are the cause.
The only reason categories 1 and 7 exist is because some papers actually quantify the various causes, and so in papers that quantify the human contribution, the rule was > 50% counts as an "endorse" while < 50% counts as a "reject". That's all.
If the graphic said "97% of climate papers state that humans are responsible for > 50% of global warming" then you'd have a point, but it doesn't. As I said, the numbers 1..7 are not meant to be interpreted as a confidence levels, or degrees of agreement with the proposition, but merely to categorise the manner in which the agreement or rejection was expressed in the paper. The fact that the authors of 97.2% of the papers that stated a position claimed that their paper agreed with the proposition and the reviewers of the abstracts found that 97.1% of those that stated a position agreed with the proposition is very strong evidence to me that they used the same interpretation.
I don't agree that this should be seen merely as a matter of opinion or interpretation. The email is very clear. The paper is also very clear. The only thing I would change is the word "level" rather than "category" since that is apparently confusing some people.
Dana's comment is also saying the same thing.
Prev 893 894 895 896 897 898 899 900 901 902 903 904 905 906 907 908 Next


