


 Arguments


Recent Comments
Prev 895 896 897 898 899 900 901 902 903 904 905 906 907 908 909 910 Next
Comments 45101 to 45150:
-
MA Rodger at 20:21 PM on 23 May 2013The anthropogenic global warming rate: Is it steady for the last 100 years? Part 2.
KK Tung @97.
The thesis we discuss (Tung & Zhou 2013) specifically addresses multidecadal episodes of warming and cooling. This "hiatus period" you now discuss has been evident within the temperature record for less than a decade. Given the present short duration of this "hiatus period," given the many other points presented within Tung & Zhou 2013, is it helpful to our discussion to introduce yet another topic into this discussion? Indeed, why is the "hiatus period" relevant?
So far the two posts on this thesis have encompassed (1a) The shape of the net anthorpogenic forcing profile. (1b) Sea ice as a driver of AMO, (2a) AMO in climate models. (2b) AMOC evidence. (2c) Pre-industrial AMO data. (2d) Remnant anthropogenic signal in AMO. (2e) Using AMO as a "forcing."
So far, most of these topics remain poorly addressed, if addressed at all. I would suggest adding a fresh item to this discussion (ie introducing the "hiatus period" ) which does not appear entirely relevant is the opposite of what we should be attempting. -
Dikran Marsupial at 19:45 PM on 23 May 2013The anthropogenic global warming rate: Is it steady for the last 100 years?
As an update to my previous post on Prof Tung's method, I've now investigated quadratically detrending the AMO signal to remove the anthropogenic influence, using:
X = [ones(size(T)) T T.^2];
beta = (X'*X)\X'*AMO;
AMOd = AMO - X*beta;This doesn't work either, but this time it over-estimates the anthropogenic forcing, although the error is smaller than for the linear detrending.

The reason this doesn't work either is both subtle and interesting. Ideally the detrending would eliminate the quadratic anthropogenic component leaving only the sinisoidal natural component. However, the sinusoidal component has a linear trend, being positive in the first half of the time series and negative in the second. So when we quadratically detrend the raw AMO signal, we can erase both the anthropogenic component AND the linear component of the natural signal. However the linear component of the natural signal slopes downward and that of the anthropogenic signal upward, so this cancels out to a degree, and the resulting quadratically detrended AMO signal has an upward linear trend.

We defined the synthetic AMO signal as
AMO = 0.4*anthro + 0.6*natural;
so if we exactly remove the anthropogenic component, the correctly detrended AMO signal is just 0.6*natural (blue). However if we use simple quadratic detrending, we get the AMOd signal shown in red. The green line just shows the difference between the two.
The problem is now that the component shown in green is correllated with the anthropogenic component of the observations, so a quadratically detrended AMO still acts as a proxy or alias for BOTH the natural and anthropogenic components of the observations, which means that you can't use this method for attribution either.
The bottom line is that it seems that Prof. Tung's method only gives the correct answer if the anthropogenic component is exactly removed from the AMO signal before performing the regression. Adding the trend of the residuals does not solve this problem. Of course we can only exactly remove the anthropogenic component from AMO if we already know what it is, so using this method to estimate the anthropogenic component of the observations does require circular reasoning... provided I have not misunderstood the method, of course! -
johncl at 18:40 PM on 23 May 2013On the value of consensus in climate communication
I do believe the main problem for many now is not to accept that there is global warming happening, but that its caused by humans - as it implies that they are themselves guilty of it. Also, its very easy for people to put blame to others even if they believe humans are the cause of it. "Its the Chinese and all their coal plants!". So here in Norway there is constantly comments from people about e.g. electrical cars being bad because they are fueled by coal electricity - even though Norway has 99% of its electricity from hydro power. The general idea is that, if its not good for the general average over the whole globe, its not good for us as well. But this idea is rather silly in my opinion, and in most cases its rather impossible to change peoples view on this since its so securely rooted in the trandition of the fossil fuel car being the best choice. It doesnt help that Norway also gets its current wealth from oil as well.
The same odd argument is also used against building more windmills in Norway, because we already have enough hydro power. So its indeed like a snake biting its own tail, as many people seem to be unable to have more than one thought in their heads at one time. I do believe the more you are able to see things in a wider perspective your views will slowly creep towards more liberal viewpoints and are able to see the bad things about free market policies and the effect of e.g. globalism. Also there is general disconnect from nature in the way that we treat consumables as things that magically appears in the shelves. In general people need to be educated about the carbon footprint of anything we buy, almost to the point where every good has a carbon footprint estimate printed on its label. But with e.g. the clothes industry not even wanting to inform the public about which factories their goods are made in - its clear that the "truth" of globalism is one they would rather be kept secret since its generally bad publicity the moment another building collapses or is known for using child labour. So we need education of the masses that every choice we make in consumption is also a moral choice about the implication of globalism, its carbon footprint and human suffering that results from it.
I am very thankful that John Cook and SkeptialScience is keeping up with spreading the message and I was very happy to see the consensus research even presented in mainstream media here in Norway as well. The discussions in the comment fields were just littered with "AGW is BS" and all kind of denial ofc. But those comment fields are also a place were we should be active and promote real science information and preferably with links to sources, which is one the denialsphere often lacks as its generally based on feelings and not facts. Unfortunately when they do seek "facts" for themselves they very easily end up on WUWT and other denial sites because it seems they have been able to flood the search databases with classical spam link methods for getting high on the search results. Its easy to see this if you search for "global temperature" for images and see where those images lead to. So its indeed an information battle going on here to get real information. Good transparent research like this consensus project is definitely what we need more of.
To quote a song by Peter Gabriel: "Turn up the signal, wipe out the noise!".
-
Chris8616 at 18:27 PM on 23 May 2013A Rough Guide to the Jet Stream: what it is, how it works and how it is responding to enhanced Arctic warming
A link between reduced Barents-Kara sea ice and cold winter extremes over northern continents
The recent overall Northern Hemisphere warming was accompanied by several severe northern continental winters, as for example, extremely cold winter 2005–2006 in Europe and northern Asia. Here we show that anomalous decrease of wintertime sea ice concentration in the Barents-Kara (B-K) seas could bring about extreme cold events like winter 2005–2006. Our simulations with the ECHAM5 general circulation model demonstrate that lower-troposphere heating over the B-K seas in the Eastern Arctic caused by the sea ice reduction may result in strong anticyclonic anomaly over the Polar Ocean and anomalous easterly advection over northern continents. This causes a continental-scale winter cooling reaching −1.5°C, with more than 3 times increased probability of cold winter extremes over large areas including Europe. Our results imply that several recent severe winters do not conflict the global warming picture but rather supplement it, being in qualitative agreement with the simulated large-scale atmospheric circulation realignment. Furthermore, our results suggest that high-latitude atmospheric circulation response to the B-K sea ice decrease is highly nonlinear and characterized by transition from anomalous cyclonic circulation to anticyclonic one and then back again to cyclonic type of circulation as the B-K sea ice concentration gradually reduces from 100% to ice free conditions. We present a conceptual model that may explain the nonlinear local atmospheric response in the B-K seas region by counter play between convection over the surface heat source and baroclinic effect due to modified temperature gradients in the vicinity of the heating area. Link to Source This study was submitted Nov. 2009.
Keywords:
Arctic sea ice;atmospheric circulation;nonlinear dynamics -
Chris8616 at 18:24 PM on 23 May 2013A Rough Guide to the Jet Stream: what it is, how it works and how it is responding to enhanced Arctic warming
NAO
Timeseries of the winter (December to March average) of the Jones et al. NAO index, updated to the winter of 2011/12. Note the upward trend from the 1960s to the early 1990s, but also that the trend has not been sustained and has significant year-to-year variability superimposed on it. Note also that the winter 2009/10 had the most negative NAO index measured during the almost 190-year record.

Another pathway for temperature chaneg in the northern polar region is freshwater flux from increased thaw in the siberian region, which changed the Arctic curretn setup NASA video arctic ocean current Though freshwater can isolate sea ice
A new wind regime is another change in the nothern hemispheric aquatic environment, which is ratehr chaotic i guess. The new winds will cause coastel erosion and there seems to be an uptake in more intense storms in the arctic, which happen to break up sea ice chunks of the size 1300 km length (happened a few days ago and in Februar similar).

.
"As we lose all the summer ice, the response in the fall may plateau somewhat (although Arctic Amplification will continue via the other factors), but as ice in the other seasons declines, we should see the response become stronger all year long"
Maybe we get kind of permanent blocking pattern, without the ice.
-
Chris8616 at 17:53 PM on 23 May 2013A Rough Guide to the Jet Stream: what it is, how it works and how it is responding to enhanced Arctic warming
Polar jet stream, is maybe a bit confusing sicne the southern antarctic oscillation is also a polar jet stream?Polar air intrusion during the winter because of the higher jet stream amplitude. The UK will likely expereince much more pronounced floods, with Jet Stream blocking patterns, when the rain system just keeps sitting there.What about downward bursts/microburst? Greenland is according to Jennifer Francis a prime spot for blocking patterns to occur, see Sandy - caused 90 degree turn.Where exactly is the Jet Stream, if not with the Jetstreaks? Are these visible from the ground - do they come with clouds or is this different?In regards to tornadoes and Jet Stream:“As with hurricanes, I think frequency needs to be separated from intensity.Climate change increases the available energy for tornadoes through a warmer and moister atmosphere. Wind shear decreases in the global mean, but this might be irrelevant locally when the jet stream dives southward like it did last weekend across the Plains.“I believe there is evidence that the strongest tornadoes are getting stronger. They are certainly getting longer and wider.” - James B. Elsner, an atmospheric scientist at Florida State University Humid air and the Jet Stream help to fuel more intense thunderstorms/tornadoes -
s_gordon_b at 15:04 PM on 23 May 2013Skeptical Science Study Finds 97% Consensus on Human-Caused Global Warming in the Peer-Reviewed Literature
I'm having a problem interpreting this study. The banner conclusion is that "among abstracts expressing a position on AGW, 97.1% endorsed the consensus position that humans are causing global warming." But in the Results section it states: "To simplify the analysis, ratings were consolidated into three groups: endorsements (including implicit and explicit; categories 1–3 in table 2)..." This is where I'm experiencing a disconnect. Categories 2 and 3 are too ambiguous - as defined in table 2 - to equate to the consensus that humans are not only a cause of industrial era global warming but the dominant cause since the middle of the last century (at least). Am I not reading that right? And if so, shouldn't only those abstracts that take an unambiguous stand on the consensus of dominant human causation be counted and the others excluded in the same way that abstracts that take no stand at all were excluded?
-
scaddenp at 13:51 PM on 23 May 2013The anthropogenic global warming rate: Is it steady for the last 100 years? Part 2.
I think this confounds physical and statistical modelling but I will look at the paper. The success of more recent techniques (like F&R) would strongly suggest that this paper is mistaken. The indices might be an imperfect measure of the large scale process, but they are good enough for predicting unforced variation in global temperature due to ENSO.
-
DSL at 13:48 PM on 23 May 2013On the value of consensus in climate communication
I don't have much to say. Kahan's points are fair, but they're also academic. No actual model for communication is given, other than a link to a page that has, near the bottom, something useful--the ambivalent partisan approach or mode. Cook makes good points as well, but he's responding to a game being played behind the curtain, one that Kahan never really addresses. Indeed, that game should be fully recognized in any strategy for moving the public on this issue. The other players are trained in rhetoric and have absolutely nothing to lose. It's as if they play the game with a full deck and science is limited to no face cards (and aces count as 1).
Detailed, practical approaches need to be available to anyone who is willing to enter "the trenches." The "ambivalent partisan" mode is one I try to emulate, with a few additions. More powerful than ideology is the need to remain valuable, and that need is amplified when the discussion is public. No one wants to be dismissed out of hand--to be categorized, labeled, boxed, stamped as innocuous. I will only once in a blue moon use any sort of label, including "denier," when I speak with people in a general public forum on this issue. I ask questions, and not questions that have a rhetorical edge, but well-explained questions that invite the interlocutor to express a speculative opinion. No ivory tower. I try to give uncertainty when it exists. It's better to provide and discuss uncertainty than it is to leave it out. Tom Curtis is very good at that, and I think to the consternation of a few other SkS regulars. Also, as Kahan points out with the example of Hayhoe (though he gums it up with academic jargon), it's better to step into someone's else's castle and recognize it as a valid construct than it is to remain in your own castle and stand at the battlement throwing taunts and unexplained bits of heavy science. I've had good success with this general approach (a variety of private FB messages/emails thanking me not for explaining things but for doing it in a way that wasn't antagonistic. I often get the "I'll respond to you because you seem like a reasonable person." That's the response I aim for.).Ultimately, the Cook study is only valuable to me as a conversation starter and a casual debunking of the "there is no consensus" myth. I think Kahan doesn't understand that there are a great many people who don't understand the greenhouse effect and who are susceptible to suggestions that AGW is something different than the greenhouse effect. That's really what the consensus is all about for me as I find myself discussing it in various places. People aren't sure what points of the theory the consensus is providing agreement on, and so they respond to it as they do to every other article talking about global warming. In other words, the consensus doesn't mean anything specific. It's like how the word "catastrophic" is used in professional "skeptic" circles--it means whatever you need it to mean at the moment.
A bit rambling. Sorry. I started out with my two cents and it turned into a pfennig, a pence, and half a yen (to revise it).
-
jmorpuss at 11:40 AM on 23 May 2013A Rough Guide to the Jet Stream: what it is, how it works and how it is responding to enhanced Arctic warming
Nice John
One thing I thought might add more understanding to your post would be to include some sort of acknowladgement and recognition for this natural interaction process. http://en.wikipedia.org/wiki/Electric_force I tried a site search but could not find any reference to Coulomb's Law so link is provided.
-
MS1 at 10:30 AM on 23 May 2013The anthropogenic global warming rate: Is it steady for the last 100 years? Part 2.
#46 scaddenp at 08:54 AM on 17 May, 2013
"MS1 "I think their paper failed " really?... If the ENSO index was substantially flawed or there was significant non-linearity, this isnt born out by the success of their prediction. If you believe that the prediction can be improved significantly by other indexes or method, then show us."
---------------------
Compo et al 2010 have addressed this issue.
http://www.esrl.noaa.gov/psd/people/gilbert.p.compo/CompoSardeshmukh2008b.pdf
"Because its [ENSO's] spectrum has a long low frequency tail, fluctuations in the timing, number and amplitude of individual El Nino and La Nina events, within, say, 50-yr intervals can give rise to substantial 50-yr trends..."
"...it also accountd for an appreciable fraction of the total warming trend..." (see figure 9b )
"...It [The Pacific decadal oscillation or the interdecadal Pacific oscillation] is strongly reminiscent of the low-frequency tail of ENSO and has, indeed been argued to be such in previous studies (e.g. Alexander et al 2002, Newman et al 2003, Schneider and Cornuelle 2005, Alexander et al 2008)..."
"...In this paper, we have argued that identifying and removing ENSO-related variations by performing regressions on any single ENSO index can be problematic. We stressed that ENSO is best viewed not as a number but as an evolving dynamical process for this purpose..."
-
Dumb Scientist at 10:26 AM on 23 May 2013Has the rate of surface warming changed? 16 years revisited
Farmer Dave @24: Last year I noted that the deep ocean's heat capacity is much larger than the cryosphere's. So I think Kevin C was right to focus on the warming deep ocean purely on thermodynamic grounds.
I mentioned melting land and sea ice not because of their total effect on surface temperatures, but because those independent measurements also confirm that the climate is still gaining heat, even over the last 16 years. Here are relevant links and a short movie.
-
JasonB at 09:50 AM on 23 May 2013Skeptical Science Study Finds 97% Consensus on Human-Caused Global Warming in the Peer-Reviewed Literature
barry,
Rather than going round and round in circles arguing over definitions, let's make this concrete:
Earlier you claimed that there is a difference in meaning between the wording in the graphic and the wording in Dana's example of a paper that would be classified as endorsing the consensus ("we are the cause" vs "we are causing").
I propose a test: Can you give any examples of abstracts that were rated as level 2 or level 3 that you feel do not endorse the statement in the graphic?
If your argument is correct, there should be papers that you feel do not support the claim and based on the number of them we can ascertain the impact that would have on the results.
Note that unless you're going to do an exhaustive search, you need to count how many papers you looked at as well as how many examples you found. This is so we can get a percentage that can be used to estimate the impact. You can also propose what you view as the "correct" classification for the examples you find.
Until then, this argument is merely academic.
-
william5331 at 09:47 AM on 23 May 2013Has the rate of surface warming changed? 16 years revisited
Being completely unscientific and speaking anthropogenically, Gaia is fighting back and keeping the temperature constant. A sort of light switch phenomenon. Look out when we have pushed the switch beyone Gaia's capacity to thermo-regulate. The next time we have an El Nino should be interesting. Sept 15, 2016 likewise.
-
Farmer Dave at 09:32 AM on 23 May 2013Has the rate of surface warming changed? 16 years revisited
Dumb Scientist @2
I agree with your question about the impact of ice melting on reducing the rate of air temperature increases. I presume that earth energy balance models include the latent heat required to achieve all the ice melting we have seen over the last few years. Does anyone know of any estimates of the effect the melting has had on moderating changes in sensible temperature over, say, the last decade?
-
william5331 at 09:26 AM on 23 May 20132013 SkS News Bulletin #13: Alberta Tar Sands and Keystone XL Pipeline
You have to agree with the article on Canada. Even if the heads of their government officials are so far up where the sun doesn't shine that they can't recognize the disaster they are helping to cause, at least they could be accute business men. Why on earth would Canada send raw oil, only just separated from the sand, to the USA for them to make most of the profit. As the writer says, Canada is seeing precious little benefit from the exploitation of it's resource. They should be pipeing or trucking refined petrol, diesel and other products to the US. As far as her ecological record goes, look at how she has destroyed her east coast fisheries resources through glaringly faulty science and through bowing to the very short term interests of her fishing companies. They behave like grasshoppers rather than ants (aesop fables) and show zero intestinal fortitude. They went so far as to try to shift the blame onto the seals for the decline in their fisheries resources and actually subsidized seal hunters when the immages of the slaughter of baby seals trashed the fur market. If you want an account of the stupidity of successive Canadian governments, get Sea Of Slaughter by Farley Mowat.
-
Rob Honeycutt at 08:59 AM on 23 May 2013It's satellite microwave transmissions
grindupBaker... I'm really unclear on what you're attempting to say.
-
Esop at 08:57 AM on 23 May 2013A Rough Guide to the Jet Stream: what it is, how it works and how it is responding to enhanced Arctic warming
Brilliant article. Very informative!
-
Dumb Scientist at 08:55 AM on 23 May 2013The anthropogenic global warming rate: Is it steady for the last 100 years? Part 2.
Mod: please delete #99. Dunno why it came out empty...
-
Dumb Scientist at 08:54 AM on 23 May 2013The anthropogenic global warming rate: Is it steady for the last 100 years? Part 2.
Just to be clear, my comment #96 didn't refer to Dikran's comment #95 above. I linked to Dikran's comment on another page which is much more interesting.
-
Dumb Scientist at 08:52 AM on 23 May 2013The anthropogenic global warming rate: Is it steady for the last 100 years? Part 2.
-
KK Tung at 08:33 AM on 23 May 2013The anthropogenic global warming rate: Is it steady for the last 100 years? Part 2.
In reply to post 95 by Dikran: I liked your work investigating the effect of the change in baseline offsetting on the apparent model uncertainty.
-
KK Tung at 08:24 AM on 23 May 2013The anthropogenic global warming rate: Is it steady for the last 100 years? Part 2.
In reply post 95 by Dikran and post 96 by Dumb Scientist: I like the tone of our exchanges now. To understand the point I was trying to make, please first do not view my comments as saying there is anything wrong with the IPCC models. My comments concern the forced response vs internal variability. Since I do not know what the forced response is in the observation, I was using the model ensemble mean as a proxy for that. In fact this is an assumption that the model is perfect. Now we cannot do ensemble mean of the observation, because our climate is just one realization and we do not have the other ensemble members. So we cannot compare observation's forced response with the model's forced response. My statements were never intended to be a comparison of the two and see if the models are correctly simulating the real forced response. Subject to the caveat of my assumption of perfect models, my statement concerns the presence of internal variability. When the observation is below the model ensemble mean, I tentatively suggest that the explanation could be that there is an internal variability that is in a cool phase in the observation but is not (and should not be) in the model ensemble mean. The point I made previously was why we need it now during the hiatus period and not during the period of accelerated warming.
-
scaddenp at 07:52 AM on 23 May 2013Skeptical Science Study Finds 97% Consensus on Human-Caused Global Warming in the Peer-Reviewed Literature
rhJames - firstly, a consensus does exist. Secondly, while a consensus is not proof of a theory, it is the only reasonable basis for public policy so it is important to know what it is.
"Lets stick to the scientific evidence" _ well I wish deniers would but they instead prefer blog "science", cherry picking and misrepresentation. Cook13 is effectively a survey of the published scientific evidence.
-
grindupBaker at 07:45 AM on 23 May 2013It's satellite microwave transmissions
Rob Honeycutt #26 This is true but I have a single-tasking mind and like to keep the waters clear by considering physical realities as the indifferent entities that they are as much as I can. If I can ever manage to grasp them, might move on to spiritual & socio-political. I've scaled mentally by 5,000,000 because I can picture the Earth sphere knocking a small hole in the ceiling with the electromagnetic shining in, 1/8" 90% air, 1/20" oceans, gently warming until they lap the ice away, burping disasters across the land, and so on. It's a human scale.
-
Dumb Scientist at 07:32 AM on 23 May 2013The anthropogenic global warming rate: Is it steady for the last 100 years? Part 2.
Dikran Marsupial has performed an analysis which is relevant to this conversation.
Dr. Tung, if you'd like to comment on Dikran's method, we'd all appreciate your insight. Thanks.
-
Rob Honeycutt at 07:15 AM on 23 May 2013Skeptical Science Study Finds 97% Consensus on Human-Caused Global Warming in the Peer-Reviewed Literature
I have to say, one of the most compelling aspects of Cook13 is that the resulting consensus figures for the SkS rated papers almost precisely match the consensus figures coming out of the scientists' self-ratings. (97.1% vs 97.2% respectively)
If there was ever a great example of self-skepticism, this was it. John Cook made sure that we tested our own biases here at SkS against the evaluation of the scientists themselves. And not just a few cherry picked scientists. We tested against a very large number of scientists.
-
Rob Honeycutt at 07:03 AM on 23 May 2013Skeptical Science Study Finds 97% Consensus on Human-Caused Global Warming in the Peer-Reviewed Literature
rhjames said... "Let's stick to scientific evidence."
You seem to be operating under the erroneous assumption that Cook13 is a survey of scientists (a "show of hands"). It is not. It is a survey of the published research.
It's entirely likely that there is research within the survey that reflects different positions on papers coming from any one scientist. A researcher that has published a large body of research could potentially have papers that fall into each of the 7 endorsement categories. Certainly most of the researchers who have multiple papers in the study have them falling into at least two or more of the categories.
So, really, the opinions of the scientists themselves matter little. What matters is what their data show.
-
John Russell at 07:00 AM on 23 May 2013A Rough Guide to the Jet Stream: what it is, how it works and how it is responding to enhanced Arctic warming
If anyone wants to keep track of the jet stream position over the N Atlantic/UK on a daily basis, I've found this site to be very useful.
Damn good article, by the way. I'll be coming back. Thanks for the hard work, John M.
-
Composer99 at 06:41 AM on 23 May 2013Skeptical Science Study Finds 97% Consensus on Human-Caused Global Warming in the Peer-Reviewed Literature
Claims identical to yours have been examined before and rightly dismissed, for three reasons.
First, most orthodox or consensus positions before the scientific revolutions in various disciplines were not based on anything like as rigorous the methodologies used to generate consensus positions in the sciences today, and are an inappropriate point of comparison. Who cares whether or not there was a consensus about bloodletting in the past? The consensus about AGW is comparable to the consensus of other contemporary scientific topics: quantum mechanics, relativity, and the like. (*)
Second, the consensus of experts follows from the preponderance (or, if you will, the consensus) of the evidence, a point that has been raised on several occasions on this thread and any other occasion where the scientific consensus has been discussed.
Third, research shows that the public perception of the scientific consensus is an important component of public advocacy for action to reduce emissions and mitigate global warming. So it is in fact critical, if we want to avoid the worst consequences of rapid global warming, to spread the word about the consensus.
(*) In point of fact I have a hard time thinking of any case where a scientific consensus, in the modern sense, of over 90% of scientists has arisen that has actually been overturned, with the possible exception of what caused gastric ulcers. In past cases either the consensus was non-scientific, or there was no consensus position to speak of.
-
Kevin C at 05:51 AM on 23 May 2013Has the rate of surface warming changed? 16 years revisited
It has been suggested that we leave the video up but add annotations to explain where the problems are. This would retain the educational content (and in practice probably enhance it, because learning often progresses through correcting wrong understanding).
But the big advantage is that everywhere the video has been embedded the annotations will now be visible.
However, John is pretty busy with at the moment, so it may take a week or two.
-
Kevin C at 05:47 AM on 23 May 2013Has the rate of surface warming changed? 16 years revisited
Keith: I wouldn't include ocean heat uptake in a fitting calculation, but it's the sort of effect you might detect more clearly having removed the other terms. In otherwords, a change in trend.Troy is working on doing this without using fitting methods, which means you don't have to assume the warming signal and thus gives you a much better basis for detecting changes in the warming signal.
-
Dumb Scientist at 05:26 AM on 23 May 2013Has the rate of surface warming changed? 16 years revisited
jdixon1980: The total energy content of the climate system needs to be stressed much in the media. I've been making this point since 2009, and many of my colleagues have made similar complaints. So I'm inclined to place the blame on the media rather than on scientists.
Imagine filling a measuring cup at a constant rate while the water sloshes around. Sometimes the water will pile up against the side of the cup that doesn’t have the measuring tick marks. As it piles up, the water level against the tick marks might go down even as the faucet pours water into the cup.
In this analogy, the water level in the cup is the Earth’s total energy and the constant water flow is the extra radiative power added by human emissions. The side of the cup with the tick marks is the Earth’s surface, where most of our temperature sensors are. The other side of the cup is the deep ocean, which we can’t measure as well as the surface.
Water sloshing towards the tickmarks is like a temporarily warm El Nino, while water sloshing away from the tickmarks is like a temporarily cool La Nina.
Humans add extra water to the cup, but it sloshes around the cup naturally.
Humans add extra energy to the Earth, but it sloshes around the Earth naturally.
-
John Hartz at 05:20 AM on 23 May 2013Skeptical Science Study Finds 97% Consensus on Human-Caused Global Warming in the Peer-Reviewed Literature
@Barry #189:
You state: I'm discussing the academic merit of the Cook et al study.
What exactly do you mean when you use the phrase, "academic merit"?
-
keithpickering at 04:32 AM on 23 May 2013Has the rate of surface warming changed? 16 years revisited
Is it really correct to include both ENSO and ocean heat uptake changes? Aren't these pretty close to measuring the same thing?
-
Dikran Marsupial at 04:15 AM on 23 May 2013The anthropogenic global warming rate: Is it steady for the last 100 years?
Dumb Scientists yes I agree, however we need to determine if the basic approach is mathematically sound before worrying too much about the details!
-
Miriam O'Brien (Sou) at 04:09 AM on 23 May 2013Has the rate of surface warming changed? 16 years revisited
Jdixon1980, is this what you are looking for?
-
Dikran Marsupial at 04:04 AM on 23 May 2013The anthropogenic global warming rate: Is it steady for the last 100 years? Part 2.
Prof. Tung I do not understand the point you are trying to make with this image.
Nobody should expect the observations to lie any closer to the ensemble mean than is indicated by the spread of the model runs (as I have stated before). Note that in 1998 the observations were closer to the (upper) boundary of the 95% than current observations are to the lower boundary. However the 1998 event was not evidence that the ensemble mean was not a good approximation of the forced response, so I see no reason to think that the current observation-ensemble mean difference is indication of a systematic issue, but is probably just internal variability. Of course we are also interested in the physics of internal variability.
The diagram I gave uses the model projections actually used in AR4 and uses the same baseline period that is used in making the projection. Do you agree that it shows that the observations are consistent with the model projection, yes or no? If "no" please explain what is defficient in the figure I presented here.
Note that the choice of baseline has a large effect on the apparent uncertainty of the observations and the models at the boundaries of the baseline period. I suspect this is the issue that James Annan mentions on the twitter thread. Compare the width of the model spread using the two different baseline periods
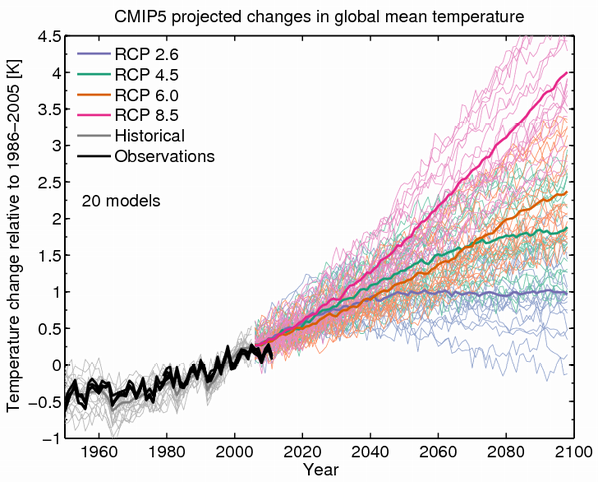

Note the observations are less close to the edge of the model spread if the longer baseline period is used, as the baselineing procedure minimises the differences between models in the baseline period. The longer the baseline period, the less this can over-fit the variability within the baseline period, so less of the model uncertainty is attenuated.
-
Rob Honeycutt at 04:00 AM on 23 May 2013It's satellite microwave transmissions
grindupBaker... But it would be the change in the Earth's climate system that matters to us tiny beings living on the planet's surface.
-
Dumb Scientist at 03:56 AM on 23 May 2013The anthropogenic global warming rate: Is it steady for the last 100 years?
Thanks Dikran! I have to rush off to a talk, but I wanted to nitpick: our CO2 emissions are rising faster than exponentially. Anthropogenic forcings might be rising quadratically...
-
KK Tung at 03:34 AM on 23 May 2013The anthropogenic global warming rate: Is it steady for the last 100 years? Part 2.
Still can't insert. But the figure can be found here.
https://twitter.com/ed_hawkins/status/299161479268139009
 Moderator Response:
[Dikran Marsupial] Image added, on my browser (Firefox) clicking over the image on the Twitter brings up a menu with an option to "view image", which loads the image in a new tab on the browser, which then gives a URL that you can use with the SkS image widget. I suspect other browsers have similar functionality but I only use Firefox myself. HTH
-
KK Tung at 03:33 AM on 23 May 2013The anthropogenic global warming rate: Is it steady for the last 100 years? Part 2.
I am still having problem inserting figures. I was able to insert a pdf but not a powerpoint figure previously on this site, but no more. I also don't have a server where I can host. SkS need to fix this problem.
I managed to find one figure, the one by Ed Hawkins, on his own twitter site. MA Roger's comment on the person who sourced Hawkins' figure is irrelevant. I thought it better to use a direct source and bypass the second quesssing of the motives of the person who sourced it.
Moderator Response:[Dikran Marsupial] I have sent an email suggesting an interim solution. I will raise this issue with the other SkS moderators. I don't think powperpoint images are directly supported by browsers, so perhaps converting it to png, jpg gif etc may resolve the problem.
-
KK Tung at 02:49 AM on 23 May 2013The anthropogenic global warming rate: Is it steady for the last 100 years? Part 2.
[image deleted]
Moderator Response:[Dikran Marsupial] I'm sorry Prof. Tung, SkS doesn't support uploading images to the site, only linking to images that are already hosted on other sites already. Perhaps the easiest approach would be to place them on your own webserver and then link to them here, or possibly use one of the photo sharing services, such as flikr (which is what I have to do for another blog to which I occasionally contribute). Specifically, the data for the image cannot be part of the URL.
-
Rob Honeycutt at 02:32 AM on 23 May 2013Skeptical Science Study Finds 97% Consensus on Human-Caused Global Warming in the Peer-Reviewed Literature
Jason said, "Next we'll be arguing what the meaning of "is" is!"
Exactly. At this point Cook et al 2013 is part of the published research on this matter. If there are people like Lucia and others who wish to challenge the findings, they should do so by the way of publishing their own paper.
They are more than welcome to craft their own methodology to test the level of consensus on AGW. But, like with the hockey stick, I think the results they would get would go against the conclusions they want to see, and to get the conclusions they'd prefer would require contortions that would not pass peer review.
-
grindupBaker at 01:51 AM on 23 May 2013It's satellite microwave transmissions
I only started looking at "Global Warmage" for science & math interest 3 months ago. I linked here from a 2013-05 post about revised AST processing. Oh boy. They have absolutely no concept whatsoever of the orders of magitude difference between the vast energy delivered non-stop to Earth by the sun & the trivial bits shoved around on Earth surface. Signs are that this inability to grasp simple quantity concepts is endemic among the public at large.
-
jdixon1980 at 01:49 AM on 23 May 2013Has the rate of surface warming changed? 16 years revisited
A helpful image could be somebody on an elevator going up while playing with a yo-yo - the height of the yo-yo goes up and down, and might be above or below the hand at any given time, but it's average height is increasing just as quickly as the average height of the hand.
-
jdixon1980 at 01:44 AM on 23 May 2013Has the rate of surface warming changed? 16 years revisited
DS @2: "As you say, the total energy content of the climate is a more direct measure of global warming."
One thing that bothers me about the way the warming trend is presented to the public in the MSM is that whatever is happening with surface temperatures is always the focus of the headline and the focus first several paragraphs, if not the entire article. If there is any mention of total climate energy content, it is usually buried in a later paragraph and not represented in a prominent figure, such that I would venture to guess that most casual media consumers skim over it, if they even get that far in the article before moving on to something more scintillating. A perfect example is the recent Economist article on climate sensitivity (http://www.economist.com/news/science-and-technology/21574461-climate-may-be-heating-up-less-response-greenhouse-gas-emissions), which, when it finally addresses ocean heat content about midway through the article, focuses on the top 700 m with an accompanying graph showing a flattening (but still positive) temperature trend, and only mentions the Balmaseda et al. study of trends in the total ocean temperature profile as an afterthought.
Do you think that climatologists need to do a better job of conveying the greater long term significance of total climate energy content (as opposed to surface temp fluctuations) to the MSM, so that the MSM might focus more on the significance of total climate energy?
Would it help to use more or better analogies of ocean heat content to something intuitive and mechanical, like Verner Suomi's famous "great and ponderous flywheel," but maybe not so lofty? What about the ocean heat content as a "hand" and surface temperatures as a "yo-yo," which can go up and down but is always tethered to and pulled back towards the hand?
-
JasonB at 01:38 AM on 23 May 2013Skeptical Science Study Finds 97% Consensus on Human-Caused Global Warming in the Peer-Reviewed Literature
barry,
I'm making no claim as to what the consensus statement is meant to be.
You said "there is no doubt that the consensus is that human activity is causing at least some global warming". Cook et al's results are far stronger than that, as I already explained.
I don't know how many times I can keep saying this; the original authors were asked whether their papers endorsed AGW. The results are being reported as the percentage of papers that endorse AGW. There is no discrepancy. What the general public wants to know is "is human activity causing global warming?". That's exactly the statement that the authors of 97.2% of the papers that expressed an opinion on the matter said their paper endorsed. QED.
Moderator Response:[JH] Be careful of excessive repitition.
-
Miriam O'Brien (Sou) at 00:19 AM on 23 May 2013Has the rate of surface warming changed? 16 years revisited
Kevin, I particularly like your animation of the possibly different effects of the volcanoes. I expect that each large-ish volcano can have different effects on climate to some extent, depending on what part of the world it erupts in, time of year etc. So that looking at other eruptions won't necessarily give an answer to what happened in any other case.
-
Miriam O'Brien (Sou) at 00:13 AM on 23 May 2013Has the rate of surface warming changed? 16 years revisited
@JohnRussell I wouldn't worry too much about what Bob Tisdale says. He's a one-trick pony just going on about ENSO jumping up and down and leaping and cavorting with 'natural' but completely unexplained magical warming (by Bob himself, that is). I've noticed many of the WUWT faithful don't put much credence on him these days. He's missed the main point that Kevin is making altogether in his haste to push his ENSO barrow.
I don't have a view one way or another on the video. I found it useful myself but didn't take it to be the last word on the subject (nothing ever is). Still, I'm happy to wait to see what new science comes out over coming months. Or for Bob T's El Nino - maybe next year? I wouldn't be surprised if it's a doozy when it comes.
I have to say articles like this are refreshing. It forces one to think about things more and realise that there is a lot to consider when it comes to what climate change will bring - and when.
Prev 895 896 897 898 899 900 901 902 903 904 905 906 907 908 909 910 Next


