


 Arguments


Recent Comments
Prev 83 84 85 86 87 88 89 90 91 92 93 94 95 96 97 98 Next
Comments 4501 to 4550:
-
Eclectic at 14:38 PM on 17 February 2022SkS Analogy 1 - Speed Kills: How fast can we slow down?
Santalives @11 ,
forgive me for intruding so soon again in this thread. I was at my desk, sipping my coffee, when your post popped up on screen. ( Though, from my following comments, you may think I have been sipping lemon juice ! )
Rather than supplying a paper containing scientific research to challenge mainstream climate science, you have instead supplied a paper [really more a discussion article] which leans toward the philosophic. Titled:- "Rethinking Climate, Climate Change, and their Relationship with Water." by Demetris Koutsoyiannis ~ an engineer, professor of Hydrology ~ and a name not entirely unknown in the Deniosphere.
The paper fails to be scientific, despite being dressed up in scientific robes (and including some equations ! ). Essentially the paper is a leisurely rant and a cri du coeur by the author, who appears greatly offended by the term "climate change". Which he describes as a "pleonasm".
Surprisingly, perhaps "pleonasm" does not translate well into the Queen's English, from the author's native Greek. But it is ironic that he takes great exception to a lengthy two-word phrase [climate change] when his own article is of such prolixity that [Nigelj among others] many would not bother to read its entirety.
# Accordingly, I recommend that SkS readers save their time, and do not bother reading professor K's paper . . . unless they wish to do so for purposes of wry amusement. It becomes clear that professor Koutsoyiannis does not understand the basics of climate science, and that he does not wish to.
For example : buried in the mass of the article, the author states that it is temperature change which predominantly causes CO2 change.
For example : the author states that land use change "may have much more substantial effects on the entire Earth than the infamous fossil fuel burning".
For example : the author states that Greenhouse LWRadiation absorption is 19% by carbon dioxide and 75% by water. Largely true ~ but the good professor seems clueless about the significance of it all.
# The paper begins with peripatetic discursiveness. And often a red flag, when pleonasm and Hipparchus are mentioned at the start of an article. As well as Kolmogorov later.
After a great deal of waffle, and an extensive excursion into the 200-year record of precipitation at the city of Bologna . . . the author manages to come to the conclusion that :- "it can be anticipated that many readers would find this paper useless"
...Mmm, I can see Nigelj agreeing with that. But why did not the paper's reviewers not agree with the author's own conclusion?
The author's other conclusion of note is :-
. . . "Climate is not static but dynamic." And at this point, I see the Nobel Committee putting away their pens and notebooks.
-
Santalives at 13:57 PM on 17 February 2022SkS Analogy 1 - Speed Kills: How fast can we slow down?
I picked a random example of a paper that questions the climate change narrative. But my point is there are literally hundreds of peer reviewed papers like this that make it very clear the science is not settled. If it was settled then these papers would not be getting written or published. My point is the article above is jumping to conclusions about climate change if they are set in stone and there is only one course of action. Where this paper shows the static view of climate only being being controlled by C02 is putting the Cart before the Horse. Obviously this paper is all about we are studying the wrong thing and ignoring the real climate driver H20, not surprisingly for a Hydrologist. But my bigger point is why isn't papers like this and all the others not up on this website, being debated? As he said in the conclusion, ......
Plato and Aristotle clarified the meaning and the ethical value of science as the pursuit of the truth; pursuit that is not driven by political and economic interests.
Moderator Response:[DB] Sloganeering and off-topic snipped.
-
Evan at 11:43 AM on 17 February 2022SkS Analogy 1 - Speed Kills: How fast can we slow down?
Santalives@11 What point do you think this paper makes that needs to be debated or discussed? I am interested in what you think is of interest.
-
nigelj at 10:58 AM on 17 February 2022SkS Analogy 1 - Speed Kills: How fast can we slow down?
Santilves. So I was basically right. It would seem reasonable to review the occasional more sensible paper that challenges some aspect of the consensus. However imho this website should not waste time on reviewing endless junk science papers and give them publicity. I cant see much point in endlessly debating settled aspects of climate science. Should we also have never ending debates on Newtons Laws of motion and the theory of relativity?
The study you quote seems a good example of junk science. Anyone with half a brain can see no period of time has had a totally and completely unchanging climate and that the term climate change refers to big obvious changes that interest us particularly, and the paper you quote is just pedantry. The paper you cite also attempts to argue climate change is caused by water. I stopped reading at that point. Dozens of studies have claimed this sort of thing, and have been shown to be junk science. Why would any sane person read yet another?
-
Santalives at 09:01 AM on 17 February 2022SkS Analogy 1 - Speed Kills: How fast can we slow down?
nigelj, you are right I should provide real examples. First let me explain myself as you accuse me being a denier and trolling. I use to be a what would be a climate alarmist, sucked into the whole thing, world is going to end in 12 years blah, blah. A friend told me to get a grip and challenged me to learn the other sides arguments. Can't say that turned me from Alarmist to a Denier but more a skeptic of all of it. What I get frustrated with is puff pieces or exaggerated alarmist claims that are easy fodder to get shredded on denier sites. What is I see on sites like wuwt they will publish peer reviewed climate science and debate it, but I don't see much of that on climate change sites. I would like to see this site publishing article like this www.mdpi.com/2073-4441/13/6/849/htm. Then a informed debate by the many experts who contribute to this site.
-
Eclectic at 08:58 AM on 17 February 2022CO2 emissions do not correlate with CO2 concentration
JohnMashey @18 , thanks for that information.
Particularly good was the reference to the journal's declared usage of a double blind process by an associate editor and two reviewers. What could possibly go wrong?
In the end , it is the outcome that matters.
"By their fruits ye shall know them" ~ is the biblical phrase.
-
JohnMashey at 08:23 AM on 17 February 2022CO2 emissions do not correlate with CO2 concentration
The Skrable, et al paper appears akin to last summer's HGSS mess, i.e., HG6-9, Case D in taxonomy of how poor climate papers get published, off-topic journal, weak editorial process, possible "pal review." Publisher Copernicus handled this well, paper retracted, relevant editor and author/editor left.
In this case, the 3 authors were labeled as affiliated with UMass Lowell.
Kenneth Skrable was already emeritus in 2012, p.14 of physics dept brochure.
George Chabot is Professor Emeritus of Physics.
Clayton French is also Professor Emeritus of Physics and you can see his papers there, many coauthored with Skrable and Chabot, often published in Health Physics.
Some were coauthored with current UMAss Lowell prof Mark A. Tries, who is one of the editors at Health Physics.
His 2000 PhD Dissertation p.3 had:
Supervisor: George Chabot, also on p.4. and see p.8 for AcknowledgmentsCommittee: Kenneth Skrable, Gus Couchell, Clayton French.
Of course, that may be coincidence, as the 3 authors had published many papers in Health Physics, but the question must be raised, given the editorial process:
"Review and Editing Process. After you have submitted your manuscript, a Health Physics associate editor and two peer reviewers (selected by the associate editor) will review it using a double-blind process. The reviewers will evaluate your manuscript's scientific or technical merit, originality, practicality, interest to our readers, and conformance with these guidelines. The reviewers will decide if your manuscript should be accepted, revised, or rejected, and you will be notified of their decision. If your manuscript requires revisions, you can resubmit the revised manuscript. At this point, your manuscript may be accepted, rejected, or the peer-review process may be repeated. When your manuscript is accepted, Journal editors will copyedit it to conform to Journal style requirements. You will be asked to review and approve any changes to your manuscript before it is published."
It appears that a paper is handed over to associate editor who then makes the decisions, akin to the infamous de Freitas pal review at Climate Research years ago.
This case also seems akin the the (eventual) retraction of Florides et al(2013), accomplished by dogged work of SKS' Ari Jokamaki. Sooner or later, journals need to learn to reject papers out of their field.
-
nigelj at 06:35 AM on 17 February 2022SkS Analogy 1 - Speed Kills: How fast can we slow down?
Eclectic @6, yes we are probably just differing on definitions. Junk science would describe what I was getting at just fine. I think its useful for this website to occasionally review the failings of such papers, but not too often because it starts to give them free publicity. And the points they raise are often rather arcane and of interest to a minority of people. Imho its still important to put most effort into rebuting the well established denialist myths, that seem to persist for decades, like zombies.
-
Evan at 02:31 AM on 17 February 2022SkS Analogy 1 - Speed Kills: How fast can we slow down?
wilddouglascounty@8 Thanks for your comments and suggestions. I will readily switch to a new metaphor if it seems appropriate, and I appreciate you offering a menu of suggestions. Thanks.
Part of the reason I picked the land-use change metaphor is that I specifically want to include some level of "hurt" and undesirability. I don't believe we will get out of our climate mess without people making sacrifices that include getting by with fewer conveniences and overall consuming less. Whereas many GW/CC skeptics/deniers say that a switch to renewable energy will ruin our economy, and whereas leading organizations are proclaiming that we can maintain "robust economic growth" while reaching net-zero by 2050 (read the IEA report here), I interpret effective solutions as a mixture of these two views. The degree to which the transition will hurt depends on the time frame involved. Please understand that I am only talking about the pain associated with the transition. Obviously the longer we take to fix the climate mess, the worse it will be for future generations. I am not dealing with that issue here. Only the pain associated with the transition itself. That is, how fast can we slow down?
If we set a longer time horizon (e.g. more than 50 years) for reaching net zero, then we could possibly maintain "robust economic growth". If we try to reach net zero in 10 years, then we are likely to ruin our economy by trying to accelerate reasonable depreciation schedules so that we prematurely absolecing goods that still have useable lives. Given the 25-year time frame that is being advertized (I am rounding down a bit from 28 years), IMO, we are somewhere in the range where what we are being asked to do will hurt a lot more than I see being advertized. So I like an analogy that implies hurt, even though I agree that whereas we are trying to stabilize climate, road-building does not necessarily convey the same warm fuzzy feelings that building a renewable-energy based society does.
I will consider your suggestions for a different metaphor.
-
wilddouglascounty at 02:13 AM on 17 February 2022SkS Analogy 1 - Speed Kills: How fast can we slow down?
In the collaborative spirit, may I make an observation? I like the idea of exploring the practical implications of a 100 year plan vs the 1 year plan of urban relocation for a road, but as most will attest, removing neighborhoods for a big road project really has incredibly bad vibes as a metaphor. Can't we come up with some better metaphors to get the point across? Here are a few ideas, but really this is your metaphor, so I leave the details for you to come up with some more positive role models than one that implies a top-down railroading of an idea down people's throats that is implied with a neighborhood-splitting road project.:
-Looking at how changing fee structures and allocating bandwidths to new technologies, among other things, allowed for a revolutionary transition from landlines to smartphone communication networks.
-Looking at various models of urban planning: growth guided by zoning and policies vs unregulated slums created by depopulation of the rural countrysides, punctuated by clearing those slums in order to create some big building zone designed to enrich the developers.
-model ways of restoring habitat that incorporates local cultures vs projects where those groups are displaced in favor of extractive projects from abroad, with little regard to the environmental consequences.
Some of the key things to keep in mind are equitable participation in the benefits as well as the issue of externalizing the costs while privatising the benefits, etc., etc. So you're right: people will put up with a considerable amount of discomfort if they see it is for the greater good, of benefit for future generations, etc. Picking the right metaphors could be one key for their perceiving themselves as benefitting from the changes vs being one of the victims of it.
-
Evan at 01:09 AM on 17 February 2022SkS Analogy 1 - Speed Kills: How fast can we slow down?
Nigelj@1, agree with your note about how we are wired to respond to immediate threats. But we do respond, at least if we are constantly reminded of the consequences. Many habits do not cause problems until later in life, but we are reminded of the consequences by people who made not-so-good choices 30 years ago and are only now facing the consequences. This motivates those of us trying to make better choices now.
Hopefully the same will work with GW/CC. Already some are experiencing the consequences of our emissions 30 years ago. There is likely nothing we can do about the emissions we've incurred over the last 30 years. But as they play out, they will be a constant reminder of what will happen 30 years from now if we don't scale back. So, in a sense, the consequences of GW/CC that we increasingly see happening now should provide the kind of impetus needed to make better and better choices.
That is, for us to effectively respond to future threats, there likely needs to be a certain amount of discomfort now to motivate effective, long-term action.
-
JimCA at 23:54 PM on 16 February 2022CO2 emissions do not correlate with CO2 concentration
Thanks, Eclectic@14 and MA Rodger@15.
As someone in an unrelated field, it's reassuring to see that my naive reactions to it were well aligned with more capable reactions from experts. Helps me trust my own judgement here a bit more...
-
Eclectic at 16:34 PM on 16 February 2022SkS Analogy 1 - Speed Kills: How fast can we slow down?
Nigelj , you intrigue me. What are these "sceptical studies" you mention? If they prove genuine science, then they get incorporated into the mainstream climate science. If they turn out to fall flat on their face, as junk science . . . then they get forever reincarnated at WattsUpWithThat ;-)
Nigelj , perhaps we are merely differing on definitions !
-
nigelj at 16:16 PM on 16 February 2022SkS Analogy 1 - Speed Kills: How fast can we slow down?
Santalives is probably a denialist, engaging in some fairly obvious trolling. No warmist or genuine truth seeker would start by saying "The climate crises narrative is falling apart faster then Biden presidency but..." He just wants this website to post lots of articles and details of sceptical research studies on the basis that "all publicity is good publiciity." Dont fall for it. It might be worth looking at just the very occasional sceptical study that raises something genuinely new, and that isn't obvious rubbish. Nothing more.
-
Eclectic at 15:28 PM on 16 February 2022SkS Analogy 1 - Speed Kills: How fast can we slow down?
Santalives @2 , you seem in an argumentive mood, yet you have (so far) failed to provide any substance to your comments. Perhaps you could be kind enough to give some of the "not based on science" examples you were maybe thinking of?
# Please note this website favors specific reasoned posts, each placed in the most suited individual thread already existing. Not a general rant or Gish Gallop of umpteen points. I would suggest you make one, maybe two separate posts . . . and then proceed to play your remaining 50 cards or so, one at a time, once your first cards have been well discussed.
AFAICT, this SkS website is an excellently efficient source of scientific information (and many links) for those who wish to educate themselves rapidly about climate science. Many of the "Climate Myths" articles [see top left of page] are a decade old, yet still highly relevant and providing useful links as well as more recent discussion in the attached comments columns. Remember, much of the climate science has been "settled" for a long time ~ and you won't need much updating to get to "today".
This SkS website is not about politics of the partisan type. Solutions & education are sometimes discussed (as in the above article), but mostly SkS is simply about the science of climate. For myself, I have visited dozens of "climate" websites over the years . . . and find SkS gives the broadest coverage of the science spectrum. If you have found a better one, please inform me !
Santalives, if you want to argue "the politics", then you might like to head over to WattsUpWithThat blogsite. You won't find much genuine science there - but you will find plenty of angry arguing, mixed in with shoddy or deluded junk science . . . plus a lot of conspiracy theories . . . plus many Flat-Earth-style greenhouse deniers. You will find it interesting in a psychiatric way, but you will likely find it disappointing if you are hoping for actual political effectiveness.
# Santalives , it would also be good if you could supply (and discuss) some of the "alternative research" you mentioned. For many years I have been looking for genuine research which challenges/overthows the mainstream climate science . . . but nothing genuine found ! Yes, lots of half-baked ideas and (baseless) speculative hypotheses . . . but in the end, they all fail. Sadly, the mainstream science has not been successfully challenged.
-
Doug Bostrom at 15:11 PM on 16 February 2022SkS Analogy 1 - Speed Kills: How fast can we slow down?
Speaking of analogies, SkS is kind of like open source software (OSS).
If one wants a new feature or a bugfix in OSS, one can ask a developer politely and constructively. Notably, whining blended with complaining won't work.
But very often the fastest and surest way to improvement of OSS is to author and submit code, if one has the skills to do that.
Santalives, this is an all-volunteer operation. We work hard to keep the site up to snuff but there is more work to be done than available labor. We can use more help. Audition to become a volunteer by revising a myth rebuttal you find objectionable according to your wishes and standards, then emailing your work to our contact address. Short of that, you could identify some particular, specific issues and do a little legwork in the background, pass the results along. Even a little bit of sincere effort would be appreciated, and quite possibly genuinely useful.
-
Santalives at 13:42 PM on 16 February 2022SkS Analogy 1 - Speed Kills: How fast can we slow down?
Why are so many of the articles on this site not based on science. The climate crises narrative is falling apart faster then Biden presidency but this site doesn't step up and counter the arguments. To win the argument there has to be direct rebuttal of the articles (especially the peer reviewed) that are shredding climate science as nothing more than voodoo. Just ignoring the alternative research is vacating the field for the other side. Maybe updating the climate myths section would be a good place to start, as the content is not very sophtiscated, out of date and does not address the topics and evidence being discussed today
Moderator Response:[DB] Welcome to Skeptical Science! Every single article and rebuttal here is based on the science, complete with citations and links to the sources cited. Since you are unfamiliar with the site, first read this post and then this post. Then if you still have questions, place those questions on the most appropriate post (using the Search function in the upper left area of every page); thousands of posts exist, all with active comments sections. It would be best to first read the comments section of the post you place a question on in addition to the post itself, to avoid replication of already-answered questions.
Should you still feel a particle article or rebuttal is in error, you are welcome to submit suggestions for improvement via the process described by Doug Bostrom. Merely saying "nuh-uh" is insufficient, in a science-based and evidence-based forum such as this. What this means is that ventured opinions still need to be based on reputable research appearing in the published, peer-reviewed literature. Failing that, opinions carry little weight here.
Please construct all future comments to conform to this site's Comments Policy, as this is a moderated forum. Enjoy your time here!
Ideology snipped.
-
nigelj at 11:12 AM on 16 February 2022SkS Analogy 1 - Speed Kills: How fast can we slow down?
Thank's Evan. Imo those are very realistic, well grounded comments and good advice.
Mitigatating the climate problem is also made difficult by the issue discussed here: "Humans Wired to Respond to Short-Term Problems Harvard psychology professor Daniel Gilbert argues that humans are exquisitely adapted to respond to immediate problems, such as terrorism, but not so good at more probable, but distant dangers, like global warming."
The ideas seem convincing to me. Not sure what the solution to that is, and sorry for being a bit doomy, but people will generally support things with cost advantages and multiple immediate advantages beyond just mitigating climate change, and solar power, wind power and improving affordability of EV's and PHEV's all have such characteristics. While we should solve the climate problem for noble reasons, the almighty $ seems to be the thing driving the most observable actual changes.
-
nigelj at 06:29 AM on 16 February 2022How 2022 could be a national and global pivot point for carbon emissions
Knaugle
Yes agreed, and there is another angle on all this. Firstly there is indeed some evidence that the rate of use of coal is declining and reserves are more limited than previously thought and this might suggest that 5 degrees is no longer plausible. Refer:
www.nature.com/articles/d41586-020-00177-3
However, there are also signs that ice sheet stability is under serious threat even at about 1.5 degrees of warming (there is plenty or recent commentary on western antarctic ice sheet easily googled) and plenty of recent attribution studies on extreme weather showing huge issues. This might suggest that sea level rise and how weather extremes are changing is more sensitive to warming than previously thought. So even if 5 degrees is now very unlikely, it might not make things better and could create a false sense of security.
And it is worth looking at Pielkes background: "Roger Pielke Jr has degrees in poltical science and maths. "While Pielke Jr. argues that he is not a climate change skeptic, and accepts that man-made climate change is a real problem, he has consistently opposed the idea that extreme weather events and climate change are connected. [5Grist writer David Roberts wrote that Pielke Jr. has “been playing footsie with denialists and right-wing ideologues for years; they’re his biggest fans,” and critics have noted that Pielke Jr.’s work has often been cited by climate change deniers. [2], [3]"
-
knaugle at 03:06 AM on 16 February 2022How 2022 could be a national and global pivot point for carbon emissions
Going forward, this study just came out of the Univ. Colorado at Boulder, suggesting the worst case scenarios of 15 years ago are now much less likely.
'Worst-case' climate predictions are 'no longer plausible', study suggests
Still, even if +5°C is off the table, what remains is not a walk in the park.
-
Eclectic at 23:10 PM on 15 February 2022CO2 emissions do not correlate with CO2 concentration
Thanks, MA Rodger.
Your expert analyses are always "gold medal". [For readers at a later date, we are currently in the midst of the Beijing Winter Olympics.]
Skrable et alia could be forgiven for being inept & dysfunctional . . . if only . . . if only they happened to be advancing our understanding of climate science, rather than impeding science.
One other point, MA Rodger ~ if the learned journal decided to retract the Skrable paper, would that then make the ex-paper even more exSkrable? (sorry . . . couldn't resist ! )
-
MA Rodger at 21:10 PM on 15 February 2022CO2 emissions do not correlate with CO2 concentration
Eclectic @14,
I would be more specific than describe Skrable et al (2022) 'World Atmospheric CO2, Its 14C Specific Activity, Non-fossil Component, Anthropogenic Fossil Component, and Emissions (1750–2018)' simply as "garbage". It is 'academically dysfunctional'.
Skrable et al tell us that they are carrying out analysis that has so far been overlooked by science saying:-Despite the lack of knowledge of the components of C(t)**, claims have been made in the scientific literature (CSIRO 2014; Rubino et al. 2013, 2019) that all or most of the increase in C(t) since 1800 has been due to the anthropogenic fossil component, CF(t). [**C(t) is the atmospheric CO2 concentration at time-t.]
These references are made bizarrely to an Australian Bureau of Meteorology 'State of the Climate 2014' report, and also to two papers (here & here) which use ice cores and analysis of 13C to demonstrate the anthropogenic impact to AD1900. For some reason with this referencing, Skrable et al use a URL to a WMO GHG Bulletin which does provide the 14C analysis Skrable et al are saying hasn't been done (although Skrable et al specifically talk only of analysis of atmospheric 14C).
And the go-to place for any researcher venturing into the world of climatology is the IPCC Assessment Reports and AR6 Chapter 5 Section 5.2.1.2 is far from silent on the matter, including analyses of 14C in the atmosphere, saying:-
These three lines of evidence** confirm unambiguously that the atmospheric increase of CO2 is due to an oxidative process (i.e. combustion). Fourth, measurements of radiocarbon (14C–CO2) at sites around the world (Levin et al., 2010; Graven et al., 2017; Turnbull et al., 2017) show a continued long-term decrease in the 14C/12C ratio. Fossil fuels are devoid of 14C and therefore fossil-fuelderived CO2 additions decrease the atmospheric 14C/12C ratio (Suess, 1955) [**(i) The timing of rising CO2 at the South Pole relative to elsewhere (ii) The 13C analyses (iii) The declining O2/CO2 ratio.]
It is entirely inept of Skrable et al to ignore such obvious literature which they attempt to overturn.
-
Eclectic at 12:07 PM on 15 February 2022CO2 emissions do not correlate with CO2 concentration
JimCA @13 ,
there is no need for rebuttal of that paper. It is garbage.
The authors Skrable et al., have produced a nonsense paper, which (as you say) has been published in an entirely inappropriate journal for the subject matter of the atmosphere & carbon cycle. Cruelty to the poor old reviewers, having this dropped onto their plate, and being pressured to pass it through.
Kenneth Skrable has qualifications in the field of radioactivity, I gather.
Somehow the authors have claimed a residual [atmospheric CO2] anthropogenic level of 12% over the 1750 - 2018 period . . . "much too low to be the cause of global warming". The authors seem oblivious to the mountain of evidence that they are wrong about climate science. Additionally, they handwave away the 13-Carbon atmospheric evidence.
I have skimmed through the paper, but have not bothered to look in detail at their 14-Carbon arguments ~ no more would I look in detail at the calculations of any authors who claim to have invented a Perpetual Motion machine.
Because when someone gets nonsense results, you know that there must be major faulty logic somewhere in his/her workings. It is just not worth the time to chase down the error/errors.
Probably, Skrable & colleagues are using some form of motivated reasoning where they delude themselves via re-defining terms to suit themselves . . . while at the same time ignoring several Elephants in the Room.
I suspect the Skrable et al., paper will make a minor splash among Denialists . . . and then soon enough be put on their back burner, along with all the other nonsense calculations claiming 3% anthropogenic CO2 . . . or 4% . . . or 12% . . . or 23% . . . or whatever. And then, at different occasions (despite the shameless contradictions) they will handwave at a single one of these figures, for rhetorical effect.
How is it that otherwise-intelligent people (even the odd Nobel Laureate) get to produce such nonsense? The human brain is a marvel !
-
JimCA at 10:03 AM on 15 February 2022CO2 emissions do not correlate with CO2 concentration
The following paper tries to argue that CO2 from fossil fuels accounts for only a small percentage of the increase we've seen, using some hand-waving arguments about C14.
It's published in an obscrure journal on the health effects of radiation, and has zero citations, but seems to be gaining traction among denialists.
Maybe worth a detailed rebuttal?
https://journals.lww.com/health-physics/fulltext/...[and so on]
Moderator Response:[BL] Thanks for mentioning this paper. The SkS team has been told about this recently, and some sort of response is in preparation.
Link text shortened and link activated.
The web software here does not automatically create links. You can do this when posting a comment by selecting the "insert" tab, selecting the text you want to use for the link, and clicking on the icon that looks like a chain link. Add the URL in the dialog box. -
nobodysknowledge at 09:37 AM on 15 February 2022It's albedo
Re. MA Rodger. Cloud Area Fraction calculation, as presented from Dübal and Vahrenholt.
"The terms “cloudiness” and the CERES term “cloud area fraction” have different definition and methodology but both are associated with the cloud cover. The cloudiness is currently ca. 61.3% whereas the cloud area fraction from CERES is ca. 67.5%. Nevertheless, from Figure 8 it follows, that a change of cloud cover by 1% would cause a change of the TOA global net flux of 0.26 W/m2 so that the drop of 1.86% of cloudiness in Figure 9 could have caused an effect of ca. 0.5 W/m2, a large portion of the observed average value for 2001–2020 (0.8 W/m2)." The 61,3% cloudiness is from WHO, and seems not to be quite reliable when taken together with Earth Energy Imbalance. It is a weekness of the paper that measurements of cloud area fraction are not presented.
An exampel of calculation: «“LW Surface Down Cloudy” in Figure 11c changes from 360.07 to 357.88 W/m2 = −2.19 W/m2 . Multiplied by 0.674 (67.4% cloud area fraction) gives a contribution of −1.48 W/m2 from 2001 to 2020. «
-
michael sweet at 06:10 AM on 14 February 2022Third-costliest year on record for weather disasters in 2021: $343 billion in damages
David-acct:
SInce we want to compare apples to apples perhaps we need to consider that modern buildings are built to withstand extreme weather better than older buildings are. This summer I had to replace my roof here in Florida. Part of the cost was to compeltely renail the roof to the rafters because code now requires about twice as many nails. They also use more nails to fasten shingles to the sub roof. After making those appropriate adjustments, the increase in disaster costs is much greater than that presented in the article.
Data easily Googled compare the amount of increased damage from geological disasters (like earthquakes and volcanoes) to the amount of increased damage from weather. These are both affected by population increase and wealth increase. We find that weather changes cause much more damage than geological changes. This indicates that AGW is causing much more damage than would be expected if the climate was not changing. I have not bothered to link the data since you do not provide data links to support your wild claims.
-
MA Rodger at 23:52 PM on 13 February 2022It's albedo
nobodysknowledge @118,
I would suggest that Dübal and Vahrenholt (2021) is not a reliable paper due to both its simplistic use of climatological data and its bizarre theorising which has more to do with climate change denial than the science of climatology.
That said, you make criticisms of Dübal and Vahrenholt (2021) of which they are not guilty.You are correct that their Fig 15 (not Fig 14 as you reference) that Dübal and Vahrenholt call a "bridge-chart" shows values for 'Clear Sky' and 'Cloudy' which are significantly different from the values show elsewhere in the paper (which you call "trend"). This discrepancy is because Fig15 firstly is not using the "trend" values but using the difference between the 2020 values and the 2001 values, (a point you do mention) and secondly and more significant, these end-point values are converted to 'global' values, thus with 'Clear Sky' values being multiplied by the relevant [1 - Cloud Fraction] and 'Cloudy' being multiplied by the relevant [Cloud Fraction]. The Cloud Fraction values CA shown in their Fig 9 suggest CA[2001] = 61.33% & CA[2020] = 61.5%. I assume Dübal and Vahrenholt's arithmetic does not conceal errors.
And I would entirely disagree with your assertion that folk "are not taking the attribution problem serious."
-
nobodysknowledge at 21:28 PM on 12 February 2022It's albedo
Thank you for your presentation of the Dübal and Vahrenholt 2021-paper blaisct. I think there is a good overall agreement to the CERES data presented by Loeb et al 2021. I have commented this at Science of Doom.
The Dübal and Vahrenholt paper, Radiative Energy Flux Variation from 2001–2020, have got some attention. And for good reason. It is an important discussion. But there are some problems with some of the claims that are made.
«Radiative energy flux data, downloaded from CERES, are evaluated with respect to their variations from 2001 to 2020. We found the declining outgoing shortwave radiation to be the most important contributor for a positive TOA (top of the atmosphere) net flux of 0.8 W/m2 in this time frame.»
According to the CERES data they present (TOA all sky), the trend is LW out 0,28 W/m2/decade (cooling), SW out -0,70 (warming), and solar reduction 0,03 (cooling), wich gives a TOA warming trend of 0,39 W/m2/dec. So far so good. And in good agreement with Loeb et al 2021. EBAF Trends (03/2000-02/2021) 0.37 + 0.15 Wm-2 per decade.«The declining TOA SW (out) is the major heating cause (+1.42 W/m2 from 2001 to 2020).»
Trend SW out all sky -0,70 W/m2/dec withsolar reduction included (0,70 W/m2/dec TOA warming). Gives 1,40 W/m2 over 20 years. This major heating is composed of SW clear sky heating trend of -0,37 W/m2/dec and a SW cloudy sky heating trend of -0,78 W/m2/dec. In the TOA radiation energy bridge-chart (figure 14) this is shown as SW clear sky increase of 0,15 W/m2 and SW cloudy areas increase of 1,27 W/m2. And the solar change impact is -0,17 W/m2 for 20 years. A great difference between trend and energy bridge-chart.
Loeb et al has a SW TOA heating of 0,63W/m2/dec through albedo change, with clouds increasing absorbed SW Flux 0,44W/m2/dec and surface increased absorption 0,19W/m2/dec. In good agreement with Dübal and Vahrenholt. EBAF Trends (03/2000-02/2021) 0.68 + 0.12 Wm-2 per decade.«It is almost compensated by the growing chilling TOA LW (out) (−1.1 W/m2).»
But as we have seen, the trend is only 0,28 W/m2/dec. This is composed of LW TOA flux clear sky 0,04W/m2/dec and LW cloudy sky 0,35 W/m2/dec. How can they claim so big «chilling» longwave cooling? It looks like they use the startpoint and endpoint of a graph, and that the «chilling» cooling at TOA was for the year 2020 relative to 2001. In the TOA radiation energy bridge-chart (figure 14) this is shown as LW clear sky increase of 0,46 W/m2 and LW cloudy areas increase of 0,64 W/m2. I think what is presented in the bridge-charts is close to cherrypicking.
Loeb et al EBAF Trends (03/2000-02/2021) -0.31 + 0.12 Wm-2 per decadeThe Dübal and Vahrenholt calculations for cloudy areas are clearly showing how thinning of clouds is the greatest component of global warming for the last 20 years, and probably for 40 years when we read the papers of M Wild and other cloud scientists. So when some say that the AGW is the cause of all global brightening or of all increase in water vapor, they are not taking the attribution problem serious. Increasing surface and atmospheric temperatures is contributing a lot, but there is a great complexity behind all this.
-
David-acct at 11:59 AM on 12 February 2022Third-costliest year on record for weather disasters in 2021: $343 billion in damages
I alway like to compare apples to apples.
In this case, the adjusting the data for inflation adjusted values is a good start. Though, the comparison should also be adjusted for population growth and after inflation adjusted growth in wealth.
World population increased from 4.4b in 1980 to 7b in 2020 , US population increased from 227m in 1980 to approx 330m in 2020.
Per capita net wealth likewise increased (after adjusting for inflation) during that time period .
After making those appropriate adjustments, the increase in disaster costs is much more modest that presented in the article
-
MA Rodger at 03:42 AM on 11 February 2022Mars is warming
Waking2Kindness #[cSSw#d0h @58,
Your correction should perhaps be subject to a bit of give & take.
Thus you are correct that the Sun gives out 1367Wm^-2 of TSI to the Earth. But this is for the disc of the Earth famously od area πR2.
The Earth takes this TSI over its entire sphere of area 4πR2 and of this 30% is reflected back into space. Thus the actual planetary warming totals [70% of 1366 / 4 ≈] 240Wm^-2.
-
Waking2Kindness #[cSSw#d0h at 03:11 AM on 11 February 2022Mars is warming
The common est. of Earth's TSI [ Total Solar Irradiance ] is actually
ca. 1365 W/m2 [ Watts per square meter ; properly "W/m^2" ] \
( Right now, 2022 Feb., it's measured at 1366 W/m^2 , w/ a variance thru the most recent solar cycle of 1.6 W/m^2 \ )
( Just one of myriad sources for this : LINK )
( This was just to correct an earlier commenter's mis-quote of it , as "240 W/m2" \ )
\\
Moderator Response:[DB] Shortened link breaking page formatting
-
MA Rodger at 23:36 PM on 10 February 2022It's albedo
blaisct @115,
And concerning your second question - "If all the global warming, GW, came from CO2 radiative forcing alone would not a graph like @111 be flatter...?"The 'graph @111' is Fig 3 of Dübal & Vahrenholt (2021) and specifically shows a quite-dramatic reduction in albedo 2001-20 with a trend of -0.70Wm^-2/decade. Fig 1 shows a reduction in solar of -0.03Wm^-2/d. Thus Figs 1 & 3 matches Loeb et al (2021) Fig 2d with Absorbed Solar 2002-20 given as +0.67Wm^-2/d. Loeb et al Fig 2d also presents an attribution of this increased absorbed solar warming 2002-20, ☻ 60% cloud albedo, ☻ 7% water vapour, ☻ 4% GHGs, ☻ 26% surface albedo, ☻ 3% aerosol. And note also that Loeb et al Fig 2a shows this 'quite-dramatic' effect occurs almost totally 2013-20.
To explain this attribution; if 4%+7% of this increase-in-Absorbed Solar (decrease-in-albedo) is attributed to GHGs, this means additional GHGs+water-vapour is directly preventing solar being otherwise reflected away and instead directly absorbed by the increased GHG+water-vapour. The underlying cause for the water vapour increase is of course AGW.
Your question implies that you consider there is something other than AGW and increased CO2 driving a significant part of this increase-in-Absorbed Solar (decrease-in-albedo) 2002-20. I don't think I could agree.
Loeb et al does identify the geography of the various components of the net EEI, mapping them out in Fig 3 and pointing to the Surface effect being "greatest in areas of snow and sea-ice, where significant declines in coverage have been observed in recent decades." It is, of course, easy to see that the ice-loss is due to AGW.
And for the biggest component, Cloud, Loeb et al says "Regional trends in net radiation attributable to changes in clouds are strongly positive along the east Pacific Ocean, while more modest positive trends occur off of the U.S. east coast and over the Indian, Southern, and central equatorial Pacific Oceans." Is this the finger print of AGW? If it isn't, it would require an alternative causation.
If AGW is the cause, note that the increase-in-Absorbed Solar (decrease-in-albedo) 2002-20 is mainly occuring 2013-20 which matches the global temperature record showing 70% of the 2002-20 warming occurred in the period 2013-20.
So without further explanation, I see no reason to expect a "flatter" slope from CO2-forcing alone, the slope being presumably all down to AGW.
-
Wol at 10:44 AM on 10 February 2022New book: Wales - The Missing Years - a celebration of origin
>>The oldest rocks we know of, here in Wales.....<<
A comma makes all the difference!
-
MA Rodger at 00:09 AM on 10 February 2022It's albedo
blaisct @115,
The Wiki reference you cite giving 0.8 is presumably this paragraph which provides a statement of Equilibrium Climate Sensitivity with ΔTs = λ ΔF and λ = 0.8ºC/Wm^-2.
With ECS usually given as the ΔTs for a doubling of CO2 where ΔF = 3.7Wm^-2, ECS = 3ºC. This is the usual 'central' value given for ECS. IPCC AR6 Ch7 calls 3ºC "the best estimate."
"Based on multiple lines of evidence the best estimate of ECS is 3°C, the likely range is 2.5°C to 4°C, and the very likely range is 2°C to 5°C."
But this increase in EEI for the period 2001-20 cannot be used as a value for ΔF in ECS equations.
-
One Planet Only Forever at 13:28 PM on 9 February 2022SkS Analogy 1 - Speed Kills: How fast is too fast?
This comment includes some repetition, but here are my thoughts, as an ethical engineer, regarding the ‘speed’ of ‘sea level rise’.
I started reading Chapter 13 of the IPCC AR5 WG2 Report hoping to find a reasonable indication of the amount of sea level rise that is likely per degree C of global warming impact. There are many complications, not the least of which is how long the temperature remains warmer after human activity impacts stop causing increased GHG concentrations.
Chapter 13 includes the following: “For the period 2081–2100, compared to 1986–2005, global mean sea level rise is likely (medium confidence) to be in the 5 to 95% range of projections from process-based models, which give 0.26 to 0.55 m for RCP2.6”. And there would be additional sea level rise after 2100 in RCP2.6. Chapter 13 also provides the following low end estimate of future sea level rise: “The few available process-based models that go beyond 2100 indicate global mean sea level rise above the pre-industrial level to be less than 1 m by 2300 for greenhouse gas concentrations that peak and decline and remain below 500 ppm CO2-eq, as in scenario RCP2.6.”
That leads to understanding that there is a significant lack of certainty regarding the consequences of human climate change impacts. But the low end of possible impacts is significant, especially the uncertainty regarding the end magnitude of the climate change impacts. That means there is currently significant uncertainty regarding what the final changes that have to be adapted to will be when humans stop causing accumulating climate change impacts.
As an engineer I, and hopefully other engineers, would take the position that actions causing highly uncertain risk of harm should not be continued, and should be rapidly decreased, ideally being stopped immediately. Continuing or increasing the activities that are producing the understandably harmful accumulating impacts would not be allowed by responsibly engineers until the uncertainties are significantly reduced. That is the ethical position to take when faced with high uncertainty regarding the need to ensure that there is an acceptably low chance of harmful results.
From an responsible ethical engineer’s perspective, even if a structure is built and being used, as soon as the potential risk of a significant harmful result is identified the responsible thing to do is to stop using the structure until the risk of harm is reduced to an acceptable low level. A common safety level for structure design codes is to have less than a 2% chance of a harmful result.
Returning to the Chapter 13 point above, the sea level rise for 5% chance of harm is 0.55 m by 2100 in RCP2.6 with more rise occurring after 2100. Designing seafront developments, and revising existing ones, to have a 98% chance of adequate performance in 2100 would need to be based on more than 0.55 m rise in RCP2.6. And a higher sea level rise would be the required basis for features that are hoped to be sustainable past 2100. And even more sea level rise would need to be the basis if a scenario of higher impact than RCP2.6 occurs.
Going back to the ethical considerations, the beneficiaries of the harmful activities in the current generation have an ethical obligation to ensure that there is only a very small chance that Others, especially future generations, have to expend their effort adapting to climate change impacts they did not significantly benefit from the creation of. And the people benefiting cannot be trusted to do the evaluation of the risk and magnitude of harm done.
Given the significant uncertainties of the harm being done by climate change impacts, a significant amount of ‘corrective action’ is required from those who benefit(ed) most from the harm being done. And that corrective action includes rapidly reducing how much they benefit from the harmful activity. And ‘self interest’ would powerfully motivate the beneficiaries of the harmful action to incorrectly evaluate the risk and magnitude of harm done.
And, regarding the adaptations that current humans should be making to reduce the harmful need for future adaptation, the ethical understanding is that it is harmful for current day people to benefit from living in ways that future generations cannot continue, with the related ethical understanding that requiring future generations to adapt to future changes, which is a distraction from pursuing sustainable improvements, is harmful to them.
The development of sustainable improvements for the future of humanity requires a reasonable certainty of the maximum magnitude of climate change impacts, not just a slower rate of change. A massive amount of human development, especially things like food production in the Bangladesh delta region, is at risk of harmful impact from sea level rise. And some of it is already seriously harmed by the 0.3 m sea level rise that has occurred over the past 100 years.
Also, it is important to note that there are other harmful impacts of climate change that deserve consideration. The discussion of sea level rise should be clarified to be only one of many harmful impacts of climate change. Believing it is possible for future generations to ‘deal with’ 0.3 m sea level rise every 100 years is incorrect by itself. When all the other harmful impacts of climate change are considered, the acceptability of far lower rates of climate change being imposed on future generations can be understood to be unacceptable.
............
So, the concern about sea level rise is far more than a concern about the rate of change. Admittedly, if the rate of change due to human action was less than 0.3 m in 1000 years it could be argued that rebuilding or adapting human development could potentially be expected to ‘keep pace’. But even that ‘ability to adapt’ has to come with an admission that some things that could last for 1000 years or more would be ruined by the human caused sea level rise. It also has to be admitted that ‘accepting human imposed sea level rise, or other climate change impacts’ also requires the admission of the need for current day humans to rapidly transition to sustainable ways of living, including revision of things that have already been developed in order for them to be sustainable.Without rapid transition to sustainable development, seaside developments would have to be rebuilt constantly, a major distraction from sustainable development efforts. That would be more than just replacing buildings. It would include completely relocating developed areas and features like sewage collection and treatment systems.
That understanding leads to an engineering solution I am fond of pointing out. If someone asks how they can build a resort area in the mountains to survive potential avalanches, the answer is to not develop anything in areas of the mountains that are prone to avalanches, or to restrict development in avalanche prone regions of the mountains to minor easily rebuilt stuff for short-term use, like day-use. And the related climate change issue is changes of avalanche potential due to climate change. The more rapid and more significant the climate change is likely to be the more restrictions there should be on development in mountain areas. When there is less certainty regarding changes of avalanche risk (uncertainty of the rate of change of risk, or a rapid rate of change, or uncertainty about the ultimate maximum magnitude of change of risk when the human induced climate change is stopped), or uncertainty regarding the actual changes of avalanche risk due to a certain amount of climate change impact, then human development needs to be kept out of larger areas of mountain regions. And already built human developments need to be removed from that larger area.
Considerations of human caused sea level rise leads to similar thinking, recommendations and restrictions for seafront development. Without certainty regarding the peak climate change impacts, seafront regions should be planned to be abandoned. Human development should be kept well back from seafronts and also be kept out of low lying regions that would be subject to future flooding by sea level rise. Those areas should be restricted to temporary development for short-term use. Restricting the seafronts to day-use only would also reduce the risk of storm harm to humans. There would be less need for mass evacuations on short notice. And Project Drawdown led by Paul Hawken and Amanda Joy Ravenhill, and other sources, mention other benefits of undeveloping and rewilding seafront regions.
But the more challenging aspect of the sea level rise or avalanche risk issues, more challenging than revisions of what humans build, is the impacts on more essential human development like food production in river delta regions. That is a ‘more essential’ use of a region that is at risk of being less able to be adapted to suit the regional climate change impacts. A critical understanding is the importance of the need to protect the sustainability of the ‘diversity of regional environments that humans essentially require’ from human climate change impacts. And it leads to the awareness that all harmful human impacts on the environment are a concern because humans can only be certain to survive if they are ‘part of the diversity of life on this amazing planet’. Technology can help. But the environment is essential. And the diversity of life needs a reasonably stable environment, an environment that is not rapidly or significantly changed by human activity.
The UNEP 2022: Emergency mode for the environment, published January 6, 2022, identifies the “... enduring crises of climate change, biodiversity loss, and pollution and waste.” That is far more than climate change. And it all matters, not just climate change.
It is also essential to be aware that the climate change concern is not restricted to sea level rise. There are many different harmful impacts of climate change, not just sea level rise (or changes to avalanche risk).
In closing, developing a sustainable and improving future for humanity does not just mean reducing the rate of climate change impacts. It also requires more than ending climate change impacts. More than Net-Zero by 2050 is required. Limiting the magnitude of the peak impact is key. So ‘slowing down the rate of harm done as rapidly as possible’ is better than ‘going slower on the slowing down of harmful impacts in the unethical hope that more rapid slowing down will be done by Others in the future’. And it is even less ethical to believe and claim that future generations will be able to deal with whatever gets imposed on them.
Post closing: Drawing down CO2 levels to 350 ppm ‘even if drawing down CO2 levels is unpopular or not profitable’ would also be an ethical thing to do. And it is easier to do if the peak climate change impact is smaller.
-
blaisct at 08:32 AM on 9 February 2022It's albedo
MA Rodger @114
Thanks again. You caught me in one of my dyslexic moments. That conversion factor should have been written as 0.5 ‘C/(W/m^2). Or 0.45’C/(0.5 ‘C/W/m^2) = 0.9 W/m^2. Your note, forced me to look again for the derivation of it: It is not a conversion factor, it is a statistical relationship that can vary according to the author and subject of a paper, that’s why I found a range of 0.5 to 0.7, Wikipedia gives 0.8. In which case, the graph @111 has its own statistical relationship of 0.45’C/1.3 W/m^2 = 0.35 ‘C/(W/m^2) and does look different than other statistical factors, having the lowest observed temperature rise per W/m^2. I am not sure that means anything. It does negate my first question. I will rephrase the second question: If all the global warming, GW, came from CO2 radiative forcing alone would not a graph like @111 be flatter and this “conversion factor” be very high? Indicating the other factors listed above (0.5, 0.7, 0.8 ‘C/W/m^2) may have some effect of CO2 caused GW in them and @111 the lowest?
Small bites of the apple are working. -
MA Rodger at 00:17 AM on 9 February 2022It's albedo
blaisct @113,
Surely 0.45ºC x 0.5Wm^-2/ºC = 0.225Wm^-2. The Dübal & Vahrenholt (2021) numbers put the 2001-20 19-year increase in Absorbed Solar at +1.27Wm^-2 (+/- 0.26, so 1.53 to 1.01). With the 0.5 convertion factor you state you used, that would be 1.27 / 0.5 = 2.54ºC (or 3.06ºC to 2.02ºC). The alternative 0.7 convertion factor you mention would yield 2.19ºC to 1.44ºC.
As for these 0.5 and 0.7 convertion factors, simple physics tells us a planet with 240Wm^-2 solar warming would require a factor of 3.7Wm^-2/ºC. But with the oceans to be warmed, that is a process that would take centuries not 19 years of slowly increased warming, a process which is also complicated by feedback mechanisms.I would attempt to assist in putting your analysis back on the rails but I'm not entirely sure what it is you are about and also a little conscious that you are referencing Dübal & Vahrenholt (2021) which drinks rather deeply at the well of denialism.
That said, you appear not to be accounting for AGW prior to 2001 and attempting to analyse climate numbers 2001-20 in isolation. But AGW has been running at a pretty constant rate since the 1970s with only recently the first signs of a bit of acceleration. Simply attempting to isolate the period 2001-20 from the on-going AGW is always going to end in tears.
-
blaisct at 09:17 AM on 8 February 2022It's albedo
MA Rogres @112
The +0.45'C X 0.5 W/m^2/'C. I copied that conversion factor from other posts on the internet. I have looked for the derivation of it and cannot find it. I have also seen 0.7 W/m^2/'C used. I would love to find the derivation or use the correct one.
As for the slope difference. Put the temperature line I suggested on the same graph and you will see the temp (W/m^2) stays just within the confidence intervals of the graph - close enough, I did not say perfect but almost perfect. -
MA Rodger at 10:33 AM on 7 February 2022It's albedo
blaisct @111,
You say you want to "take smaller bites out of albedo apple" which is probably advisable and presumably it is also advisable to start from the first "small bite."
So we have set out in Dübal & Vahrenholt (2021) for the 19 year period 2001-20 a trend in 'Incoming Solar (TOA)' of -0.0035Wm^-2/yr and a trend of 'Shortwave Out (TOA) ' -0.0704Wm^-2/yr of and thus an inferred trend in 'Absorbed Solar' of +0.0669Wm^-2/yr which would thus equate to +1.27Wm^-2 'Absorbed Solar' over the 19 years. So far so good.
You then assert that the "change in global temperature over the CERES time period is about +0.45ºC" which is a reasonable value for global SAT 2001-20 although its best if its derivation was properly explained. But, so good so far.
You then assert that this temperature increase of +0.45ºC is in some way equivalent to +0.9Wm^-2 per 20 yrs. That step does certainly need explaining.
And if that explanation is convincing (warning - that is very unlikely to happen), when that explanation is provided, it would help why the discrepancy between 0.9 and 1.3 can also allow the two to be considered as "an almost perfect fit."And when these "small bites out of albedo apple" have been digested, the relevance of your first question may be more evident.
-
blaisct at 04:24 AM on 7 February 2022It's albedo
Ref my @104 and @106 replies
Thanks again for the comments. I can see that I need to take smaller bites out of albedo apple in the CERES data. Let me start with Hans-Rolf Dübal et al 2021 graph of CERES data.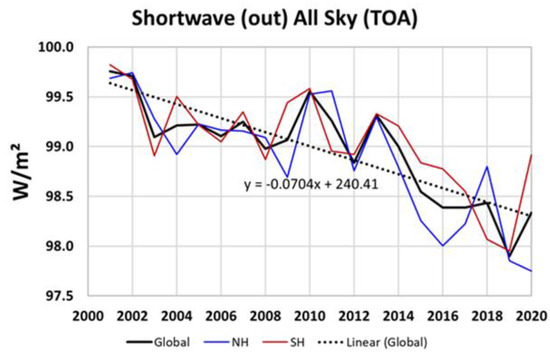
Hans-Rolf Dübal et al 2021 does not have an official albedo change graph (change in sun’s energy out -change in sun’s energy in). The graph above needs to be correct for the small (-0.07 W/m^2/20 years) in coming energy (correction is: -1.3W/m^2/20 years). My post @104 has that correction in a graph. The change in global temperature over the CERES time period is about 0.45’C or -0.9 W/m^2/20 years. Over laying that on the graph above one can see an almost perfect fit (slightly higher slope for CERES data) (can’t show that in this format).
First question: Does an almost perfect fit of global temperature to CERES albedo (in W/m^2) mean albedo is the main cause of global warming for the 20 years of CERES data? (Regardless of what caused the albedo change or the short 20 years of data)
Second question: Should the slope of the albedo graph above be different (flatter) than the actual global temperature if CO2 caused radiative forcing was at work; since, CO2 caused radiative forcing does not use albedo change energy to cause global temperature rise?
Any answer to these questions would help me understand the CERES data before exploring what caused the albedo change in CERES data. -
BaerbelW at 01:29 AM on 7 February 2022Veganism is the best way to reduce carbon emissions
Posting a comment to give credit where credit is due and to ensure that it doesn't fly under the radar:
The current version of this rebuttal (published Feb 2, 2022) is basically a complete rewrite of the earlier text and happened because Klemet offered to work on this task (see his comment above from February 2021). This new version was reviewed by two experts who provided helpful comments in the course of the rewrite.
Thanks for your work on this, Klemet!
-
michael sweet at 00:28 AM on 7 February 2022Skeptical Science New Research for Week #5 2022
The Guardian had an interesting article where they determined how much the temperature had increased since 1895 and since 1970 in different counties in the USA. They determined that the temperature has increased more than 1.5C since 1895 for more than a third of the population. In the southern states many counties have had a decrease in temperature since 1895. The greatest increases were in Alaska where records only go back to 1925. Ventura County in California increased 2.6 C since 1895 (4.7F).
It is expected that warming will not be the same everywhere. The increase in temperatures over land worldwide are greater than the increases over the ocean. The average increase in the USA is about 1 C, which is close to the global average.
It would be interesting to see a similar calculation for places worldwide.
-
Jan at 20:07 PM on 6 February 2022Skeptical Science New Research for Week #5 2022
HI, i read always many of the studies and i write a book on all the changes in the Earth system - so your site is one of my important trackers ;)
And funny so that it's the critical blockchain paper that steered interest.
Just let's say to invent a money that uses up energy when used is in our times one of the stupidest things to do ever :D
If the road to extinction of humanity would not be so said it would be hilarious...
-
Doug Bostrom at 10:30 AM on 6 February 2022Skeptical Science New Research for Week #5 2022
Thank you for your comment, Eric.
My thought is that the authors are pointing to a likely outcome of synthesis of a kind. Market forces in combination with regulation, regulation being our backstop for when human nature fails us and we need to agree to create a virtual "adult in the room" to check our worst impulses.
But mostly I'm here to say that it's great to see somebody reading a paper, tackling a primary source, thinking about implications. That's a major reason for being of NR. You've added energy and impetus to our enterprise— thank you!. :-)
-
prove we are smart at 08:08 AM on 6 February 20222022 self-paced run of Denial101x starts on February 8
Skeptical Science was where I gained most of my understanding of global warming quite a few years ago now. Really hoping an informed public will eventually vote in the leaders we deperately need now..
-
Eric (skeptic) at 01:07 AM on 5 February 2022Skeptical Science New Research for Week #5 2022
I read through the linked paper:
Each single Ethereum transaction is estimated to cause 85.47 kgCO2 (29) resulting from the mining devices involved in verifying the transaction, and there were 942,812 NFT sales in the month preceding October 10, 2021. (30) Assuming that NFT transactions on the Ethereum blockchain have the same carbon footprint as other transactions on the Ethereum blockchain, and based on the assumption that 4434 metric tonnes could kill a person unnecessarily, the mining devices needed to verify 51,877 transactions would produce enough emissions to kill a person between 2020 and 2100.
Essentially, in ref 29, they use the transaction cost in Ethereum as a proxy for energy use by estimating the portion of the mining earnings used to purchase energy. Ethereum's own estimate is 84 kWh per transaction https://ethereum.org/en/energy-consumption/ which means about 35 kg CO2 per transaction with natural gas: https://www.eia.gov/tools/faqs/faq.php?id=74&t=11
They assume there are no other benefits to that expense such as other smart contracts being stored in the Ethereum blockchain rather than on paper. I think the most important shortcoming of the paper is the assumption that the marketplace will fail at energy reduction because:
Blockchain developers are, however, cautious to move away from a tried-and-tested blockchain model with its security advantages [12] and acceptable ability to maintain Byzantine fault tolerance [13].
That does not appear to be correct: https://pixelplex.io/blog/top-ten-blockchains-for-nft-development/ With price as a proxy for energy use, there are many orders of magnitude of savings with ethereum competitors. The bottom line is that blockchain tech evolution is not just proof that proof-of-work works, it's proof that marketplace innovation works.
-
manzoorhmemon at 15:17 PM on 4 February 2022Skeptical Science New Research for Week #2 2022
A great collection of articles on the focused area of climate change. Really appreciate.
-
Bob Loblaw at 03:56 AM on 4 February 2022From the eMail Bag: a review of a paper by Ziskin and Shaviv
DesmogBlog's entry on Shaviv now has a link to this blog post....
-
One Planet Only Forever at 08:17 AM on 3 February 2022SkS Analogy 1 - Speed Kills: How fast are we going?
Evan @10
That presentation of thoughts is indeed aligned with my current thinking, which I openly admit is ‘not the norm’, and which is open to improvement.
The following may be more than needs to be presented as further clarification. It should not change your understanding. But it leads to other thoughts related to nigelj’s point @8 and your comment @9 about the magnitude of impacts that are presented in the newer version of the SkS Analogy 1. I plan to make comments about that there.
The basis for my thoughts is what I would call ‘idealized ethics’. My thinking is based on Professional Engineering Ethics which are fairly thoroughly presented in the APEGA Guideline for Ethical Practice, supplemented significantly by the more fundamental ethical considerations developed and shared by Derek Parfit in his effort to develop a secular understanding of ethics that he presented in his 1984 book Reasons and Persons (and lots of other ethics related reading – including the basis for the Sustainable Development Goals).
I would clarify ‘idealized ethics’ to be: An ideal governing objective for human thoughts and actions in order to develop sustainable improving conditions for the diversity of humanity and its diversity of civilizations living as sustainable parts of the robust diversity of life on this planet now and into the distant future. That understandably includes the correction of harmful developed systems and activity and making amends for the harm done.
And I would currently briefly express the best way to achieve that ‘ideal objective’ as: Pursuing increased awareness and improved understanding in order to constantly learn to: Do No Harm and Help Others, especially helping those who have been or are being harmed.
I consider the ‘current norm’ discussions of ethics and related ‘development and application of rule of law’ (and the history of ethics and rule of law discussion) to have been harmfully compromised by the developed systems or ‘games of pursuit of personal benefit and perceptions of superiority relative to Others’. That competition can lead people to evaluate the Greater Good for current living humans without proper consideration of future humans (refer to the ways that people like Lord Monckton tried to justify more harm being done to future generations by significantly discounting, and underestimating, the future harm), and with harm being done to portions of the current population (see the ways that many people try to argue against ‘the more fortunate being obliged to help the less fortunate’). And the harm being done is also poorly justified, including claims that the perceived benefits obtained by those who benefit outweigh the perceptions they have of the harm done. The people who benefit most from the harmful activity can also be seen to misleadingly claim that people who are harmed are also benefiting so it is All is for the Greater Good (from the perspective of the people who benefit the most).
A key Ethical understanding is that Do No Harm means that no Person is to be ‘net-harmed’ by an action. Medical ethics are a clear example of that understanding.
Also note that future humans, and many less fortunate current day humans, have little or no influence. They lack legal standing, cannot vote, and cannot effectively question or challenge what is being done that alters the conditions or environment that the people being harmed have to deal with.
-
nigelj at 06:55 AM on 2 February 2022From the eMail Bag: a review of a paper by Ziskin and Shaviv
Bob, yes I think you were wise to stick to the paper itself. I assumed you would have known his history anyway. We can raise that sort of thing in the comments.
I'm just intrigued by what makes these denialist / very sceptical characters tick psychologically, probably partly because I did a couple of psychology papers at university.


