


 Arguments


Recent Comments
Prev 915 916 917 918 919 920 921 922 923 924 925 926 927 928 929 930 Next
Comments 46101 to 46150:
-
Nick Palmer at 04:03 AM on 16 April 20132013 SkS Weekly Digest #15
Thanks moderator. Working now. It's really worth checking out for the refreshing forthrightnes of the language
-
Antarctica is gaining ice
Rob Honeycutt - That passage apears to be from the 1990 IPCC FAR report, chapter 9, page 27.
Kevin - Two notes. First, list your references.
Second, do you honestly think that the science wouldn't be updated in the last 23 years? Sea level contributions and cryosphere mass balance are still under investigation, and cryosphere contributions to sea level are still at a somewhat lower certainly in the 2007 AR4 report. Not to mention that the last 23 years of warming will have changed the situation somewhat.
Current measures (including GRACE mass measures) indicate a net loss of Antarctic land ice. Mass balance includes both accumulation (increased snowfall due to higher absolute humidities) and loss (increased melting at the coasts due to warmer sea water). Snowfall can increase and Antarctica still lose mass, because there are two terms to that balance.
-
Bob Lacatena at 04:00 AM on 16 April 2013Antarctica is gaining ice
Rob,
Here's the link to the chapter from the First Assessment Report, published in 1990. The reason for the typos is that the PDF online is a scan (image), not text, so it had to be transcribed. See section 9.4.5, and as usually, read the entire thing, not just the cherry-picked section chosen by a denier for a quote... particularly things like the opening line ("The question of the balance of the Antarctic ice sheet proves to be a very difficult one from a physical point of view...") and later ("It must be stressed that the inference of ice mass discharge from a limited number of surface velocity measurements involves many uncertainties."). The quote in question is on page 273.
So Kevin's complaint appears to be that in 1990 (23 years ago) scientists did not perfectly understand and predict exactly what would happen a quarter of a century later as a result of climate change. And we should "update" the current rebuttal to properly reflect what scientists didn't perfectly understand 23 years ago.
[You just can't make this stuff up.]
-
Kevin8233 at 03:52 AM on 16 April 2013Antarctica is gaining ice
The link is;
It is the First assessment. Chapter 9, page 273.
Increased snow accumulation at higher altitudes has long been predicted and known.
This is not about high altitudes, this is about the antartic (which has a lot of land at high altitudes but..). The assessment is saying that there will be ice build up (snow build up - same thing as snow that gets piled on becomes ice) in the interior, with a net result of, a positive build up of ice through out antartica, not a loss.
The SkS thread clearly states that there will be a net loss, so again, clearly something is amiss.
Moderator Response:[RH] Fixed link that was breaking page formatting.
-
Rob Honeycutt at 03:35 AM on 16 April 2013Antarctica is gaining ice
On first pass, other than the weirdness, it sounds like the passage is discussing snow accumulation rather than ice. But without a reference it's hard to know. Increased snow accumulation at higher altitudes has long been predicted and known.
-
Rob Honeycutt at 03:31 AM on 16 April 2013Antarctica is gaining ice
Kevin... Can you provide an actual link to that passage. The strange formatting and spelling make me question the source.
-
Kevin8233 at 02:20 AM on 16 April 2013Antarctica is gaining ice
Composer99,
Here is the ambiguity.
Support for the idea that higher temperatuics will lead to
significantly largei accumulation also comes horn observations
on the Antarctic Peninsula Over the past "?() yeais
temperature has gone up here by almost 2°C, wheieas
accumulation increased by as much as 2 W in paiallel with
this (Peel and Mulvaney, 1988) Although this cannot be
taken as proof of a causal relationship it is in line with the
sensitivity estimates listed in Table 9 7 which span a lactoi
ol two
In summary, all quoted studies show an inciease in
accumulation with warming and thus a decrease in sea
level An ablation zone does not effectively exist in
Antarctica, and a laige wanning would be icquired in older
for ablation to influence mass balance
That is a quote from the first assessment. It clearly predicts that there should be an increase in Land ice in Antartica. The SkS thread here says that there should be a decrease in Land ice. One of these predictions is obviously in error.
-
Jubble at 01:56 AM on 16 April 2013Further Comments on The Economist's Take on Climate Sensitivity
I realise that this comment is not strictly related to the article, and would understand if it is not approved.
I recently read the article "The Joy of Global Warming" in the News Review of the Sunday Times (printed 31 March 2013). The synopsis at the start read "Climate change can be good for us and we are wasting billions trying to fight it before we need to". Have you at Skeptical Science read this article, and are there any plans to respond to it? If it is misleading or inaccurate, I would be happy to register a complaint about it via the UK Press Complaints Commission.
-
Composer99 at 01:37 AM on 16 April 2013Antarctica is gaining ice
Kevin:
As far as I can see there is no ambiguity. The behaviour of Antarctic land ice along the coast is not the same as the behaviour of sea ice.
-
KK Tung at 01:16 AM on 16 April 2013The anthropogenic global warming rate: Is it steady for the last 100 years?
Replying to post 27: Yes, that is the main takeaway. The aerosol residence times are short, and so if China and other developing countries decide to clean up their air, the net anthropogenic withalwithal go up very quickly.
Replying to post 26: They are all competing net heating profiles in the sense that they all lie within the range of uncertainty of aerosol cooling stated in IPCC AR4.
-
vrooomie at 00:55 AM on 16 April 20132013 SkS Weekly Digest #15
Nick Palmer, your link seems to be a misdirect, back to SkS.
-
Bob Lacatena at 00:24 AM on 16 April 2013Antarctica is gaining ice
Kevin,
Why does an increase in snowfall need to lead to an increase in land ice? And why would any increase in land ice need to remain as a constant, unchanging effect? A the same time, why do the models have to perfectly predict every reaction in a complex event never before seen by man? If the models got a single thing wrong, at some point in time, then that means all of climate change theory is wrong and we can just ignore it all?
I think you need to be more specific about what your questions (or criticisms) are. As it stands, your comment seems to demonstrate nothing but confusion about some pretty simple issues.
-
Nick Palmer at 23:29 PM on 15 April 20132013 SkS Weekly Digest #15
It's all over for the "contrarian" industry (I hope). They'll just have to keep their wacky opinions to themselves from now on. The US and China have just issued a joint statement accepting the science, the threat from AGW climate change and the urgency of the necessary action to minimise it.
Here's the full text of the US/China statement 13/4/2013
http://www.state.gov/r/pa/prs/ps/2013/04/207465.htm
Moderator Response:[JH] Link fixed - I hope.
-
Philippe Chantreau at 23:15 PM on 15 April 20132013 SkS Weekly News Roundup #15B
Chris, I'm afraid it's more complicated. In truth, a lot of engineering solutions already exist that, if used concurrently, could limit the extent of the accidental geo-engineering experiment we're witnessing. The problem is political and economic: how to implement these solutions against the already existing ones in which powerful actors have a vested interest. Even the low hanging fruits of conservation and efficiency will be opposed in places like the US or Canada, where people have enjoyed care free energy use forgenerations.
The only true engineering problem that remains is that of energy storage and distribution.
-
Lanfear at 23:10 PM on 15 April 2013Guemas et al. Attribute Slowed Surface Warming to the Oceans
Esop@4 and Glenn Tamblyn@5 regarding arctic temps:
There was a piece of related information in Climate Central, where the claim was that the warm air went up (to the stratosphere).
I have not looked further into this, but thought that you might want to know that the heat may travel upwards too, escaping the system (and the thermometers) instead of just being shuffled around.
-
Kevin8233 at 22:55 PM on 15 April 2013Antarctica is gaining ice
scaddenp,
So you are saying that antartica has a net loss of land ice. But you just said that back as far as TAR 1 that models were predicting a net gain in snow fall, but did they predict a loss of coastal ice? So which is it? That is the point of my last post. There seems to be some ambiguity here.
This whole thread is about how models and reality predict a loss in land ice, and that skeptics are confusing the gain in sea ice as proof of the failure of AGW.
So, again, do the models predict a gain or loss of land ice?
Moderator Response:[JH] Please lose the tone. BTW, there is nothing precluding you from doing your own research on the issues you have raised.
-
Glenn Tamblyn at 22:32 PM on 15 April 2013Guemas et al. Attribute Slowed Surface Warming to the Oceans
Esop
Incorporation of thr Arctic into the SAT records is now better tha it was. GISS always did that. And now HadCru do that better. The satellite products (they aren't really the surface but) extend to 82.5 North. Also, the area of the Arctic isn't that great and, since the SAT's are area weighted averages, doesn't impact as much as it might seem. Could omission odf Arctic have introduced a cool bias in the SAT record? Possibly, although I think it is probably small.
In reality I think we have seen real a slowdown in SAT's over the last decade or so which Ocean effects can substantially explain. Other scientists such as James Hansen lean towards a larger role for increased aerosol concentrations. Either way several things are pretty clear
Heating continues. Sea level is rising - heating. Ice is melting - heating. Oceans are warming - heating.
Given the changes being seen in the oceans, large increases in aerosols due to China, India etc, and a weak Solar Cycle, I think that the more moderate level of atmospheric warming we have seen is actually pretty strong evidence of continued underlying warming.
Not that we actually need that much; last time I checked basic principles in Physics don't turn on and off on a whim.
-
Esop at 21:57 PM on 15 April 2013Guemas et al. Attribute Slowed Surface Warming to the Oceans
Good stuff.
I wonder how much of a cooling bias the fact that large parts of the Arctic, where the warming is dramatic, is not counted/properly compensated for in the global average surface temp. The Arctic keeps spilling cold air into lower latitudes where it goes into the average, while the warm air going into the Arctic is not measured. This cool bias sounds like a denier/disinformer dream come true scenario. The question is how large the cool bias really is, I have a feeling that it is pretty substantial, especially since 2010, with almost constant Arctic outbreaks, especially during the winter months.
-
Kevin C at 21:36 PM on 15 April 2013Guemas et al. Attribute Slowed Surface Warming to the Oceans
Ray: Those are good questions, and the first one has been taxing the authors here. The key point is that the OHC stuff has been unfolding very rapidly over the last few years, and some of the data is pointing in different directions. The community will no doubt be looking very closely at the heat distribution in the oceans as well as its relation to the rest of the climate system over the next few years. If the observational data are sufficiently good then I'd expect a consensus to begin to emerge in 2014/2015.
Satellite measurement of temperatures is really hard. It's hard measuring a temperature at a range of 100km, it's harder doing it through a hot atmosphere, it's even harder doing it consistently over a decade and it's hardest of all doing it when you keep having to replace your instruments with new ones. For an indication of the problems try comparing 132 month smooths of the UAH and RSS data.
Why is it necessary to use modelling after 2007? For the same reason we use reanalysis data. Relying on a single line of evidence makes your conclusions less robust. Multiple lines of evidence if they agree increase your confidence in a conclusion. More importantly, when they disagree you often learn something very interesting. -
Terranova at 21:30 PM on 15 April 2013Guemas et al. Attribute Slowed Surface Warming to the Oceans
Dana,
i guess it is technically correct, but don't you think the use of the word "unprecedented" is a bit over the top when writing about a temperature record that only goes back 50 years? The article itself is nicely done, but using an adjective like that implies a a much greater weight should be given.
-
Ray at 20:42 PM on 15 April 2013Guemas et al. Attribute Slowed Surface Warming to the Oceans
The authors state that "slowed global surfacewarming over the past 10-15 years can be explaind by an increase in ocean heat storage. This they suggest can be 'attributed not to the accelerated deep ocean warming, but to the accumulation of heat in the relatively shallow oceans (to 700 meters)'. They then conclude ""Most of this excess energy was absorbed in the top 700m of the ocean at the onset of the warming pause, 65% of it in the tropical Pacific and Atlantic oceans. Our results hence point at the key role of the ocean heat uptake in the recent warming slowdown.""
However in a post at Skeptical Science by Rob Painting on Saturday, 24 September, 2011it was stated that "Current observations of the 700 metre surface layer have shown little warming, or even cooling, in the last 8 years; but the surface layer down to 1500 metres has shown significant warming, which seems to support the modeling". and "Climate modeling and observations indicate that to fully understand the global enery budget (where all the heat is going) we need to include measurements of the deep oceans. The surface layers, even down to 700 metres, are not robust indicators of total OHC."
This seems to not be in complete agreement with thie more recent papers. Would those more knowledgeable than I in this area explain the apparent anomaly. Also why have the satellite readings since about 2000 apparently not shown a rise in SST? And. last question, now that there is a comprehensive Argo system why is it necessary to use modelling instead of the Argo results from 2007 onward?
-
chriskoz at 18:26 PM on 15 April 20132013 SkS Weekly News Roundup #15B
Bill,
Gavin Schmidt said once on realclimate: "If you want to save the planet, study engineering, not climate science". Presumably, he meant "whatever is to discover about AGW and the reason why we want to stop it, has been discovered and settled. Now, solutions are far more urgent than further details"
Gavin, who's been working with Jim, has certainly good perspective. Acitivism alone will not solve the problem. This is just the first step that will become the majority, including all policy makers are aware. Next is to implement the engineering solutions.
I'm interested what you have to say. Mods, please give us the e-mail contact.Thanks.
-
Real Skepticism About the New Marcott 'Hockey Stick'
The radiocarbon dating error (applying to most of the proxies) in Marcott et al is modeled as a random walk, with a 'jitter' value of 150 years applied to each anchor point. For the Antarctic ice cores, a 2% error range is assumed, for Greenland, 1%. The measured Marcott et al transer function includes perturbing the samples by those date uncertainties through Monte Carlo perturbation analysis - if I am reading the paper correctly, the frequency response is indeed a full characterization of the smearing effects of the processing including date errors, 1000 perturbation realizations, temperature variations, time averaging of proxy sampling (linear interpolation between sample times, not higher frequencies), etc. The date errors, I'll point out, are significantly smaller than the 600 year result of filtering a 200 year spike - and they are incorporated in that transfer function.
Once properly measured, the Marcott et al processing can be treated as a black box, and the modification of any input determined by that transfer function, as I did above.
Again, I must respectfully consider your objections sincere, but not supported by the maths. And again, maths, or it didn't happen. I'm willing to be shown in error, but that means demonstrating it, not just arguing it from what might seem reasonable.
-
Tom Curtis at 11:47 AM on 15 April 2013Real Skepticism About the New Marcott 'Hockey Stick'
KR @74, one disadvantage of a background in philosophy rather than science is that I can't do the maths. I can however, analyse the logic of arguments. If you are correct in your interpretation of the transfer functions and frequency responses, apply your filter to the mean of 73 proxies generated by perturbing your spike and it will make no difference.
Of course, we both know it will make a difference. That being the case, the issue between us is not of maths, but whether or not we should take seriously errors in dating.
-
Tom Curtis at 11:42 AM on 15 April 2013Real Skepticism About the New Marcott 'Hockey Stick'
KR @73, you are missing the point. Marcott et al's analysis of signal retention analyzes the effects of their method on the proxies themselves. It does not analyse the effects of the natural smoothing that occurs beause the original proxies are not temporally aligned. They state:
"Cross-spectral analysis of the input white noise and output synthetic stack shows that the time series are coherent and in phase at all frequencies (Fig. S17b,c), indicating that our Monte Carlo error-perturbation procedure does not artificially shift the amplitude or phase of input series."
(My emphasis)
The input series are not the actual temperatures, but the proxies. Ergo any smoothing inherent in the proxies or inter-proxy comparison are not tested by Marcott et al. Consequently your analysis is a reasonable test for whether a Tamino spike would be eliminated by the first three forms of smoothing I discussed; but it does not test the impacts of the other "natural" forms of smoothing. In particular it does not test the most important of these, the smoothing due to lack of synchronicity in "measured age" in the proxies for events which were in fact synchronous in reality.
Further, your use of the central limit theorem is misleading. It indicates, as you say, "the results of perturbed data with random errors should include the correct answer as a maximum likelihood" but it give no indication of the magnitude of that maximum likilihood response relative to noise in the data. Put simply, given a noise free environment, and the central limit theorem, we know that a Tamino spike will show up at the correct location as a peak in the smoothed data. We do not know, however, that the peak will be large relative to other noise in the data. The assumption that it will be is simply an assumption that temperatures throughout the holocene have been relatively flat on a decadal time scale, so that any variation other than the introduce Tamino spike will be smoothed away. In effect, you are assuming what you purport to test.
You can eliminate that assumption by introducing white noise with the same SD as the variation in the full Marcot reconstruction after you have applied your filter. That noise then provides a natural scale of the significance of the peak. That step is redundant in your current analysis, given the size of the spike after smoothing. However, your current spike is exagerated because while it accounts for all methodological smoothing, it does not allow for natural smoothing.
-
Real Skepticism About the New Marcott 'Hockey Stick'
A side note on this discussion: Transfer functions and frequency responses.
If you can run white noise (all frequencies with a random but known distribution) or a delta function (a spike containing correlated representatives of all frequencies) through a system and examine the output, you have completely characterized its behavior, its point spread function (PSF). You can then take a known signal, any signal, run its frequencies through the transfer function, and see what happens on the output side of the system. The system can be treated as a "black box" regardless of internal processing, as the transfer function entirely characterizes how it will treat any incoming data.
Marcott et al did just that, characterizing the frequency response of their processing to white noise and examining the transfer function. Which is what I have applied in my previous post, showing that a 0.9 C spike (as discussed in this and other threads) would indeed survive, and be visible, after Marcott et al processing.
If you disagree - show the math.
-
Real Skepticism About the New Marcott 'Hockey Stick'
Tom Curtis - I'm afraid I'm going to have to disagree with you.
Marcott et al ran white noise through their reconstruction technique, including sampling, multple perturbations, etc., and established the frequency gain function noted in their supplemental data. That includes all of the smoothing and blurring implicit in their process, unless I have completely misunderstood their processing. That is a measure of data in/data out frequency response for their full analysis, the entire frequency transfer function, including 20-year resampling. The lower frequencies (with the average contribution to the entire timeline, and the ~1000 yr curves) will carry through the Marcott et al Monte Carlo analysis, their frequency transfer function - and no such spike is seen in their data.
WRT imperfect knowledge - the perturbations of the proxies should account for this, as (given the Central Limit Theorem) the results of perturbed data with random errors should include the correct answer as a maximum likelihood.And radiocarbon dating does not have a large spread over the 11.5 Kya extent of this data - dating errors will not be an overwhelming error. And if there was a consistent bias, it would only stretch or compress the timeline.
If you disagree, I would ask that you show it - with the maths, as I have done. Until or unless you do, I'm going to hold to my analysis of the effects of the sampling and Monte Carlo analysis effects. Without maths, I will have to (with reluctance) consider your objections to be well meant, but mathematically unsupported.
I will note that my results are in agreement with Taminos - he shows a ~0.2 C spike remaining after Marcott processing, consistent with my 0.3 C results plus some phase smearing. Again, if you disagree - show it, show the math, don't just assert it.
-
Tom Curtis at 10:20 AM on 15 April 2013Real Skepticism About the New Marcott 'Hockey Stick'
KR @71, almost there.
The Marcott et al reconstruction contains at least four levels of smoothing. Three are features of the method itself.
First, the linear interpolation of missing values at 20 year resolution imposes an artificial smoothing that will be present not just in the full reconstruction, but also in individual realizations. This shows up in Tamino's first, unperturbed reconstruction in which the amplitude of the introduced spikes is approximately halved from 0.9 C to about 0.45 C by this feature alone:

Second, the age model perturbation applies a further smoothing. In the supplementary material, Marcott et al identify this as the largest source of smoothing. In their words:
"The largest increases in gain occur through reductions in age model uncertainty – shifting the 0.5 gain value to 1200-year periods by doubling age model errors and 800-year periods by halving age model errors – as would occur through decreasing radiocarbon measurement errors or increasing the density of radiocarbon dates."
The effect of this smoothing shows up as a further halving of the spikes in Tamino's analysis, although the effect is much smaller between 1 and 2 Kya where the age uncertainty is much smaller:

A third form of smoothing comes from the temperature perturbations, which Tamino did not model. Marcott et al (supplementary material) note in the supplementary material that:
"Results suggest that gain is negligibly influenced by temperature uncertainties, presumably because these errors largely cancel out in the large-scale stack."
That shows in their figure S18, with the differences gain function between 0.1 C and 1 C perturbations being impercetible, and that between 1 C and 2 C being imperceptible up to 800 years resolution, and negligible thereafter.
This result may understate the smoothing from the temperature perturbations, or more correctly, the temperature perturbations as influenced by the temporal perturbations. Specifically, in their model used to test the effects of different factors on signal retention, Marcott et al varied one factor at a time, and used the same perturbation for all pseudo-proxies. In the actual reconstruction, different proxies had different temperature errors (and hence magnitude of perturbation), and different temporal errors. Because of this, the alignment of cancelling perturbations will not be perfect resulting in some residual smoothing. This effect may account for the greater smoothing of the Marcott et al reconstruction relative to the Tamino reconstruction even when the latter includes 1000 realizations with temporal perturbation.
If I am incorrect in this surmise, there remains some additional smoothing in the Marcott et al reconstruction as yet unaccounted for.
In addition to the three smoothing mechanisms implicit in Marcott et al's methods, there are natural sources of smoothing which are the result of how proxies are formed, and of not having perfect knowledge of the past. Some of these are the consequences of how proxies are formed. For example, silt deposited on a shallow sea floor will have ongoing biological activity, particularly by worms. This activity will rework the silt, resulting in a partial mixing of annual layers, in effect smoothing the data. This sort of smoothing will be specific to different proxy types, and even to different proxy locations.
If a proxy has a natural 200 year resolution (ie, events over the full 200 years effect its value), even if the mean of time interval of a particular sample coincides with the peak of a Tamino style spike, it will only shows elevated values of 0.45 C, rather than the full 0.9 C. Without detailed knowledge of all the proxy types used in Marcott et al, however, it is difficult to say how influential this style of smoothing will be; and for some, possibly all poxies used it may not be a factor. Further, estimates of the effect of this smoothing may be incorporated into error estimates for the proxies, and hence be accounted for already. Therefore I will merely note this factor, and that anybody who wishes to argue that it is a relevant factor needs to do the actual leg work for each proxy they think it effects, and show how it effects that proxy. (This sort of factor has been mentioned in comments at Climate Audit, but without, to my knowledge, any of the leg work. Consequently it amounts to mere hand waving in those comments.)
Finally, there is a form of smoothing resulting from our imperfect knowledge. We do not have absolute dates of formation of samples of various proxies; and nor do those samples give an absolute record of temperature. Each of these measurements comes with an inherent error margin. The error margin shows the range of dates (or temperatures) which, given our knowledge, could have been the date (temperature) of formation of the sample. Given this error, most proxies will not have formed at their dated age. Nor will the the majority have formed at their estimated temperature. Their estimated age and temperatures are the estimates which, averaged across all samples will minimize the dating error.
Because not all proxies dated to a particular time will have formed at that time, the mean "temperature" estimated from those proxies will represent a weighted average of the temperatures within the error range of date. That is it will be a smoothed function of temperature. The magnitude of this effect is shown by Tamino's comparison of his reconstruction plus spikes to his singly perturbed reconstruction:
Using the Marcott et al proxies and dating error, this effect halves the magnitude of a Tamino style spike over most of the range. During the recent past (0-2 Kya) the reduction is much less due to the much reduced dating error, and for proxies that extend into the 20th century the reduction is almost non-existent due to the almost zero dating error. This is a very important fact to not. The high resolution spike in the early 20th century in the Marcott reconstruction should not be compared to the lack of such spikes early in the reconstruction. That spike is real, or at least the 0.2 C spike shown by using Tamino's method of difference is real, but similar spikes in prior centuries, particularly prior to 2 Kya would simply not show against the background variation. This is particularly the case as proxies are not extended past their last data point, so the smoothing from interpolated values is greatly minimized in the twentieth century data, and does not exist at all for the final value. The smoothing may be greater than that due to imperfect temperature measurement, but probably not by very much.
In any event, from the singly perturbed case, it can be estimated that any Tamino style spike would be halved in amplitude in the proxy data set simply because peaks even in high resolution proxies would not coincide. Importantly, Marcott et al's estimte of gain is based on the smoothing their method applies to the proxies, and does not account for this smoothing from imperfect knowledge.
Taking this to KR's interesting experiment, to close the case he needs to show the smoothed peak from a 0.45 C spike is distinguishable from a line with white noise having the same SD as the Marcott reconstruction; or better, he should first perturb 73 realizations of his spike by 120 years (the mean perturbation in Marcott et al), take the mean of the realizations and then apply his filter. If the result shows clearly against the background of white noise, he has established his case.
As a further note, Tamino to establish his case also needs to singly perturb the proxies after introducing his spike before generating his 100 realization reconstruction. If the spikes still show, his case is established.
-
Real Skepticism About the New Marcott 'Hockey Stick'
I have attempted to check the various "spike" claims in another fashion entirely - the frequency response Marcott et al found for white noise (all frequency) inputs, as described in the Supplement Fig. S17(a). Here they found the frequency gain to be zero for 300 years or less variations, 50% for 1000 years, 100% for 2000 years.
Hence a sinusoidal variation with a period of 300 years would entirely vanish during the Marcott et al processing. However - a 200 year spike contains many frequencies out to the 'infinite' frequency addition to the average. Not all of such a spike would be removed by that frequency gain filtering.
Here is a 200 year spike filtered as per the Marcott et al gain function described in the supplement, 0 gain at 300 years, 100% at 2000 years, linear slope between those frequencies:
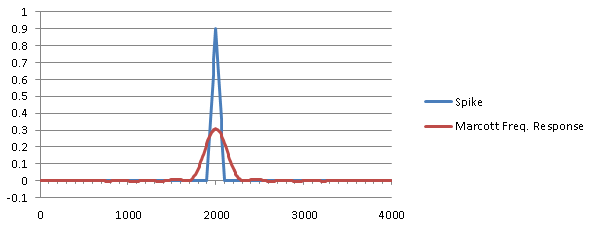
Marcott spike and resulting filtered values
This was Fourier filtered out of a 10240 year expanse, with the central 4000 shown here for clarity. Note that the 0.9C spike of 200 years has, after filtering, become a 0.3C spike of 600 years duration. This makes complete sense - the average value added by the spike (which will not be removed by the Marcott et al transfer function) has been broadened and reduced by a factor of 3x, retaining the average value under the spike.
This is to some extent an overestimate, as I did not include the phase term (which I would have had to digitize from their graph) from the Marcott transfer function - I expect that would blur the results and reduce the peak slightly more than shown here. However, I feel that based upon the Marcott et al measured transfer function in the frequency domain, a 0.9 C/200 year spike would certainly show in their results as a 0.2-0.3 C / 600-700 year spike after their Monte Carlo perturbation and averaging.
While I will not be presenting this in peer-reviewed literature (without significant cross-checking), I believe this clearly demonstrates that global spikes of the type raised by 'skeptics' would have been seen in the Marcott et al data.
Moderator Response:[RH] Fixed typing error.
[DB] Fixed broken image and link.
-
John Russell at 04:16 AM on 15 April 2013Thin, Low Arctic Clouds Played an Important Role in Widespread 2012 Greenland Ice Sheet Melt
Does anyone know how this paper fits in with Jason Box's work into the accumulation of soot on the ice sheet? Does this complement his hypothesis?
Moderator Response:[JH] I have forwarded your questions to the correspondening/lead author of this study and have invited him to post a response.
-
Paul R Price at 03:34 AM on 15 April 2013Real Skepticism About the New Marcott 'Hockey Stick'
scaddenp @61 Thanks! My messaging aims exactily, especially with regard to emissions choices.
Tom Curtis @64 Thank-you for your corrections and suggestions, and for the commendation. I managed to leave off the key colours at the bottom but will link to new version below.
Rob Honeycutt @65 You are right it is a busy graphic and too busy for a presentation. It is intended as a large information poster so it is trying to present science to serious policy types (who do seem to need a major climate science update as far as I can see from my discussions with them and in reading their reports). For any other purpose, as you say, it needs breaking into simpler and more visual slides. Below is just graphic.
chriskoz @68 I think I will try to use the poster as the basis for a presentation of three or four slides. Perhaps the whole big picture reconstruction alone, then zoom in to the present, then add in the emissions outlook, and then Stocker's trap doors.
I think you right about the first bullet point, I'll think through the text some more. Yes, typo and colours omitted by mistake. I will think some more and update below.
As you say even as an information poster it needs changing depending on the audience. Depending on interest I'm happy to play around with it and do some more work. As with "SkS Beginner/Intermediate/Advanced" one needs different levels and forms of the same information to deliver the science effectively, as well as correctly.
––
Thanks to all for the suggestions. This is a creative commons effort, and all credit is really due to the scientists and their research work. If we here can help to create effective messaging to policy makers and the public then effort is well worthwhile.
Here is updated poster with a bit less text. Still open to suggestions/corrections.
Here is graphic only. Maybe better for many purposes? Not sure how to adjust adjust graphic in Mac Pages to suit a new page size, hence the white space and big page).
-
Tom Dayton at 03:33 AM on 15 April 2013Further Comments on The Economist's Take on Climate Sensitivity
archie, it's odd that you seem to be sticking by the reporters' opinions in that Economist article, despite the clear evidence contrary to their opinions--the evidence you see here on Skeptical Science, and the evidence in the other sources that have been linked in the comments section of the Economist article. You seem to be relying entirely on the "reputation" of The Economist, ignoring the concrete, detailed evidence you can see for yourself here and elsewhere. My guess is that you do not understand how reporting about science differs from reporting about many other topics such as the business topics that The Economist more often covers. In science, the primary sources of information are the peer reviewed scientific articles, which are publicly available. People can argue over their interpretations of those articles, but for a contrary opinion to be taken seriously it needs to be expressed in another peer reviewed publication. Opinions by Skeptical Science authors don't mean much unless they are vetted by peer review, such as has happened for example in Cawley (2011) and Nuccitelli et al. (2012). For that reason, Skeptical Science posts always cite the peer reviewed scientific publications they are interpreting, and even provide links to them for your convenience. You don't have to take the science reporters' interpretations at face value, because you can read the sources yourself.
That differs from many other types of reporting, in which the primary source of the information either is available only in paper inside a particular office of a particular company or agency, or was uniquely accessible as a private interview of a source person by a reporter.
Climate change is a scientific topic. You have been presented with a wealth of the evidence, clearly explained with easily accessible primary scientific sources. Please use all that.
-
logisch at 03:21 AM on 15 April 2013It's cosmic rays
There are quite visible correlations (link to image) between the two curves. The cycle duration is 11 years. This is the solar spot observation periodicity as known for several hundreds of years already. Even the well known fact that the solar cycle that should have started at about the millenium change came a bit late is seemingly reflected in the curves.
-
Phil at 00:01 AM on 15 April 2013Further Comments on The Economist's Take on Climate Sensitivity
archie lever,
In your comments above you have stressed that you consider the Economist to be a reliable source of information (its influence, is of course, irrelevant to this discussion). Further to this you have criticised climate scientists such as Michael Mann for pointing out errors in its article about climate science.
How then, do you propose the standard of journalism on the Economist should be judged ? Your position appears to be that it should not, or at least it should not be judged by those most qualified to do so.
-
Old Mole at 23:14 PM on 14 April 2013The anthropogenic global warming rate: Is it steady for the last 100 years?
Gentlemen:
I do not pretend to follow all of the agument threads contained here, but despite my best efforts I have not seen one question that struck me addressed.
Doctor Tung states:
The real situation is more complicated than indicated by these simple functions, because the net anthropogenic forcing is the sum of radiative heatings from individual greenhouse gas concentrations and tropospheric sulfate aerosol cooling (man-made pollution).
Correct me if I am wrong, but isn't there a difference in persistence in the atmosphere amounting to at least one, and possibly two orders of magnitude between sulphate areosols and greenhouse gases? As william points out, even the Chinese have a limit on what they are willing to tolerate in terms of air pollution, so what happens when those two trend lines start to diverge?
On a side note, am I correct in assuming that greenhouse gases are mixed in the atmosphere more uniformly than sulphate areosols are? Could the regional effects of aerosols (presumably greatest closest to their source) on the surface temperatures in the Western Pacific be in any part responsible for the chilliness of the ENSO cycle so far this century?
Best wishes,
Mole
-
Dikran Marsupial at 22:48 PM on 14 April 2013Models are unreliable
@Bouke, it is a pity that you dodged my question. You suggested that the lack of skill in the models is an issue as they are used to decide policy. You also clarified that the lack of skill you mentioned was specific to sea ice extent (your post 610). However there are no policy decisions that rest on prediction of sea ice extent, which reveals that you concerns are baseless.
You claim that your aim is to remove as muich rhetoric as possible. I would suggest you start by avoiding the sort of evasion in which you have just engaged and in future give direct answers to direct questions.Please try again: "Exactly what are the policy decisions that are being made based on predictions of SSIE?" if the answer is "none", then please say so explicitly.
-
FrankShann at 22:26 PM on 14 April 2013Dueling Scientists in The Oregonian, Settled by Nuccitelli et al. (2012)
In his Oregonian letter, Nuccitelli refers to Nuccitelli et al 2012 (Physics Letters A 376 (2012) 3466-3468). Douglass and Knox responded to Nuccitelli et al in Physics Letters A 376 (2012) 3673–3675. Has there been a response to Douglass and Knox?
-
FrankShann at 21:28 PM on 14 April 2013The Big Picture (2010 version)
We are told the data for Figure 4 (total global heat content) are from Church et al 2011, but could you spell out how the graph is constructed, please. Is it from Figure 3a in Church 2011 - ocean warming (blue + red), and warming of the atmosphere and land plus melting ice (green)? There is approximately a ten-fold difference in the Y axes (0-250 versus 0-2000 x10^21 J).
Ii seems to me that Figure 4 is THE graph - because it shows total global warming. If not, why not? If yes, why is it not given more prominence (like on your home page and in summaries of climate change)? Has it been published in a peer-reviewed journal (other than hidden within Fig 3a in Church 2011)? If not, why not?
Emphasing change in global surface temperature (as in The Escalator) helps denialists because of the large variation in surface temperature (see The Escalator). Change in total global heat content has much less variability. Global surface temperature has a more immediate effect on humans than total global heat content and is less difficult to measure - but these reasons do not justify using the wrong measure (if total global heat content really is the best single measure).
-
MA Rodger at 20:31 PM on 14 April 2013The anthropogenic global warming rate: Is it steady for the last 100 years?
KK Tung @23.
You say I "would be right if all we did were to see an AMO-like bent in the data and we removed that." (The likeness between N.A.SST & global temps is of course stark and easily seen.) Your statement appears to show we are here in accord - the "finding" of a smooth anthropogenic signal is absent if "all we did were to see an AMO-like bent in the data and we removed that." Thus the "finding" lies in that other doings, and is thus the subject of future post(s).
If so, it does lead back to the crux of the initial point @11. In Tung & Chou 2013 you describe as competing 'theories' on the one hand the work you present (within which the smooth anthropogenic signal described mathematically as a log function of CO2 is considered "successful") and on the other the more common "theory that the observed multi-decadal variability is forced by anthropogenic aerosols" (within which the bent anthropogenic signal is employed eg IPCC or Skeie et al fig 1c).
Is it thust your opinion that the two signal profiles (smooth & bent) are also "competing"? (It was my contention @11 that this 'competition' should be explicitly part of the debate and it would be wrong if it were not so.)(I should also make clear that I am here uncomfortable in expressing Tung & Chou 2013 & IPCC AR4 2007 as theoretically equivalent.)
-
archie lever at 20:26 PM on 14 April 2013Further Comments on The Economist's Take on Climate Sensitivity
dana1981
I was making a general point about the Economist article from a newspaper which is influential worldwide, as is Skeptical Science. Hence my visit to your site - you are quoted outside this blog as a source of reference material on climate science.
I think it would be fair to say that the Economist's researchers have a standard to maintain, and that serious errors in their 2 page article would be unlikely. Their conclusions say to a pretty well educated readership that the science is not settled and the projections of warming might well be exaggerated.
Now regarding your specific points, you say:
"So what's happening in the real world? We're seeing a preponderance of La Niña events, an accelerated warming of the oceans, especially the deep oceans, low solar activity, etc. Basically what we would expect for a period of relatively flat surface temps - the heat is going elsewhere."
As Ray@25 has pointed out, ENSO patterns and other effects are poorly understood, and I don't think anyone can claim definitive knowledge of the energy uptake in the deep oceans. Low solar activity is on an approx 11 year cycle so the last 10-12 years should have seen all phases of one cycle. Computer predictions going forward are used by climate scientists to warn the public and policy makers all the time. It is their most powerful tool for sending the message.
I think it is obvious that the actual global temperatures from Ed Hawkins Chart 1 are heading outside the 5-95% confidence interval after a 10-12 flat period - something not seen since the 1950-1980 period, given that all the effects of CO2 release, ENSO, solar cycles, ocean absorption should be present in the Ed Hawkins 1950- chart.
-
bouke at 20:24 PM on 14 April 2013Models are unreliable
@CBDunkerson
Interesting, I didn't know about that.@Dikran
The current policy decision is to do nothing, more or less. If, when AR5 comes out, it contains an earlier possible date for an ice free summer, initiatives like this (met-office-investigating-arctic-link-in-record-low-temperatures)
would gain in urgency. I think that would be a good thing.@Sphaerica
It is very hard to convey irony and things like that through text alone. My personal strategy to combat miscommunications is to remove as much rhetorics as I can: If I ask a question, it is because I want to know something. If I consciously make an assumption, I state that. If I make a statement of fact, I am very careful that I'm sure its true. Unfortunately, this sometimes makes posts difficult to distinguish from concern trolls, but I don't really know a way to avoid that.You wrote 'You read one paper, and then drew a bunch of unjustified conclusions'. I read more than one paper, and haven't drawn many conclusions yet. I could go on a rant that it is actually you who is drawing unjustified conclusions, but such a thing would be a rhetorical trick, and as such unproductive. I don't want to go there.
Perhaps I should tell something about were I'm coming from. I get my information from skeptical science, realclimate.org, occasionally papers (it takes a lot of energy to read them), youtube recordings of scientists presenting their work, 'the discovery of global warming' (http://www.aip.org/history/climate/index.htm). When I am tempted to tell myself I know something for a fact, I seek out information from sources that say the opposite. When I detect that those sources contain lies of omission, or just plain lies, my confidence goes up. When those sources contain interesting new insights, I learn something.
Currently, I am tempted to conclude that the scientific consensus, as represented in AR5, is too conservative regarding SSIE. There's been research that shows that the IPCC is too conservative more often than too alarmist, so that increases my confidence that this may indeed be the case here. I ask myself how this could happen, and one hypothesis is that scientists are in the business of understanding things, not in the business of predicting things. Current understanding (i.e. the current models) isn't good enough to make good predictions. Nevertheless, generally, only those predictions are publicized, and so only those predictions end up in AR5.
Something like an expert elicitation study for sea ice could shed some light on my question, but I don't know if they exist for sea ice.
-
scaddenp at 20:01 PM on 14 April 2013Further Comments on The Economist's Take on Climate Sensitivity
Ray,
1/
" El Niño is not the only effect on weather". It is a given that volcanoes and solar are part of the surface temperature variability, however, ESNO is the major effect. There may be other factors at work, but at present there is little evidence for them. See Foster and Rahmdorf 2011 and Rypdal 2012 These studies do not rule out other factors, but also show that no other factor is necessary to explain most of the month by month variability. Comments should go to here. I cant check your SA reference (please give proper links) but its makes the point that ESNO is unpredictable. However, given an index of 1.8 or more, evidence so far point that producing a record unless it was also accompanied by a major low latitude volcano.2/ "Your question really isn't phrased correctly". Oh yes, it is. Given the above point about the dominance of ENSO in variability, complaining that model predictions about current surface temperatures is wrong implies models should be predicting ENSO. As you correctly state, they cannot. However, OHC, ice, sealevel all point to earth system continuing to accumulate energy and so that will be expressed in the surface temperatures eventually.
3/ "This question doesn't make sense". Okay, that should have been better stated. The current ENSO pattern isnt particularly unusual historically and can be expected to deliver periods of El Nino dominance in future. Guess what happens to surface temperatures then? If you wish to believe that continued accumulations of GHGs dont matter and warming wont return, then you also somehow need to believe that El Nino's .
-
BillEverett at 19:31 PM on 14 April 20132013 SkS Weekly News Roundup #15B
chriskoz@1, I agree absolutely, in a sense. Not to be a nitpicker, but not all scientists need to become activists. In my view, we are engaged in a war, and a global mobilization at least on the scale of 1939-1945 is needed. The "enemy" is Us and our relation to Nature. If we wait for the Pearl Harbor moment to wake up and get involved, we may wait forever. Nature's predominant strategy in this "war game" may well be a version of the Chinese(?) "Death by a 1000 little cuts." It is not a two-, three-, or four-front war but a multi-multifront war. One person can only fight well on one front. But we all need to engage where we can fight best. We still need more science to learn what we do not yet know, to make what may be crucial new discoveries. The general picture, however, is rather clear.
When we say "all of us," it is of course a generalization. "All of us" did not participate in the agricultural revolution thousands of years ago, which was accomplished over many centuries. There are still some Stone-Age hunter-gather humans on the planet. "All of us" did not participate in the industrial revolution a few centuries ago, which was acoomplished over many decades. There are still many pre-industrial agricultural humans on the planet. In the same way, I think not "all of us" need now participate in the--what shall we call it?--the sustainable-responsible revolution, which must be accomplished over a few years. We need just a sufficiently large percentage of "all of us."
I believe the total problem is too large and complex for me or you (or anybody) to understand. It then follows that the total problem, if we will solve it, can be fully understood only by the collective intelligence of mankind. Just how this collective intelligence can form and function, I don't know. But I have been thinking about it for more than forty years and have started to work on it more actively very recently. I you want to know more about this aspect, contact me personally.
NOTE TO MODERATOR: Please delete this comment if you consider it too much off-topic. I won't be offended.
-
chris at 19:27 PM on 14 April 2013Real Skepticism About the New Marcott 'Hockey Stick'
Tom, my point is very simple. You can’t use as a test for whether a contemporary style 100 year warming (converted into a spike with an additional 100 year cooling) might have existed in the Holocene but missed in the Marcott reconstruction…. an event for which the evidence indicates was faster and probably much smaller in amplitude when globally averaged.
There are some other points:
1. In my opinion Marcott et al (2013) has been over-interpreted. It’s value lies in the fact that it provides a continuous record of global surface temperature throughout virtually the entire Holocene. It captures the broad temperature excursion forced largely by orbital insolation effects and supports expectations based on the latitudinal response to those. That’s an excellent advance.
2. However the nature of the reconstruction means that moderately high resolution temperature variability is sacrificed. It’s simply not a suitable reconstruction for assessing this.
3. How do we deal with this if we want to address questions about amplitudes and time scales of potential temperature excursions in the Holocene? I would say that we approach this in exactly the way it has been approached. We look at high resolution records (ice cores mostly and maybe tree rings for isotopic signatures of solar variability) in which evidence of virtually any climatic perturbation (and its likely origins) is very likely to be recorded. We then make a focussed effort to address the amplitude and timescale by examining pre-existing proxy series and finding new ones that cover the period of the climatic excursion.
4. That's been done with the 8.2 kYr event. The evidence is pretty strong (it seems to me) that the event (the last great delayed gasp of the glacial to Holocene climatic transition) is the stand-out event in the Holocene ice core record, and that there isn’t evidence for other marked and rapid climatic excursions records (although there is plenty of evidence of smaller scale temperature variability). Focussed attention on proxies encompassing the 8.2 kYr event supports the interpretations about its origins and its local and globally averaged temperature impacts that we discussed above.
5. But pretty much none of that comes out of inspection of Marcott et al which was addressing a different set of questions.
-
chriskoz at 18:18 PM on 14 April 2013Real Skepticism About the New Marcott 'Hockey Stick'
Rob@67,
Depending what you want to do with it.
As slide aid for science presentation, it's indeed bad: too much text. The text should be converted to graphics. Presenter would not be able to fit that information in one slide anyway.
As a poster about implications of Marcott 2013, it is good. Viewers like yours, who "be able to grasp the key points in 1 or 2 seconds, almost without thinking" does so by looking at the graphic only, inquisitive viewers may want to read the text which enhances the graphic quite well.
The only simplification that I'd do (without loss of information) is to remove the first bullet point in the first frame (±1ºC band of temperatures) because the same can be read from the graphic. The frame title can also be removed, so maybe somehow combining two frames would be good idea (they are talking about emissions rather than T). The small print (credits) can be made even smaller and tenser, esp. long link to the blog. Marcott 2012 is a typo (unless you mean Shaun's dissertation from a y ago - you probably do not).
Enhancement of the graphic caption is possible to match the graphic:
Shakun et al - make it green
Marcott et al - blue
A1B - red
HadCRUT 4 - brown
I like the horizontal arrows tied to dates when emissions must fall. Year 2012 should be stressed with a comment "(we missed it)". Maybe a shortened version (graphics + horizontal lines & dates + just one line of credits) would suit SkS. It would suit my slide show, if you asked me.
-
Paul Magnus at 16:43 PM on 14 April 20132013 SkS Weekly News Roundup #15A
Climate Change will also lead to bigger brigher and more impressive rainbows....
-
Ray at 13:31 PM on 14 April 2013Further Comments on The Economist's Take on Climate Sensitivity
scaddenp
Hopefully the Moderator will permit this post but as your post asking the questions was permitted I would imagine that my responses to those questions will also be permitted. However I don't wish to be too sanguine as that would be presumptuous.
1/ The next El Nino of greater than 1.8 wont break surface temperature records.
No idea. Here's a couple of comments that suggest the answer to your question might be less straightforward than it appears. El Niño is not the only effect on weather as it is just one fluctuation among many, and the weather is the sum of all of these overlaid and interacting. Most of these interactions are poorly understood, particularly the longer-term ones, and as we get longer and longer records we become aware of more and more complexity. This from Scientific American "The results show that the variability and strength of the ENSO cycle was greater during the 20th century than at most points in the 7,000-year fossil record -- but the episode is not unprecedented, the scientists said, pointing to a similar period during the early 17th century." This variability probably precludes a definitive answer to your question
2/Models should be able predict the ENSO patterns
Your question really isn't phrased correctly. The answer to the question you ask is "Yes they should be able to. A more pertinent question is perhaps is "are they able to predict the ENSO patterns". The answer to that question is that so far the predictive results are variable as the observational results showed the 1997 El Nino was occurring before the models predicted it. The US Global Change Research Information Office has suggested a possible reason for this predictive failure is the Madden -Julian effect which was not considered by models.They go on to say "At present, no forecast system captures intraseasonal signals such as the Madden-Julian oscillation with any skill. Once again, a target exists for improved models". This seems to answer the revised question.
3/ Eli Nino's will be rare in the future and La Nina/Neutral conditions will surface temperatures as they are.
This question doesn't make sense
-
chriskoz at 13:22 PM on 14 April 20132013 SkS Weekly News Roundup #15B
Jim Hansen retiring - that's the big news. He's one of the most accomplished luminaries of climate science.
On the other hand, Jim's decision to quit science and concentrate on activism may be a powerful symbol of what should now be a priority for all of us, including the scientists.
-
Rob Honeycutt at 12:12 PM on 14 April 2013Real Skepticism About the New Marcott 'Hockey Stick'
My suggestion would be to try to let the image speak and use less words. Way less words. Try to get rid of the right side altogether. Enhance the left to where it says, visually, everything written on the right.
Also, sit down to list the 3 or 4 most important points (better if only 2 or 3) for the graphic and make sure you're delivering that effectively in your visuals.
I think there's a ton of potential in the graphic. Right now it's too much and you lose more people than you inform. The viewer really has to be able to grasp the key points in 1 or 2 seconds, almost without thinking. This can do that. It just needs to be edited down.
-
Tom Curtis at 10:20 AM on 14 April 2013Real Skepticism About the New Marcott 'Hockey Stick'
Rob, sometimes the information overload is worth it, IMO. That is particularly the case when you have the simple version of the same graphic, ie, the original "wheel chair", already available when simplicity is desirable.
Having said that, Paul has already asked for suggestions, so if you can think of an appropriate way to simplify the graphic, suggest away.
Prev 915 916 917 918 919 920 921 922 923 924 925 926 927 928 929 930 Next


