


 Arguments


Recent Comments
Prev 926 927 928 929 930 931 932 933 934 935 936 937 938 939 940 941 Next
Comments 46651 to 46700:
-
Bernard J. at 21:43 PM on 30 March 2013Making Sense of Sensitivity … and Keeping It in Perspective
Just a heads-up for the commenters in general.
Elsa has a habit of capturing the first post on more than a few threads on various climate-related online fora. I have a strong suspicion that it's not just simple chance...
Beyond that I will not speculate as to motive.
-
Glenn Tamblyn at 21:42 PM on 30 March 2013Making Sense of Sensitivity … and Keeping It in Perspective
elsa
The basis for the 3.7 W/M2 per doubling is this paper, cited in the IPCC's AR4. Myhre et al 1998. However, if you want to dig deeper than that you need to start delving into Radiative Transfer science. The Eqn of Radiative Transfer; Line-By-Line, Narrow Band & Broad Band radiative transfer codes; Databases of spectral data such as HiTran and Geisa; the history of the developement of this through the 1950's and 1960's; The particular role the Nimbus 3 satellite played in 1969 in confirming previous observations and so on. Lots of research.
-
Bernard J. at 21:40 PM on 30 March 2013Making Sense of Sensitivity … and Keeping It in Perspective
Elsa's education seems to be lamentably lacking in the basic science that demonstrates that CO2 can absorb infrared radiation.
If the scientific literature itself is too challenging, perhaps she might consider a visual proof such Iain Stewart's demonstration, or Pieter Trans' very similar demonstration. These are very simple yet very graphic corroborations of the fact that CO2 is not transparent to infrared.
-
bouke at 21:01 PM on 30 March 2013Earth Encounters Giant Speed Bump on the Road to Higher Sea Level
Rob, if you show 100 people a headline "Sea level rise encounters speed bump", and ask them if it means an increase or a decrease in the speed of sea level rise, I'd expect more than 50 of them to choose a decrease. I myself would interpret it that way. In fact, I feel strongly enough about it to make this comment.
So, at least some people interpret the title to mean the opposite of what was intended, which is also not a good thing from a communication point of view.
If you want memorable, how about 'The downs and ups of sea level rise'? That's exactly what happened, and the reversal of 'ups and downs' sure sticks.
-
Pierre-Normand at 19:48 PM on 30 March 2013Earth Encounters Giant Speed Bump on the Road to Higher Sea Level
There is no need to use another metaphor, Rob. This metaphor would be just fine if you weren't using it to denote the almost exact opposite (a temporary increase in speed) of its already well established use (a sudden hurdle/a cause of a slowdown). I'd be surprised if any other reader of this thread will have at first understood your title "Earth Encounters Giant Speed Bump on the Road to Higher Sea Level" to designate the fast increase of the last two years, as you intend it to. NASA/JPL also were clearly describing the previous sea level fall -- the pot hole -- as an extreme case of a mere speed bump (mere reduction of a positive trend).
-
nealjking at 18:31 PM on 30 March 2013Making Sense of Sensitivity … and Keeping It in Perspective
elsa:
The first-order warming from the enhanced greenhouse effect (EGHE) is due to radiative forcing, and this is derived on the basis of radiative transfer theory. The general idea goes like this:
- The temperature profile of the atmosphere makes it generally cooler as you go higher.
- A beam of radiation that starts at ground level and proceeds upwards to the sky will be roughly at ground temperature at the bottom; its temperature will be reduced along the beam as you proceed upwards, remaining roughly the same as the surrounding greenhouse gas (GHG) at each level. (The local beam temperature is reflected in the spectral density of radiation at that point.)
- When the GHG has become so thin that the remainder of the GHG gas (up to the very top of the atmosphere) has total optical depth of 1 (optical depth = line integral of the coefficient of absorption), the local beam temperature stops tracking the local gas temperature profile, and the beam "escapes".
- So the bottom line is that the radiation of the beam at ground level is characteristic of the ground-level temperature; the radiation of the beam as it escapes the atmosphere is characteristic of the temperature at the altitude at which the GHG optical depth = 1 (as measured from that altitude out into space).
- Because the high-altitude temperature is lower than the ground-level temperature, LESS radiation escapes than started out at the bottom of the beam. That is the mechanism of the greenhouse effect (GHG). In radiative equilibrium, the radiation escaping has to equal the solar radiant energy absorbed by the Earth, so this defines a characteristic temperature at that critical point.
- So now, when extra GHG is added to the atmosphere, it permeates the atmosphere and raises the GHG concentration everywhere; in particular, CO2 gets as high up as 100 km. The result is that the optical depth at every altitude INCREASES, thus the point at which optical depth = 1 moves UPWARD; therefore, the local temperature at this new critical point is cooler, implying that the intensity of escaping radiation is REDUCED. This means that the radiant power lost is NO LONGER in radiative equilibrium with the solar radiation.
- So what happens? The Earth is now absorbing more radiant energy than it is losing, so it warms up. The temperature increase also propagates up through the atmosphere over time, such that the temperature increases at every altitude. When the temperature at the NEW critical point (where optical depth = 1) increases enough to match the original temperature at the OLD critical point (before the extra GHG was added), the escaping radiation will again match the incoming solar radiation. The temperature everywhere will be a bit higher. This is the mechanism of the enhanced greenhouse effect (EGHE).
- This walk-through of the radiative transfer physics of radiative forcing is taken from the textbook Principles of Planetary Climate, by Raymond Pierrehumbert (U. Chicago). There are some additional complexities due to the fact that the the infrared radiation has to be considered as made up of separate spectral bands appropriate to each type of GHG molecule, but this is the basic idea.
- The total magnitude of the warming is determined also by 2nd-order feedback effects that entail the complexity of the cllmate system. But the calculation briefly described above sets the "first step".
-
gpwayne at 16:43 PM on 30 March 2013Making Sense of Sensitivity … and Keeping It in Perspective
On the subject of sensitivity: recently, I've considered that, in the context of such discussions, we may be rather missing the point.
Climate sensitivity has, for some time now, been one of the few scientific uncertainties on which sceptics can call to support their position. Their argument has been - roughly - that if sensitivity was low, feedbacks did not materialise or have a significant effect, then climate change would be considerably less of a problem (therefore requiring considerably less spending on the solutions).
What has been under-emphasised in my opinion is the relationship between cause and effect. Predictions of temperature rises for a doubling of CO2 represent a way of calculating how much additional energy may be retained by the ecosystem - oceans, land, air - but climate sensitivity does not tell us how the ecosystem will react, by how much, or when.
I mention this because, from a real-world perspective, the issue is not by how much the temperatures will rise, but what effect any rise will have - and here we are in much less certain territory. Consider the melting ice and the way that weather appears to be showing increases in localised extremes. Both these effects have, until recently, been discussed as effects we might see mid-century, as heat/energy accumulates. These timescales now seem hopelessly inadequate, suffering from the conservatism I believe has materially biased much climate science. (Hardly surprising when you're under attack all the time, of course).
We will, as a matter of retrospective measurement, determine the true value of energy retension for a doubling of CO2. Meanwhile, I hope others might agree that we need to emphasise not so much the theoretical aspect of climate sensitivity, but the dawning realisation that massive - and catastrophic - disruption of the climate may be wrought by as little as a 2 degree increase in temperatures, the same figure touted for so long as a 'safe' limit.
I would also like to add one other point: the homogenization of regional temperature records that give us the 0.8 degree anomaly to date, or the putative figures for future doubling of CO2, also conceal a more disturbing metric. Temperatures do not rise evenly across the globe, and therefore the effects of even the warming to date cannot be understood merely by averaging the change. Local anomalies will be the cause of local effects - the Arctic is a particularly compelling example given the effect its local temperature anomalies of up to 2.28 degrees C (GISS) are already having on N. Hemisphere climate patterns - and I think the actual effects of significant local temperature increases on our lives are being disguised by using the global metric in our discussions.
-
gpwayne at 16:13 PM on 30 March 2013Making Sense of Sensitivity … and Keeping It in Perspective
Since one of her few remaining posts on my blog has been quoted in order to demonstrate the historical antecedents of Elsa's inveterate denial, I'll just point out that before my blog she wrote some very strange stuff in the Guardian's CiF, the content of which along with posts on my blog were so irrational that I had to show her the door. Of course, I was accused of censorship etc (corresponding to the victimhood status inherent in all climate change denial) but I mention this now because, as then, her posts are extremely disruptive - which I believe is one purpose of denialist activism, as well as to infer doubt where, in fact, none exists. Is it wise to take such posts seriously?
By the way, if SkS considers this post to be off-topic or in any way inappropriate, please remove it.
-
Rob Painting at 16:06 PM on 30 March 2013Earth Encounters Giant Speed Bump on the Road to Higher Sea Level
The obsession with overinterpreting the metaphor is somewhat odd. Figure 1 shows a striking resemblance to an uphill road with a large number of pot holes and speed bumps on it.
BillEveritt - sorry, but your suggested alterations have poor memorability - which is not a good thing from a communication point of view. If you can come up with a better metaphor, I'll consider it when next writing on this topic.
-
sidd at 15:00 PM on 30 March 2013New Research Confirms Global Warming Has Accelerated
Balmaseda et al., 2013 has reanalyses of OHC
http://onlinelibrary.wiley.com/doi/10.1002/grl.50382/abstractthe divergences of the traces since 2000 seemed interesting so i plotted the differences
http://membrane.com/sidd/balmaseda-2013.html
when will the Kraken rise ?
sidd
-
BillEverett at 13:43 PM on 30 March 2013Earth Encounters Giant Speed Bump on the Road to Higher Sea Level
I have the same problem with the metaphor as Pierre-Normand@6,9 but object more strongly to its use. The purpose of a metaphor is to provide a strong image explaining a reality that may otherwise be unfamiliar. In this case, "sea level rise encounters a speed bump" clearly means that "sea level rise slows down abruptly (and will presumably increase after passing over the speed bump)." In other words, the common implication of the metaphor is opposite to the reality. No metaphor is better than a bad metaphor. In this case, it might be better to replace "pothole" with "(abrupt) slow down" and "speed bump" with "(abrupt) speed up."
-
dr_who1379 at 13:09 PM on 30 March 2013February 2013 Arctic Sea Ice Death Spiral Update
It is my understanding that sattelite data overestimate the total ice cover. Ships that have been sent to the arctic by Greenpeace report that at points that the sattelites report total ice cover it is found to be burger bits for miles around. Enough reflection from the burger bits looks from space like solid ice cover: i.e. it is worse that we thought
Moderator Response: [DB] "burger bits" = Bergy Bits. -
dana1981 at 12:44 PM on 30 March 2013Making Sense of Sensitivity … and Keeping It in Perspective
Nick @39 - yes, actually The Economist filmed an interview with the two contributors to this article. One of the points they made was that lower sensitivity might matter if our climate policy was suitable for a world with 3°C sensitivity; however, in reality our policy is woefully inadequate. Thus from a policy perspective, 3°C or 2.5°C or even 2°C sensitivity makes little to no difference. In any case we're not doing nearly enough to mitigate climate change.
As I've said, this article is not written from a denialist perspective. They recognize the problem and that we need to solve it; they've just been convinced by evidence for slightly lower climate sensitivity that really is quite weak.
-
Bob Lacatena at 12:43 PM on 30 March 2013Making Sense of Sensitivity … and Keeping It in Perspective
elsa,
...the models are not derived from physics, but from measurements. ... They are fitting (or tuning as you put it) the data to the theory so of course they will appear to work.
False.
Casual readers are asked to please recognize the completley vacuous and programmed nature of Elsa's comments. She seems to merely recite the most childish of climate denial myths, while making no effort to use the power of the Internet to correct her ignorance.
This is the stuff that denial is made of; smoke, pixie dust, ignorance and frustration.
-
Bob Lacatena at 12:40 PM on 30 March 2013Making Sense of Sensitivity … and Keeping It in Perspective
Elsa,
The relationship between CO2 and temperature is:
∆T = K log2(CO2final/CO2initial)
The derivation of the equation is non-trivial. Asking for it is like asking me to explain the theory of relativity to you. However... it is accepted by everyone except for the nuttiest of deniers.
If you are arguing something that basic, you are hopeless, and everyone is wasting time with you.
-
Bob Loblaw at 10:54 AM on 30 March 2013Making Sense of Sensitivity … and Keeping It in Perspective
Elsa:
Your request for a "single" equation linking CO2 and global temperature is sort of like asking for the single equation that shows that a Boeing 787 can fly, or the single equation that relates total US tax revenues to personal income.
...but for a starting point, if you want to question that CO2 absorbs IR radiation, perhaps you can ask the people at Licor that sell off-the-shelf IR gas analyzers that use IR to measure atmospheric CO2 concentrations for the equations they use. This is stuff that is old hat.
Moderator Response: [DB] Added link. -
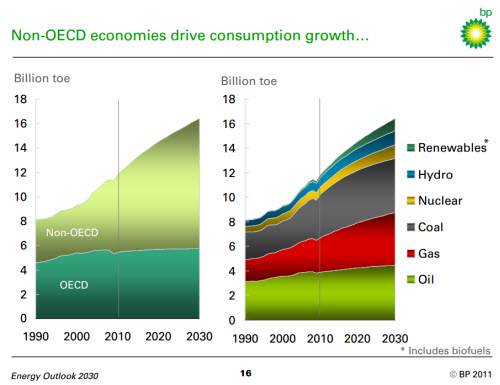
Andy Skuce at 10:45 AM on 30 March 2013A Detailed Look at Renewable Baseload Energy
Interesting though this discussion is, I wonder whther the big picture is being lost. When you look at the projections below (OK they are by an oil company PDF but let's assume that they are not that bad), renewables and nuclear gow over the twenty years, but nowhere as much in absolute terms as coal, gas or oil. OECD countries show little growth in energy and all the growth and, by 2030, two-thirds of the consumption will be in developing countries. Debating the relative merits of renewables vs nuclear in OECD countries seems rather beside the point when the forecasters are predicting negligible shares of both sources globally and quite massive increases in fossil fuel consumption. Shouldn't we be rooting for bigger shares for both nuclear and renewables?
-
Bob Loblaw at 10:45 AM on 30 March 2013It's not bad
KenD:
Instead of looking at the next 20 years, why don't you dig up some predictions made in the past - e.g., Arrhenius in 1896 - that have come true?
-
John Hartz at 10:44 AM on 30 March 2013Making Sense of Sensitivity … and Keeping It in Perspective
elsa:
If you are sincere in your quest for equations, you should trek on over to the Science of Doom website and peruse the post, Atmospheric Radiation and the “Greenhouse” Effect.
-
barry1487 at 10:21 AM on 30 March 2013Making Sense of Sensitivity … and Keeping It in Perspective
Elsa,
Stripped of its niceties you seem to say that the models are not derived from physics, but from measurements. But if that is the case they are not testing a theory at all. They are fitting (or tuning as you put it) the data to the theory so of course they will appear to work.
The measurements referred to are of how CO2 (and other gases) absorb radiation in the atmosphere. The physics of climate models are based on these measurements. You said there was no physical link to CO2 and temperature in climate models:Yes people have looked at actual temperature and CO2 concentrations but that does not supply an equation linking the two derived from physics.
The information provided you is the 'link' you think is missing - and that is only a fraction of the work done on the very matter you assume is 'missing'. Read the papers I linked above and see for yourself.
Of course GCMs are based on empirical data. If you think that scientific theories must operate without using actual data, then you have an unbelievably misbegotten notion of science.
Your assertion was that models are fit to temperature data. You are entirely, utterly and completely wrong about that. They are based on the physics of climate processes. They are not tuned to temperatures.
No insult intended - you are very ill-informed on these matters. Check out the links, learn more about it, and try here again after that.
Moderator Response: [DB] It is clear that in the 2 years and 7 months that have elapsed that elsa has not taken the time to actually learn something about the climate models, choosing instead to remain thoroughly uninformed about them. -
Nick Palmer at 10:11 AM on 30 March 2013Making Sense of Sensitivity … and Keeping It in Perspective
I just wrote this comment to the Economist article. Do fellow SKS'sers think it's a good point?
______________________________________________________________
Perhaps the writer of this article ought to have done a bit of thinking before writing this misleading article.
They portray the lower estimates of climate sensitivity, from a few researchers (around 1.9-2.0°C per CO2 doubling), as being somehow "safe" because this makes some hope that we could probably handle that amount of warming.
Like many people trying to make the sceptical/denialist case, they do not think it through. If the policy makers of the world thought such a value of sensitivity was "safe", what do you think would happen? There would be few, if any, attempts to reduce emissions, so atmospheric levels of CO2 would carry on rising faster.
Here's a question for the sceptics - what makes you think levels would stop just at a doubled value from pre-industrial times (280 -> 560ppm)? Why would humanity not, in due course, double that again to 1120 ppm which would lead, even using the rose tinted "get out of jail free" sensitivity of 2°C, to 4°C of warming, which no one sane can dispute would be highly dangerous.
To those who don't think we could get to 1120ppm with just our fossil fuel, fracked gas, tars sands etc remember that the Arctic is warming a lot more than most and there is a lot of tundra/permafrost up there already starting to melt, which will be releasing large amounts of CO2 as the frozen organic material decomposes. Not to mention the increased out-gassing of CO2 from the oceans as they warm too.
So, even if these lower sensitivity figures are valid, we are still facing a very dangerous situation and articles such as this one, that try to make out we are not, are reckless and irresponsible.
-
barry1487 at 10:04 AM on 30 March 2013Making Sense of Sensitivity … and Keeping It in Perspective
Elsa,
Since you ask me "to get down to tin tacks" I will. I see no reason to believe that a doubling of the concentration of CO2 (from one very low figure to another slightly higher but still very low one) will result in a temperature change of very much.
No reason to believe? But where does your doubt take you? Do you investigate your own assumption?
Human industry has added 100 parts per million of CO2 to the body of the atmosphere. Would you happily swallow 100 ppm of your body weight in cyanide, believing that such a small amount will have negligible effects? I would suggest more study before you attempt to demonstrate why tiny amounts of something must perforce be of little consequence.
There is a massive dent in the ozone layer the size of Australia over the South Pole from a few hundred parts per billion increase of ozone depleting gases in the atmosphere. The process is different (catalytic), but the point is the same.
Rather than scale, investigate the power of CO2 as a greenhouse gas. It is a tiny fraction of the atmospheric composition, 0.039%, but GHGs, which, increase the surface temperature by 33C, comprise only a small part of the atmospheric total of gases. The effect of CO2 in terms of greenhouse forcing is relative to its proportion in the total of greenhouse gases and its particular power power as a greenhouse gas (different gases have different absorptive power). Its contribution is calculated to be somewhere between 9 and 20% of the greenhouse effect.
Greenhouse_gas#Impact_of_a_given_gas_on_the_overall_greenhouse_effect
If wikipedia is not enough for you, you can refer to the science papers I linked above (Ramanathan & Coakley (1978), the ones linked at the wiki page, (eg, this one) and have a rummage in google scholar.
Don't wait for your lack of belief to inform you. Apply any curioisity you may have.
Moderator Response: [RH] Shortened link that was breaking page format. -
elsa at 09:47 AM on 30 March 2013Making Sense of Sensitivity … and Keeping It in Perspective
Barry
Thank you for your comment. Stripped of its niceties you seem to say that the models are not derived from physics, but from measurements. But if that is the case they are not testing a theory at all. They are fitting (or tuning as you put it) the data to the theory so of course they will appear to work.
-
elsa at 09:43 AM on 30 March 2013Making Sense of Sensitivity … and Keeping It in Perspective
Sphaerica
Perhaps, since you say that the link between CO2 and temperature is derived from physics, you can tell us what the equation is that links the two and how it is derived?
-
barry1487 at 09:40 AM on 30 March 2013Making Sense of Sensitivity … and Keeping It in Perspective
Elsa,
With regard to the physical process you have not addressed the point. Yes people have looked at actual temperature and CO2 concentrations but that does not supply an equation linking the two derived from physics. All it is doing (and the models likewise) is fitting the data to the theory.
The models are sets of equations. They are not fit to observations of temperature. They are tuned to emulate certain processes, but not trends. The physics of infrared absoprption of greenhouse gases is derived from empirical measurements, which are the spine of climate models. The impatience you are reading above probably comes from the fact that this information is basic to an understanding of models, and your views are very under-informed.
The following paper is one of the seminal calculations of the atmospheric greenpouse effect, from 1978.
Ramanathan_Coakley_Radiative_Convection
which builds on the work of papers like this
ftp://eos.atmos.washington.edu/pub/breth/CPT/manabe-wetherald_jas67.pdf
HITRAN is an empirical database of the absorptive and tranmissive properties of gases in the atmosphere. These data underpin atmospheric models.
realclimate have a couple of simple FAQs on climate models, worth reading to get some basic understanding.
http://www.realclimate.org/index.php/archives/2008/11/faq-on-climate-models/
www.realclimate.org/index.php/archives/2009/01/faq-on-climate-models-part-ii/
Models attempt to replicate the physics of the climate, and variables are perturbed (like increasing CO2) to calculate what the resulting changes might be. They are not fit to temperature data.
Moderator Response: [RH] Shortened link that was breaking page format. -
elsa at 09:40 AM on 30 March 2013Making Sense of Sensitivity … and Keeping It in Perspective
scaddenp Since you ask me "to get down to tin tacks" I will. I see no reason to believe that a doubling of the concentration of CO2 (from one very low figure to another slightly higher but still very low one) will result in a temperature change of very much. You mention of 3.7W/m2 without explaining where this number is derived from. Perhaps you can tell us why this particular one is right?
-
KenD at 09:19 AM on 30 March 2013It's not bad
Thanks for your helpful responses, DSL, Sphaerica, and Dikran. I'll see if one of my friends is willing to make a wager on the following, assuming we stay at or above current C02 levels (just shy of 400 ppm):
If total ice sheet loss over the next 10 years is less than 3.44 trillion tons (344 billion tons times 10 years), then he wins and I lose.
If Arctic sea ice is > 250k km2 area in 2023 at summer minimum, then he wins and I lose.
The friend I'm thinking of is a fan of WattsUpWithThat, so I'm hopeful he'd be willing to bet on the above. I'm assuming these are pretty safe bets on my part?
-
Pierre-Normand at 08:53 AM on 30 March 2013Earth Encounters Giant Speed Bump on the Road to Higher Sea Level
Thas's true, rob. NASA JPL coined the terms. But they also clearly meant the "speed bump" to represent a slow down in the rate of sea level rise and the "pot hole" to be an extreme case of a "speed bump", that is, an actual reversal of the sign of the trend. Whereas you use the term "speed bump" to refer to the recent sharp increase in the rate of sea level rise. This is queer and rather contrary to common usage. I didn't object to the very use of the metaphor. But it's just a quibble.
Of course, I agree with Bob on both counts.
-
Bob Loblaw at 07:56 AM on 30 March 2013Earth Encounters Giant Speed Bump on the Road to Higher Sea Level
Pierre-Normand:
Given that the analogy is "potholes and speed bumps", both are reasons to slow down a vehicle on a road. They represent irregularities - one where the observations are lower than a smooth ride, and one where observations are higher than a smooth ride. Neither is necessarily related to the long-term trend of the altitude (slope) of the road.
-
nealjking at 07:37 AM on 30 March 2013Making Sense of Sensitivity … and Keeping It in Perspective
elsa:
Rob Painting reminds me of an analogy I proposed some time ago to explain the irrelevance of the smallness of the concentration of greenhouse gases (GHGs).
Think of a city square where a politician is to give a talk. Many people are there to listen; but a handful have been hired by his opponents, to assassinate him. How will the likelihood of their success depend on their relative proportions?
Basically, the more assassins there are, the greater the likelihood that one of them gets him: one or two assassins could easily be stopped by the Secret Service, but if there are a lot of them, it's much more likely someone will get a shot.
How will this be affected by the number of non-assassins? Basically, not at all: non-assassins are not there to protect the politician, they are just there to listen. They will not be looking for trouble. They are irrelevant.
Therefore, to first order, the likelihood of success by the assassins will be the same if they represent 100% of the attendees as if they represent 1/100-% of the attendees. (In fact, in a slightly more realistic case, the more non-assassins there are, the more distracted the Secret Service will be; so the chances of assassination increase as the proportion of assassins drops.)
Now think of the politician as being the infrared photon, the assassins as being the greenhouse gas molecules, and the non-assassins as being the non-greenhouse-gas molecules. In the same way, the proportion of GHG molecules is to 1st order irrelevant to the GHG capability; and, due to pressure broadening, if the number of non-GHG molecules is increased, the GHG capability even increases.
You just have to have enough GHG molecules in absolute number.
-
Rob Painting at 07:30 AM on 30 March 2013Earth Encounters Giant Speed Bump on the Road to Higher Sea Level
Pierre-Normand - The gals and guys at NASA JPL came up with that. I think it's a nice simple way to convey the message. Especially when we consider that the majority of Earth's population do not know anything about sea level rise. YMMV.
-
Pierre-Normand at 07:23 AM on 30 March 2013Earth Encounters Giant Speed Bump on the Road to Higher Sea Level
This is a very nice article. I just have a quibble. To my ear, the metaphor of a speed bump in sea level rise stongly suggests a cause for a temporary reduction in the rate of increase. Speed bumbs are designed to force motorists to slow down. But you mean the metaphor just to be heard as a pictural representation of the shape of the sea level function in the vicinity of a local maximum. Googling the phrase "speed bump on the road to..." only seems to return uses that are opposite to the intended meaning of your title. For instance:
"Comparison—A Speed Bump On the Road To Happiness & Simple Living. “Comparison is the death of joy.” ~Mark Twain."
"It's expected to be a fiscal speed-bump on the road to economic recovery that is otherwise looking good."
etc.
-
Rob Painting at 07:23 AM on 30 March 2013Earth Encounters Giant Speed Bump on the Road to Higher Sea Level
Michael Sweet - Not sure about AVISO updates, I check back there periodically. Maybe every 8 weeks?
-
Rob Painting at 07:19 AM on 30 March 2013Earth Encounters Giant Speed Bump on the Road to Higher Sea Level
GCNP58 - I've not run across scientific papers that address this directly. They may exist but I haven't stumbled across them. But nevertheless, this intensified sea level variation coupled to ENSO is implied from climate model simulations in a process known as the intensification of the global water (hydrological) cycle. This is something observed to be well underway, but where observations suggest actual changes are twice that projected by climate models (Durack [2012]). La Nina and El Nino represent extremes in the global weather, so it's where we should expect to see this water cycle intensification (eventually at least).
I would not anticipate that any of the models project the kind of behaviour we have observed recently. The water cycle intensification is more a gradual one in the simulations - even allowing for the greater-than-modelled water cycle observations. It could be that some component, or components, are missing from the models. But then again this could just be some (as yet not understood) aberration and we see a return to smaller multi-year variation.
Another consideration are the continental drainage basins of the Northern Hemisphere. Some of these were once frozen solid, but some have now thawed with global warming and may be starting to contribute to continental storage and drainage of water.
The problem with all of this is that the global observations of these quantities is not robust, and the uncertainty in measurements is large. The reconstructions of global sea level throughout the 20th century are quite varied, which indicates the difficulty. Teasing even weaker signals out of the data is going to take some work.I just thought it useful to point out that there is a scientific expectation that ENSO-related sea level change will grow more variable at the planet gets warmer, and the weather more extreme. Something many readers are perhaps unaware of.
SkS will have more on this in the future.
-
Christopher Gyles at 06:52 AM on 30 March 2013Making Sense of Sensitivity … and Keeping It in Perspective
Question: inasmuch as the ocean, especially the deep ocean, has recently been accumulating heat at a faster than "average" rate due to ENSO variables, do climate sensitivity estimates include factors such as theoretical tipping points, e.g. abrupt methane releases from clathrates? If not, why not?
-
Alexandre at 06:36 AM on 30 March 2013Earth Encounters Giant Speed Bump on the Road to Higher Sea Level
michael sweet at 05:09 AM on 30 March, 2013
Like Horatio Algeranon said elsewhere:
Warming never starts
It only ever stops
Though lower in the past
The temperature always drops.
-
scaddenp at 06:28 AM on 30 March 2013Making Sense of Sensitivity … and Keeping It in Perspective
Elsa, lets get done to tin tacks here. Do you dispute that doubling of CO2 will result in a radiation forcing of 3.7W/m2? Or are you claiming that 3.7W/m2 of extra energy is insignificant?
-
Bob Lacatena at 06:12 AM on 30 March 2013It's not bad
KenD,
20 years is too short of a time frame, and making any one (or three) specific projections is dicey. We're running a one-time experiment that has never happened in the past 100 million years... if ever. There is no solid way to predict exactly what will happen when. We know that bad things are going to start to happen now, but even then, no one will be able to connect the dots and unequivocally say "this is due to climate change."
But things will get progressively worse. The day will come in ten, twenty, or thirty years (maybe more, but I don't think so) when so many different things are happening and changing that the costs will be horrendous.
With that said, whenever that day comes... there will still be more warming in the pipeline. Climate change takes time, even though we have accelerated the process by a factor of 100. So when the day comes that (if you could pick the right variables) you win your bet, it will already be way, way too late to do anything about it. The genie will be out of the bottle. And things will continue to get worse from there.
My favorite analogy for his is the man who jumped off of the roof of a skyscraper, and whenever he passed an open window, he was heard to say "So far, so good."
But, to return to your question: no, I don't think so. There is no one particular parcel of evidence that you can reliably pick now, especially in a time frame as short as 20 years.
-
Rob Painting at 05:59 AM on 30 March 2013Making Sense of Sensitivity … and Keeping It in Perspective
Neal - I think your hunting analogy would get your point across to readers quite nicely.
-
DSL at 05:58 AM on 30 March 2013It's not bad
In other words, KenD, you don't have to wait for 2033. You can win that bet right now.
-
DSL at 05:56 AM on 30 March 2013It's not bad
Sure, KenD.
1. Arctic sea ice will be effectively (<250k km2 area) gone in ten years at summer minimum. According to Funder et al. (2011), Arctic sea ice extent hasn't been lower than current in about 8000 years. The trend is currently greater-than-linear, and the linear trend has it effectively disappearing at summer minimum within eight years, about 70 years ahead of IPCC AR4 projections. Even if we remain stable at 400ppm, sea ice is going to continue to decline thanks to the oceans continuing to move toward their equilibrium climate response to the stabilized forcing.
2. Antarctic and Greenland land ice loss will continue over the next decade at least at the current rate found in Shepherd et al. (2013).
3. Within fifty years, the process of ecological deconstruction or dis-integration will be obvious. Species that can move rapidly will leave their niches and attempt to establish equilibria within environments.more suitable to their current configurations. That may leave some slower and more interdependent species in the lurch. Species may also respond genetically. Then there are species that are up against the wall. A wide range of studies, if academia is alive and well, should be reporting this type of significant change in the biosphere (already occurring, actually).
-
nealjking at 05:49 AM on 30 March 2013Making Sense of Sensitivity … and Keeping It in Perspective
William Haas:
I spent some time with Miskolczi to try to clarify his argument. I had to stop it after awhile due to the press of other matters, but in principle the discussion is still open, so I don't want to say too much. However, it is fair to say that his approach is rather non-standard.
A discussion group of supporters of his formed to try to rewrite his argument in a more transparent way, but after several months they became discouraged and dissolved.
-
Tom Dayton at 05:48 AM on 30 March 2013Making Sense of Sensitivity … and Keeping It in Perspective
William Haas, background on how the Miskolczi mythology arose is at The Climate Denier List. Scroll to the bottom of that page for links to even more debunkings, and go to the Real Climate Wiki for yet more.
-
nealjking at 05:42 AM on 30 March 2013Making Sense of Sensitivity … and Keeping It in Perspective
elsa:
There are certainly equations and calculations relating the radiative forcings and the concentrations of the greenhouse gases. They are a bit complex, because the impacts of the different gases depend on the distributions of the gases throughout the atmosphere, and even at a given frequency they do not add linearly. Nonetheless, there is nothing mysterious about them.
Your concern about the scantiness of CO2 is ill-placed, for two reasons:
- The bulk of the atmospheric molecules do not absorb in the infrared (IR). Therefore, it does not matter how many there are of them. It is only the greenhouse gases (primarily H2O and CO2) that interact with the IR, so the question boils down to, Are there enough H2O and CO2 molecules to catch the IR photons? It turns out that there are. What matters is the absolute numbers of H2O and CO2 molecules; their proportion to other molecules in the atmosphere is totally irrelevant.
- Concerning the proportion of CO2 relative to H2O: Here one could make an argument that H2O swamps CO2, for the IR spectral bands they both absorb. However, H2O does not get above 10 km in altitude, whereas CO2 gets up to 100 km. In the theory of the greenhouse effect, the high-altitude molecules have a much more significant impact on the steady-state radiative balance than the low-altitude molecules, so CO2 dominates H2O for their common IR bands.
-
Tom Dayton at 05:35 AM on 30 March 2013Making Sense of Sensitivity … and Keeping It in Perspective
William Haas, Miskolczi (you misspelled his name) is so wrong that even skeptic Roy Spencer dismisses him. Barton Paul Levenson provides more technical dissection. Full blown technical takedown is provided by Science of Doom.
-
Dikran Marsupial at 05:33 AM on 30 March 2013It's not bad
@KenD 50 years of cooling whilst atmospheric CO2 continues to rise, without evidence of substantial changes in the other forcings would constitute a pretty sound falsification I would have thought. The good thing is that many climate models are available in the public domain, so at least the models are easily falsifiable by plugging in the observed forcings and seeing if the models can explain the observed climate.
-
KenD at 05:20 AM on 30 March 2013It's not bad
Having occasionally lurked for some time on SkS, I have a longstanding question for anyone who like to take a crack at it. I'd like to be able to offer to some of my skeptical friends and family an example of how AGW might be falsified. Let's say I'm conversing with a skeptic who (perhaps grudgingly) admits the reality of modest AGW but who considers it nothing to fret over, and certainly nothing to justify government intervention. Is there some precise, quantifiable outcome I can predict will obtain within 20 years from now if C02 remains above 400 ppm (or 450 or 500 or whatever), such that if it doesn't happen, I would have to concede I was mistaken as a "warmist"? Something along the lines of Haldane's famous rabbit in the Cambrian? Something I could place money on and collect in 2033?
For example, could I say, if C02 remains above 400 ppm, then if by 2033 the global sea level average hasn't risen by at least 6 inches (or whatever) or the surface area of the Maldives has not been reduced by 10% (or whatever) or the Antarctic has not lost more than 5% (or whatever) of its ice volume or some other precise costly catastrophe does not occur before then, then we warmists were all mistaken?
-
michael sweet at 05:09 AM on 30 March 2013Earth Encounters Giant Speed Bump on the Road to Higher Sea Level
I expect WUWT will run a correction for their claims that the pothole two years ago was an indicator that sea level rise was slowing. Not.
The rise is steeper that I expected it to be. Hopefully it will slow down again soon.
Nice article Rob. How often do they update the AVISO website with the graph you show?
-
William Haas at 05:00 AM on 30 March 2013Making Sense of Sensitivity … and Keeping It in Perspective
Considering the number of models and the large range of estimated sensitivities, it seems that the estimates are little more than guesses.
Then there is the work of Ferenc M. Miskokze who has performed analysis that claims that any effect that adding CO2 to the atmosphere would have on climate is compensated for by negative feedback of H20 in the upper atmosphere.
H2O is modeled as a positive feedback to added CO2 in the lower atmosphere because CO2 warming allows more H20 into the atmosphere which causes even more warming. But in the upper atmosphere the situation is reversed. More CO2 causes the upper atmosphere where LWIR radiates to space to cool. If the earth radiates less in the upper atmosphere then the result will be a net gain in energy by the earth. Cooler upper atmospheric temperatures in the upper atmosphere reduce H2O content. Less H2O contallowsowes more heat to travel up to the upper atmosphere causing temperatures there to rise and the global energy output to space to rise. This negative feedback in the upper atmosphestabilizesizes the climate to changes in green house gasses.
Moderator Response: [TD] The name is spelled Miskolczi. -
Bob Lacatena at 04:58 AM on 30 March 2013Making Sense of Sensitivity … and Keeping It in Perspective
elsa,
one of the things the Economist did was doubt climatology,
False. The article is close to 3,000 words, all of it citing climate science reports and studies as its foundation. How can you possibly claim that that means the article doubts climatology?
What we are not told is the age of the models under investigation.
False (and off-topic). There is a wealth of information available on all of the models, and they are continually being improved and expanded. That no one has sent a personal delivery boy to hand you a gilded copy of the details of the models is no one's fault. You need to go do some research and educate yourself.
All it is doing (and the models likewise) is fitting the data to the theory.
False. This is off-topic, so I will not bother to discuss it here, but your misunderstanding of the science is pitiful. Both the models and how CO2 affects temperatures are entirely derived from physics. You are quoting nonsense that you've read at idiocracies like WUWT.
You are repeatedly, embarassingly wrong. Follow the links above, open your mind, and actually read something. Repeating falsehoods that you read somewhere on the Internet does not make them true.
Prev 926 927 928 929 930 931 932 933 934 935 936 937 938 939 940 941 Next


