


 Arguments


Recent Comments
Prev 929 930 931 932 933 934 935 936 937 938 939 940 941 942 943 944 Next
Comments 46801 to 46850:
-
JasonB at 15:39 PM on 27 March 2013The Big Picture (2010 version)
tcflood,
This is actually a better resource for finding peer-reviewed "skeptical" papers than those I gave before, sorted by subject matter. Click on the subject and SkS will list all the peer-reviewed papers known on that topic, categorised as pro-AGW, neutral, and "skeptical". If you know of any that haven't been included, you can just click on the buttons provided to add them to the database.
Regarding clouds, I think an important point to make about the uncertainty surrounding them is that the uncertainty is likely because they don't seem to be a strongly positive or a strongly negative feedback. Clouds certainly do have a big impact, but it's the change in that impact in response to AGW that's uncertain, and the change so far has been minimal (very slightly positive feedback, if anything).
In terms of physical principles, we have the direct warming caused by the increase in CO2 concentrations and the amplification of that warming by the increase in water vapour, which roughly doubles the CO2 impact. I have seen "skeptics" try to conflate water vapour feedback (which is both theoretically and empirically demonstrated) with the uncertainty surrounding cloud feedbacks (which is very hard to predict from first principles and must therefore be determined empirically) as a way of dismissing the water vapour feedback, but that is wrong.
Beyond that we have a range of feedbacks with different levels of certainty. Just off the top of my head:
Reduction in snow and ice is obviously a positive feedback due to lower albedo, and to make things worse, to date the rate of reduction seems to be grossly underestimated by models.
Increased desertification is presumately a negative feedback (since deserts have higher albedo than vegetation), but I don't think it's enough to counter the loss of snow and ice (and doesn't seem like something to hope for anyway).
Release of methane from continental shelfs and permafrost is a positive feedback.
Reduction in the ability of the ocean to absorb CO2 with increasing temperature (and, eventually, outgassing of CO2 from the oceans when the temperature gets high enough) is a positive feedback.
Changes in clouds, both in coverage and mix of types, is an unknown feedback but due to the lack of any real change to date should probably be assumed to be pretty much a wash (i.e. neither strongly positive or negative).
One thing you'll find is that people who have an a-priori belief that the climate cannot possibly change too much (for religious reasons, in the case of one prominent "skeptical" scientist) go searching for possible negative feedbacks that might counteract all of those positive feedbacks, and clouds often feature high on their list. (Deserts, not so much.) Not because the evidence tells them that clouds must be a net negative feedback, but because the uncertainty surrounding clouds allows them to believe that they might be — wishful thinking, in other words.
Presumably these same people don't take out insurance for much the same reason. Personally I prefer the Arab proverb, "Trust in God but tie up your horse".
-
barry1487 at 14:55 PM on 27 March 2013New Research Confirms Global Warming Has Accelerated
Regarding heat flow between the ocean and atmosphere, keep in mind that hte average surface temperature of the global oceans is about 17C, which is warmer than the near-surface atmosphere (on average). Heat exchange occurs at the boundary (surface water/air), so it is not a case of a cooler ocean warming a warmer atmosphere - on average.
In reality, there is constant flux with sea surface temps being at different times and places, cooler and warmer than air temps. This is the weather, and is largely responsible for heat flow between atmosphere and ocean.
But a couple of analogies above cover the possibilities. The oceans and atmosphere are at different temperatures, but they will affect the other if the energy in either is changed. Heat or cool either one, and the other will heat or cool accordingly. If I've been using ice cream to whiten my coffee, then using milk instead - even though it is cooler than the coffee - will result in hotter coffee than when I used ice cream. (I like that analogy, Leto)
Same with the upper and lower atmosphere. If you were able to heat the stratosphere, the troposphere below would also warm up, even though the stratosphere is cooler than the troposphere. The dynamics that keep them at different temperatures do not stop heat flowing between them.
-
keithpickering at 14:31 PM on 27 March 2013The two epochs of Marcott and the Wheelchair
The Anthropocene uptick as represented in Marcott Figure S3 (Supplemental Materials) is confirmed almost perfectly with the data of Anderson et. al. 2013, "Global warming in an independent record of the past 130 years”, GRL 40:1, 189-193.
Anderson's data is 173 recent temperature proxies covering 1730-1995 at (typically) annual resolution. Derating this data (and HADCRUT4) to 20-year means shows almost perfect overlap between Anderson and HADCRUT4 on the recent end, and almost perfect overlap between Anderson and Fig. S3 on the older end.
-
jyyh at 13:07 PM on 27 March 2013The two epochs of Marcott and the Wheelchair
cynicus, lol to the video. see also this image
-
The two epochs of Marcott and the Wheelchair
Tom Curtis - While the Marcott et al 2013 paper takes a bit of reading for this, they state that they aligned to Mann et al 2008 "over the interval 510-1450 yr BP (i.e. 500-1440 AD/CE)", which was itself aligned to the CRU-EIV temperatures, or HadCRUT3 (Supplemental, starting at line 98).
-
tcflood at 12:09 PM on 27 March 2013The Big Picture (2010 version)
174-180
I am astounded by the quality of your responses. You have given me a lot to pursue and think about. Thank you all for taking the time to respond so thoughtfully.
-
Tom Curtis at 12:02 PM on 27 March 2013The two epochs of Marcott and the Wheelchair
Correction to my post 8. In it I say that the comparison is made to the NH temperatures from Mann 08 EIV plus HadCRUT3. On closer examination it appears more probable that the comparison is with the global land temperatures. Certainly the global land ocean reconstruction does not show the same pattern, nor so high a rise in temperatures in the instrumental record. (See figure S6 e and f)
-
K.a.r.S.t.e.N at 11:57 AM on 27 March 2013The two epochs of Marcott and the Wheelchair
What Tom Curtis said. In the interest of providing sound and intangible information, a clarification which addresses the confusion between the (unreliable) uptick and Marcotts conclusion based on Fig.3 (rather than the uptick) should be added in my opinion. Thanks Tom!
-
Tom Curtis at 11:38 AM on 27 March 2013The two epochs of Marcott and the Wheelchair
The post above refers to the "...he rapid temperature rise since 1850 ..." that "...is clearly visible in the graphs ...". The problem is that most of that rapid rise is an artifact rather than a valid reconstruction. This is clear if you look at the supplemental data, which shows a "reconstructed" temperature of 0.6 C above the 1961-1990 average in 1940. That is, it shows a temperature approximately 0.1 C higher than the 2000-2009 average in 1940. You can see this if you have a close look at Fig 1 A of Marcot et al:

(Note that the Mann08/HadCRUT splice is NH temperatures only, and shows a 0.2 C greater increase than the global temperatures).
The majority of this artifact is the result of the drop out of colder proxies in the 19th and 20th centuries, as explained with typical clarity by Tamino. He uses a method of differences to eliminate the artifact:
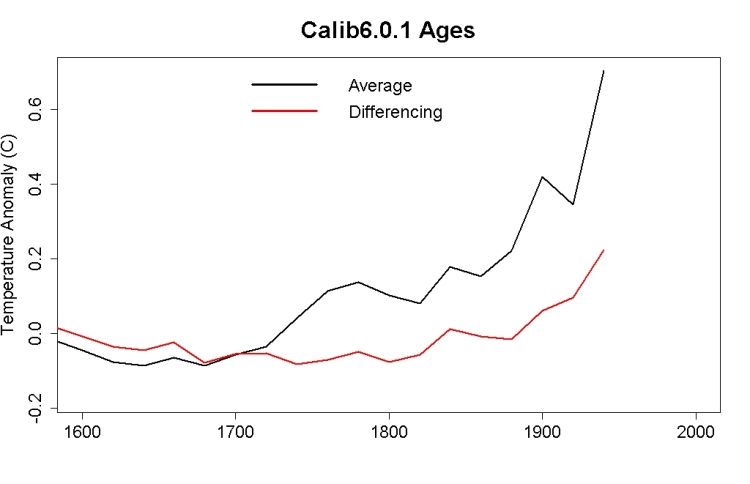
He also shows that the differenced method and the RegEm method (used as a robustness check in Marcott el al) show very similar results, and hence results consistent with the modern temperature record:
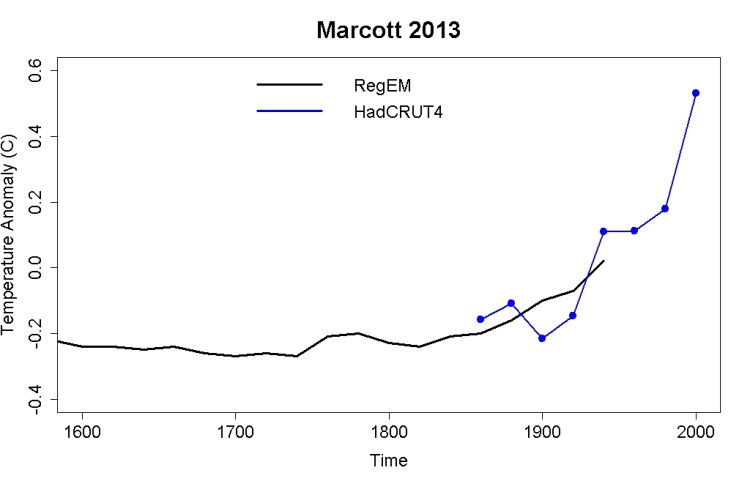
(Source)
I note that Steve McIntyre is suggesting that the redating of some proxies by Marcott et al is also a major factor in the uptick. I think he has made a sound case that Marcott's redating of some of the proxies is not jus a consequence of the use of the Calib6.0.1 calibration of C14 dates (which is justified), but also of some mistaken assumptions about the relationships of core tops to the actual sea floor for some cores. Specifically, Marcott et al appear to believe that the core tap is the sea floor, whereas (apparently) in fact the upper most sections of the core are often lost, presumably due to being less compacted and hence unable to withstand the mechanical stresses from being cored. Craig Loehle goes so far as to suggest this is grounds for withdrawing the paper.
What neither McIntyre nor Loehle appear to discuss is the difference it makes:
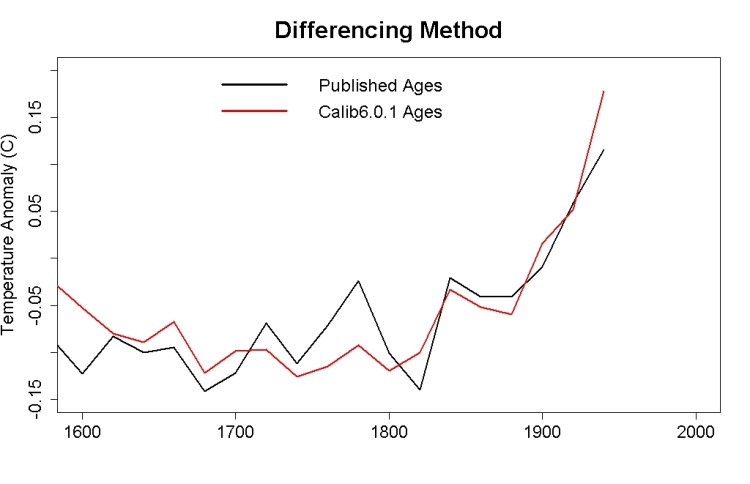
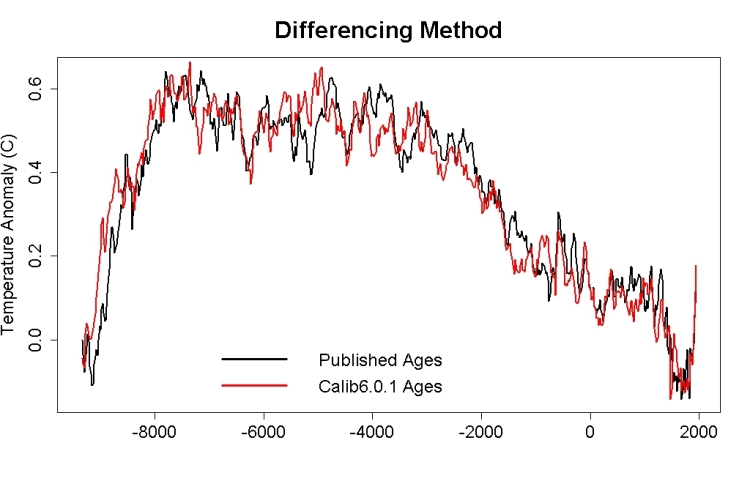
(Source)
As can be seen, the difference is negligible. This apparent error surely requires no more than a corrigendum. I do not expect that to be recognized at Climate Audit, however, where the focus is always on one sidedly nitpicking errors (even those that don't exist), rather than on actually discovering facts about the world.
Very importantly, the comparison between modern (2000-2009) temperatures and Holocene temperatures is not based on the uptick, which Marcott et al described as not robust. Rather, they are based on the HadCRUT3 instrument record for 2000-2009 which is compared statistically to the probability distribution of Holocene temperatures are reconstructed in Marcott et al. Thus, the most important graph in Marcott et al is not Figure 1 B (the figure normally shown, and shown above), but Figure 3, which shows the comparison:

Marcott et al comment:
"Our results indicate that global mean temperature for the decade 2000–2009 (34) has not yet exceeded the warmest temperatures of the early Holocene (5000 to 10,000 yr B.P.). These temperatures are, however, warmer than 82% of the Holocene distribution as represented by the Standard5×5 stack, or 72% after making plausible corrections for inherent smoothing of the high frequencies in the stack (6) (Fig. 3). In contrast, the decadal mean global temperature of the early 20th century (1900–1909) was cooler than >95% of the Holocene distribution under both the Standard5×5 and high-frequency corrected scenarios. Global temperature, therefore, has risen from near the coldest to the warmest levels of the Holocene within the past century, reversing the long-term cooling trend that began ~5000 yr B.P. Climate models project that temperatures are likely to exceed the full distribution of Holocene warmth by 2100 for all versions of the temperature stack(35) (Fig. 3), regardless of the greenhouse gas emission scenario considered (excluding the year 2000 constant composition scenario, which has already been exceeded). By 2100, global average temperatures will probably be 5 to 12 standard deviations above the Holocene temperature mean for the A1B scenario (35) based on our Standard5×5 plus high-frequency addition stack (Fig. 3)."
(My emphasis.)
I note that when JosHag published this post on his own blog, the uptick in the Marcott reconstruction had not been discussed significantly, so it is understandable that he did not pick up the problem. That is no longer the case, and an addendum clarrifying the issue should be added to the post (as not all readers will read as far as my comment).
-
EliRabett at 11:36 AM on 27 March 2013The two epochs of Marcott and the Wheelchair
Wheelchair, and we are in it.
-
Tom Dayton at 11:21 AM on 27 March 2013The Big Picture (2010 version)
tcflood, you are in danger of finding yourself in the company of "skeptics" you claim to not belong with, because many of them exaggerate uncertainty. There is a wide range of possible responses to the knowledge of current and coming climate change. Some are more disruptive and expensive than others. The normal approach to decision making in any arena is to estimate the costs and benefits of each candidate course of action--with doing nothing being in fact one of those courses of action. Then leaven that "value" (or more appropriately its (subjective) "utility") of each course of action with its probability (often more appropriately the "subjective probability").
In the case of climate change, you should at least start by looking at the most probable climate change consequences (not 1 degree by 2100, not 6 degrees by 2100): see "It's Not Bad". Then evaluate which courses of action have expected values/utilities at least equal to the values/utilities of those most probable climate changes.
-
JasonB at 11:18 AM on 27 March 2013The Big Picture (2010 version)
tcflood,
As John Hartz pointed out, the issue is really the assertion "and therefore represents a large source of unreliability in the models", which is begging the question and needs support.
Back to your original complaint, which was that the statement
to be skeptical of the arguments adduced for anthropogenic global warming you must be asserting that the principles of physics are wrong
was an appeal to authority.
You are attempting to suggest that the models may not necessarily accurately reflect the principles of physics and so therefore this claim is unwarranted.
However, there is more than one way to skin a cat, and so it is with physical models. It turns out that while complicated GCMs are very important tools for assessing regional impacts and interactions within the climate system, you can actually go a very long way with a very simple energy balance model that clearly and obviously does implement basic physical principles and yet gives much the same result as full-blown GCMs do, at least on a global scale (and therefore for measures like global temperature anomaly). Hence the statement you objected to.
In addition, we have empirical observations supporting the theory, and SkS has a page dedicated to the reliability of climate models. Note, however, that climate models form just one small part of the evidence for AGW. Nevertheless, courtesy of Barton Paul Levenson, here is a list of successful climate model predictions, each supported by links to the literature (as far back as 1896):
That the globe would warm, and about how fast, and about how much.
That the troposphere would warm and the stratosphere would cool.
That nighttime temperatures would increase more than daytime temperatures.
That winter temperatures would increase more than summer temperatures.Polar amplification (greater temperature increase as you move toward the poles).
That the Arctic would warm faster than the Antarctic.
The magnitude (0.3 K) and duration (two years) of the cooling from the Mt. Pinatubo eruption.
They made a retrodiction for Last Glacial Maximum sea surface temperatures which was inconsistent with the paleo evidence, and better paleo evidence showed the models were right.They predicted a trend significantly different and differently signed from UAH satellite temperatures, and then a bug was found in the satellite data.
The amount of water vapor feedback due to ENSO.
The response of southern ocean winds to the ozone hole.
The expansion of the Hadley cells.The poleward movement of storm tracks.
The rising of the tropopause and the effective radiating altitude.
The clear sky super greenhouse effect from increased water vapor in the tropics.
The near constancy of relative humidity on global average.
That coastal upwelling of ocean water would increase.Nobody would expect you to read all 161 previous postings, but it wouldn't hurt to check if the comments you want to make have already been addressed by any of them.
Regarding peer-reviewed research: I, too, have seen some absolute rubbish published, and I have refereed papers as well. Everyone knows that simply appearing in the peer-reviewed literature is not a guarantee of quality (as evidenced by the rebuttals to certain papers on this very site). However, "the other side" either doesn't even manage to pass that hurdle, or when they do, what they publish doesn't say what they claim it does, or it ends up being one of those aforementioned rebutted papers. There is an enormous volume of research on the one side that all points to a consistent picture, and there is a tiny amount of work on the other side that is invariably inconsistent with each other and, almost invariably, fundamentally flawed, often even to a casual observer.
(SkS even goes so far as to help people find the publications of the "other side", by person as well as by date, so they can see for themselves! Is there a better repository of anti-AGW research on the Internet?)
It would be perverse indeed therefore to put the "two sides" on equal footing, regardless of how many bad papers you've seen published.
-
scaddenp at 11:17 AM on 27 March 2013The Big Picture (2010 version)
Pers. comm. comments from unnamed paleoclimatogist arent easy to pursue because cant see papers on which he bases opinions, but unless this Bob Carter, I would say he is somewhat uninformed on current literature. However, as a general point, paleoclimatology suffers from unconstrained problems. The discipline is important because obviously any theory of climate must work for past climate as well as present and so it is a "testing" ground for theory. However, paleoclimate abounds with problems where there is insufficient data to constrain one possibility against another. In particular you have uncertainty in forcings as well as uncertainty in observed cliamte. While interesting and areas for active research, they arent that relevant to climate for the next 100 years.
That said, the broad picture for glacials with known (eg see fig 3 here from Hansen and Sato 2012) but disentangling the relative sources and influences of CH4,CO2 etc is work in progress.
-
The Big Picture (2010 version)
tcflood - "It's just that in such complex systems it's hard to know how reliable they are without more extensive testing..."
If you have read the Fourth Assessment report (commonly referred to as AR4), you will note the rather huge number of relevant references (here for aerosols, and here for attribution).
I hate to say this, but you appear to be demanding perfection - we have sufficient data to constrain uncertainty within various bounds (depending on the specific topic), and using the Precautionary Principle, anything within those bounds is worth worrying about, worth acting upon. What for you would be sufficient evidence, sufficient testing? Must we 'wait and see' while ignoring what knowledge we have?
-
tcflood at 10:57 AM on 27 March 2013The Big Picture (2010 version)
174
Thanks, John, I'll check it out.
-
tcflood at 10:55 AM on 27 March 2013The Big Picture (2010 version)
John Hartz
You have put your finger on the biggest issue I have with the modeling. How do we assess the uncertainty? I have Figure SPM.4 on page 11 of the Fourth Assessment of calculations of temperatures using natural and anthropogenic forcings. It is very impressive. In fact, it is the single biggest reason that I am not on the skeptics side. It's just that in such complex systems it's hard to know how reliable they are without more extensive testing, which of course we don't have the luxury of here until it's too late.It is also extremely easy for group think to overwhelm an (intellectually) isolated group of people.
I might say in passing that the second reason that I'm not with the skeptics is that I believe the Precautionary Principle is philosophically defensible and of great practical importance. (Not just an emotional reaction as I have seen claimed in contrarian publications.)
-
John Hartz at 10:48 AM on 27 March 2013The Big Picture (2010 version)
@tcflood:
Recommend that you peruse the SkS article, New tool clears the air on cloud simulations . Please not that it was posted in Nov, 2011.
-
Tom Curtis at 10:43 AM on 27 March 2013Most of the last 10,000 years were warmer
Lanfear @22, AWS?
-
tcflood at 10:37 AM on 27 March 2013The Big Picture (2010 version)
Moderator and scaddenp:
Sorry, I was using FAR to mean the Fourth assessment Report published in 2007. The chart on page 4 lists the level of confidence of understanding of various forcings.
Also, with regard to how science is done, I am a retired emeritus chemist who did research for 40 years (48 if you include my education). This is not an appeal to authority, just an attempt to point out that I know something about how it's done. I am not a denialist and I lean more toward accepting IPCC predictions than against. It's just that in my many years as a scientist I have seen many publications in refereed journals that were absolutely wrong. Lots of perople who made more far-reaching claims what were poorly or falsely based. I have refereed many papers where the authors were extremely authoritative but wrong. So please permit me to be a little cautious about accepting everything that either side says.
-
John Hartz at 10:36 AM on 27 March 2013The Big Picture (2010 version)
@tcflood #16:
Thanks for you reponse to my initital question.
OK. I will concede that the scientific understanding of how clouds and aerosols impact the Earth's climate system is incomplete. I am, however, more interested in the second part of your sentence, i.e., "...and therefore represents a large source of unreliability in the models." How do you this to be true? How much is a large source of unreliability in the models." Does this amount of unreliability appear equally in all climate models?
-
scaddenp at 10:15 AM on 27 March 2013The Big Picture (2010 version)
tcflood - IPCC FAR was published in 1990. You have been pointed to more up to date data. Also please dont mistake "there is uncertainty" with "we dont know anything". Uncertainty constrains the confidence with which we can predict things. While there is no "authority", science starts with peer reviewed research. This inevitably has more value than unreviewed comments stuck on a blog somewhere. For that reason, this site refers back constantly to the peer-reviewed literature.
While there is no final certainty in any part of science, policy must be guided by the best state of knowledge that we do have. If new data changes the model, then it changes, but it would be madness for policy makers to ignore the consensus of climate science.
-
tcflood at 10:15 AM on 27 March 2013The Big Picture (2010 version)
Moderator,
Is there an address where I can speak freely with you without anything appearing on this site even transiently? You have my email address so you can answer there.
Moderator Response: [DB] Check your email. -
tcflood at 10:10 AM on 27 March 2013The Big Picture (2010 version)
I defense of the main assertion in 162 regarding appeal to authority, I mentioned our lack if detailled understanding of the drivers of glacial/interglacial dynamics. I made the same comment in a personal exchange with a paleoclimatologist (so I won't give his name) at a major university and his response was "With regard to timing of glacial cycles, my view is that these cycles are nonlinearly phase locked to the Milankovitch forcing but that either the cryosphere, carbon cycle, or both give the longer timescale [than the resultant frequency of the Milankovich cycles]." That doens't sound like settled science to me.
-
tcflood at 09:57 AM on 27 March 2013The Big Picture (2010 version)
(More moderation complaints snipped-).
Moderator Response: [DB] If you had bothered to read the Comments Policy you were directed to read, you would have noted that moderation complaints are frowned upon in this establishment. FYI. -
tcflood at 09:53 AM on 27 March 2013The Big Picture (2010 version)
To John Hartz: Thanks for your response.
It is stated in the paragraph "There are legitimate unresolved questions" in the article at the top. Also, the IPCC's FAR classifies the state of knowledge of areosols and clouds as "low". Every textbook that I have consulted states the same thing. In a talk in LA a couple of weeks ago a climatologist at UCLA made the same comment. I just assumed that that would not be a controversial statement on this website.
-
tcflood at 09:38 AM on 27 March 2013The Big Picture (2010 version)
(-Moderation complaints snipped-)
Moderator Response: [DB] You were given the guidance you both requested and needed. Choosing to ignore it is not a wise course of action. FYI. -
tcflood at 09:18 AM on 27 March 2013The Big Picture (2010 version)
Can you respond to the point and then we can debate your assertions?
Moderator Response:[DB] For the issues surrounding the resolved temperature/CO2 lag, take that portion of the discussion to this post here. For a discussion on cloud feedbacks, see here. For aerosols, see this thread here and also this thread here.
It is advised to also temper the tone of one's own remarks before casting stones at others. Please review this site's Comments Policy.
-
Lanfear at 08:41 AM on 27 March 2013The Big Picture (2010 version)
"Everyone knows ... If we don’t fully understand the (apparently minor)..."
Curious that you start off with an accusation of argument fallacy, yet you yourself deem it fit to use both argumentum ad populum as well as Inflation Of Conflict (or is it just a personal argumentum ad ignorantiam) to shore up your claims.
-
cynicus at 08:07 AM on 27 March 2013The two epochs of Marcott and the Wheelchair
I think this short (5s) video describes the curves of the graph better:
http://www.youtube.com/watch?v=GFaK2RQcx_M
Or simply: brick wall -
Lanfear at 08:07 AM on 27 March 2013Most of the last 10,000 years were warmer
Yes, I agree with you that to properly compare (or splice in this case) apples with apples, using GRIP to project the temperature into current time.
So, is the problem (with my attempt at extending the GISP2) to modern time, that GISP2 is showing a different temperature than what the AWS a the summit is producing, perhaps the actual surface (or should that be the firn) temperature vs. 2m above?
And to get my facts correct, the proper splicing shows that the current temperature is higher than any point in the MCA, but we have some spikes going above current temperature BCE?
PS. Is there a reason why this article does not show up in the argument list?
-
John Hartz at 07:51 AM on 27 March 2013The Big Picture (2010 version)
@tcflood #162:
You have stated, Everyone knows that our understanding of aerosols and cloud dynamics is incomplete and therefore represents a large source of unreliability in the models.
Is this global assertion your personal opinion, or can you cite the sources from which it came?
-
tcflood at 07:36 AM on 27 March 2013The Big Picture (2010 version)
I’m new here, and have not had the resolve to read all 161 previous postings, so I apologize if I am going over old territory. I have a problem with the assertion that to be skeptical of the arguments adduced for anthropogenic global warming you must be asserting that the principles of physics are wrong. This is simply an appeal to authority and so is inappropriate.
For example, it is possible that a given AOGCM might be incomplete or of too course resolution to give the best answer. Everyone knows that our understanding of aerosols and cloud dynamics is incomplete and therefore represents a large source of unreliability in the models.
Another example is the serious lack of detailed understanding of the origins of glaciation and warming over the last 500K years, including the CO2 concentration lag. If we don’t fully understand the (apparently minor) roll of CO2 over that time period can we be sure we fully understand its roll now? There is much we still don’t understand. Does this mean that we don’t understand the fundamentals of physics?
-
vrooomie at 07:32 AM on 27 March 2013The two epochs of Marcott and the Wheelchair
"Wheelchair" is a bad nickname; 'scythe' is much, MUCH better a descriptor.
-
DSL at 06:56 AM on 27 March 2013The two epochs of Marcott and the Wheelchair
I prefer "bee smack."
-
Michael.M at 06:33 AM on 27 March 2013The two epochs of Marcott and the Wheelchair
Wheelchair?!? Are you serious? One of the most lame names imaginable für this clear depiction of manmade desaster in the making....
I prefer the "scythe", at least for the part Marcott/emission-scenario -
Potomac Oracle at 05:28 AM on 27 March 2013Arctic freezing season ends with a loud crack
By the way, have you considered doing a piece on methane hydrate dissociation in the Arctic? That is, about the methane/fresh water/hydrate--linkage and the occurrence of unusual weather events including Arctic ice melt, permafrost melt, ocean dead zones,mass animal kills, and drilling for fossil fuels?I've look at the effect of fresh water and chemicals pumped under the earth's crust and into the permafrost and ask, is this the only source of fresh water under the earths crust to combine with methane forming its hydrate in the hydrate stability zone? These hydrates cannot form in salt water. If they could there would be a methane hydrate stability zone circling the globe at depth and atmosphere and in the Arctic there would be a similar near surface zone of these hydrates.The essential point is that absent pouring approx. 3 million gal. of fresh chemically treated water into each bore hole, there would be significantly fewer hydrate zones. However as you know, hydrate zones are ubiquitous wherever the oil & gas man dipped his drill. They knew about these hydrates during WWII when their pipelines clogged and they freed them with salt water and then, later on, methanol. They also knew that vast amounts of methane would be released and began flaring it. However, what they didn't count on was that methane seepage resulting from hydrate dissociation would become pandemic. Nor, did they figure that methane hydrate dissociation would cause subsidence in the oceans floor creating fissures, cracks and the proliferation of Pingoes; from which even more methane is released. Eventually, some of this methane enters the atmosphere, and that's where the linkage needs to be researched, indeed, verified.What we need to measure now, is the global occurrence of methane and the oxidants of methane; formaldehyde, water vapor and CO2.. We need to understand how it migrates, how long it remains in snow, streams, and the atmosphere before oxidizing to carbon dioxide. We can only speculate about the amount of methane released during the Horizon disaster. We do know that formaldehyde destroys soft tissue, like that of bees, bats, frogs, bovine soft tissue, human lungs and nasal membranes. I wonder if the formaldehyde, which causes this acidosis is responsible for some of the mass animal kills of late? I wonder if the methane uptake has released so much water vapor that it has absorbed heat from the atmosphere creating the current spate of weather anomalies? -
Rob Painting at 05:04 AM on 27 March 2013New Research Confirms Global Warming Has Accelerated
BJ Chip - Note that observations do lend support to the modelling shown in Meehl (2011). For instance: Decadal Spinup of the South Pacific Subtropical Gyre - Roemmich (2007).
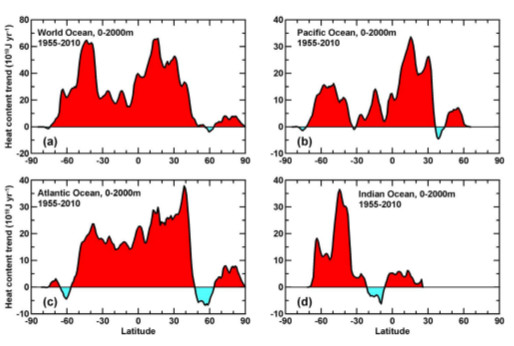
And the observed warming of the oceans shows heat penetrating down to the depths, in ocean basins, at the latitudes occupied by gyres (large slowly rotating masses of water). As in the figure below from Levitus (2012).
It will be very interesting to read the follow up paper to Balmaseda (2013).
-
Rob Painting at 04:31 AM on 27 March 2013New Research Confirms Global Warming Has Accelerated
Craig King - Further to Bob Loblaw's comments; that global surface air temperatures are warming faster than upper ocean temperatures is well-observed and completely uncontroversial.
You will have to reconsider what you think you know about this topic. Consider, for instance, that the heat capacity of the ocean is about a thousand times that of the atmosphere. What happens when this ocean heat is exchanged with the overlying air?
-
John Hartz at 04:30 AM on 27 March 2013Recursive Fury: Facts and misrepresentations
@Geoff Chambers and Tom Curtis:
Please stay on topic and stop going off on tangents.
-
jyyh at 04:15 AM on 27 March 2013The two epochs of Marcott and the Wheelchair
OK, Wheelchair it is.
-
dhogaza at 03:22 AM on 27 March 2013The two epochs of Marcott and the Wheelchair
Our Changing Climate, not Our Climate Change ...
-
Doug Bostrom at 03:07 AM on 27 March 2013Recursive Fury: Facts and misrepresentations
Geoff: ...anonymous on-line surveys like the one on which LOG12 is based are inherently useless...
Just so we don't go too far off the path of facts, it's worth noting that Geoff's remark is a guess and as well is wrong, while in reality the authors of LOG12 used methods shown to work in work performed by other researchers. Indeed, the entire paper was an extension of previous research, employing accepted research tools and with findings paralleling earlier results in terms of connections between ideology and acceptance of particular hazards and risks. The replication of other previous findings by other workers embedded in LOG12 speaks volumes about the validity of the research methods employed in producing LOG12.
If Geoff had by some remarkable circumstance been correct in his guess, we'd then be witnessing the birth of a revolution in social science research, the upheaval of a train of thought extending decades back in time, performed by a vast number of individuals.
Moderator Response: [JH] Please resist the urge to feed the troll. -
Bob Loblaw at 02:40 AM on 27 March 2013New Research Confirms Global Warming Has Accelerated
Craig King: "evaporation ... cannot raise the temperature of the air above that of the ocean."
Evaporating water at the surface requires energy - lots of it. As the water vapour rises, it will eventually condense and form clouds, and then rain out. Globally, it's pretty hard to have a situation where evaporation and precipitation don't balance out on any reasonable time scale.
What do you think happens to the energy that is released when water vapour condenses back into liquid water? Is there a potential that it affects air temperature?
-
Rob Honeycutt at 02:38 AM on 27 March 2013Recursive Fury: Facts and misrepresentations
Spot on, Sphaerica.
I can attest to the fact that SkS consists on a very wide ideological spectrum of people. In fact, I find that to be true of the broader community of people trying to actively communicate the issues with AGW. I personally find it refreshing that there is such a broad ideological support behind the science of climate change. I don't believe you could say the same about those who reject man-made climate change.
-
Bob Loblaw at 02:33 AM on 27 March 2013New Research Confirms Global Warming Has Accelerated
Pierre-Normand:
I was only thinking in terms of the heat transfer and temperature changes, and have not thought through the implications for sea level rise. My limited understanding is that the pressure changes with depth affect the rate of expansion for a given temperature change, and the actual temperature has an effect, too - e.g., maximum density of fresh water is at 4C, so either cooling or warming at that point will cause expansion. (If water continued to contract as it approached freezing, lake ice dynamics would be very different!) Salinity plays a role on density and movement, too.
...but I think that most of the short-term variations (a few years) are related to the water cycle and movement of water between land and oceans.
-
Bob Lacatena at 02:29 AM on 27 March 2013Recursive Fury: Facts and misrepresentations
geoffchambers says:
The fact that I disagree fervently with everything that Skeptical Science stands for is not a reflection on my state of mind, but on the complexity of a political programme designed to subvert science in the interest of an ideology.
But he's not a conspiracy theorist?
Moderator Response: [JH] Pease resist the urge to feed the troll. -
geoffchambers at 01:57 AM on 27 March 2013Recursive Fury: Facts and misrepresentations
Tom Curtis comment 90
You misundertand my position, and therefore misrepresent it. I’d ignore it because it’s not very interesting for others, except that you seem to be asking the moderators to snip me; so I’d better defend myself.
No. I don’t deliberately contradict myself. I have consistently expressed the idea that anonymous on-line surveys like the one on which LOG12 is based are inherently useless for any enquiry more complicated than “do you like/dislike this article?” If you want to find out what someone thinks, believes or feels, the best way is to chat to them. A street interview is a second best, a telephone interview a poor third, and so on.
My reactions to the conspiracy questions are much like many of the readers of the blogs where the survey was publicised. “Don’t know about that”, “Perhaps yes, perhaps not” and so on. I might very well, give different responses on different occasions, just as I might give different answers as to who I’d vote for or my favourite colour. I’ve sometimes expressed that jokingly in comments about Prince Philip killing Lady Di, etc. I tried to make the point seriously once at Climate Audit, that Steve McIntyre was not justified in removing two “scammed” responses. You can’t arbitrarily decide that liars or cunning bastards should be removed from a survey - it takes all sorts. It would be like doing a survey about petty crime and eliminating a respondent because he nicked your tape recorder.
You will note that in my comment 38 replying to Albatross, I don’t deny the reality of the theory of anthropogenic climate change or anthropogenic global warming. I’m therefore a warmist, and not a denier, according to the criteria of the questionnaire in LOG12. The fact that I disagree fervently with everything that Skeptical Science stands for is not a reflection on my state of mind, but on the complexity of a political programme designed to subvert science in the interest of an ideology. You’re not going to get to the bottom of that by asking if people agree or disagree with anything.
Moderator Response: [JH] You are skating on the thin ice of sloganeering. Please cease and desist or your future posts may, indeed, be deleted. -
A Detailed Look at Renewable Baseload Energy
JvD - I have a number of issues with your arguments:
You have attempted to dismiss baseline support numbers with ad hominem arguments, are now attempting to demonize Greenpeace (not a perfect organization, but then neither are some of the nuclear interest groups you have sourced from), and make claims from a single study that a 1/3 penetration of renewables will be outrageously expensive - others show 50% wind/solar with 80% renewable quite achievable, and right now in the US Iowa has 24.5% of its electricity coming from wind, and South Dakota 23.9%; without bankrupting either.
You have also flatly stated that "Intermittent renewables cannot provide baseload power, per definition", dismissing (on rather poorly supported economic grounds, not technical) the entire opening post and many studies discussed in this thread. Meaning your statement is, so far as you have shown, incorrect. Renewables can provide baseload - whether that's the economic path, and the assumptions used, can still be a point of discussion.
You have not made your case, and your methods of argument weigh against your conclusions.
Instead, you appear (again, IMO) to be convinced that nuclear power is the panacea, dismissing or attacking any other approach, and ignoring or hand-waving issues such as waste disposal, which have not been adequately or socially addressed in the 50 years we've had nukes. You've even proposed ideas like the 1960's truck reactor, which I suspect was abandoned for very good reasons (such as mechanical flaws in the design, or the 150 meter radioactive exclusion zone during operations due to having zero shielding) - and seem blind to the issues with your proposals.
Personally, I feel that nuclear power and its expansion has a place in our future. So do significant amounts of renewable power, improvements in efficiency, synthetic fuels, improvements in energy dispatch, and so on - each can contribute. But in terms of the simple, technical question of whether or not baseload power can be provided by renewables - yes, yes it can, that 'skeptic' myth is (ahem) baseless.
In the meantime, crusading for a single black/white all/nothing solution, attacking other approaches with a blind eye to your own, is not going to be a useful part of the discussion - it's a False Dichotomy fallacy. We have to consider and perhaps implement all options, while being realistic about which issues are myths, and which are real and significant.
---
[ Side note: There have been a couple of posts in this thread where I have been ambiguously linked to or directly quoted for something I have not said! Please pay attention the sources of your quotes. ]
-
dana1981 at 01:09 AM on 27 March 2013New Research Confirms Global Warming Has Accelerated
Salamano @32 - the purple is at least 0-2000m, though I think I recall reading it's even deeper than that, like to 5000 meters. I could be wrong, but that's what I recall.
-
gws at 00:39 AM on 27 March 2013A Detailed Look at Renewable Baseload Energy
gws@392 needs to be amended. My bad, I managed to overlook JvD's comment @389. Neverthless, as CDBunkerson pointed out, your "Intermittent renewables cannot provide baseload power, per definition"-statement appears as a gross generalization.
Prev 929 930 931 932 933 934 935 936 937 938 939 940 941 942 943 944 Next


