


 Arguments


Recent Comments
Prev 930 931 932 933 934 935 936 937 938 939 940 941 942 943 944 945 Next
Comments 46851 to 46900:
-
KR at 10:19 AM on 10 May 2013The anthropogenic global warming rate: Is it steady for the last 100 years?
jdixon1980 - The logarithm of a number increases (logarithmicly) as the number increases, the log decreases as a number decreases. That's by the definition of a logarithm.
If CO2 is rising at eT*N, then speeds up to eT*(N+1) the natural log rise rate will go from T*N to T*(N+1). In other words, if CO2 rises faster over time, the forcing (the log of CO2 change) will also rise faster over time.
I suggest you check your math - time is not the base, it's a multiplier in the exponent.
-
mikeh1 at 10:05 AM on 10 May 2013Who is Paying for Global Warming?
Justin Guay from the Sierra Club is quite skeptical about whether many of these coal plants will ever be built.
Here for example - "Indias coal illusion"
Here is a Greenpeace map of the large Galilee Basin coal development in Australia that Guay refers to.
-
Mike3267 at 07:33 AM on 10 May 20132013 SkS News Bulletin #10: Alberta Tar Sands and Keystone XL Pipeline
I read that the Alberta tar sands development is to include CO2 sequestering. See:Technology Review
Anyone know more about this? -
jdixon1980 at 07:32 AM on 10 May 2013The anthropogenic global warming rate: Is it steady for the last 100 years?
Heh, I just noticed that I applied the chain rule to differentiate ln(t2) instead of just convering it into 2ln(t) and differentiating that - shows my own math is a little rusty... But it doesn't change the result of the second derivative, -2/t2
-
jdixon1980 at 06:57 AM on 10 May 2013The anthropogenic global warming rate: Is it steady for the last 100 years?
DS @7: You said, "increasing CO2 faster also increases its logarithm faster"
I believe this assertion is false, because increasing CO2 faster does not necessarily increase its logarithm faster. By "increasing CO2 faster" I take you to mean that as time marches on, the first derivative of CO2 as a function of time increases, i.e., the second derivative is positive. Thus, I take your assertion to be that if the the second derivative CO2 as a function of time is positive, then the second derivative of the logarithm of CO2 as a function of time must also be positive. If this understanding of what you are asserting is correct, then what you are asserting is false.
As a simple counterexample, let's say CO2 = t2.
t2 is a function that "increases faster" over time, i.e., its first derivative, 2t, increases as t increases, and its second derivative, 2, is positive.
Therefore, if your statement that "increasing CO2 faster also increases its logarithm faster" were true, then the first derivative of ln(t2) should also increase as t increases.
Let's have a look to see if it does:
d ln(t2)/dt = d ln(f)/df * d(t2)/dt, where f = t2 (applying the chain rule)
=> d ln(t2)/dt = (1/f) * 2t = (1/t2) * 2t = 2/t, which decreases as t increases. (I.e., differentiating again to get the second derivative, you get -2/t2 which is negative for all real values of t)
So your broadly stated assertion is false.
Even if we take the example of CO2 being equal to (or proportional to) et, which has a positive second derivative (the first derivative of et is itself, as is the second derivative), the second derivative of ln(e^t) = d2ln(e^t)/dt2= d2t/dt2 = d(1)/dt = 0. In other words, even an exponential relationship of CO2 to time tends to result in a linear relationship between temperature and time. A linear relationship is what the Tung study apparently found, which is not inconsistent with the understanding that emissions are rising exponentially, assuming a simple relationship where temperature change is proportional to the logarithm of CO2 change.
This is not to say that there are no examples of f(t) having d2f(t)/dt2 > 0 where d2(ln(f(t))/dt2 is also > 0. (For example, if CO2 = et^2, read "e to the t squared" then the second derivative of CO2 and the second derivitive of its logarithm would both be positive.) But that's not the same as saying the former implies the latter, which is how I read your premise, on which you apparently based your conclusion that Tung's interpretation of the data was aphysical.
Don't get me wrong, I know next very little about the physics, but based on my understanding of calculus, I suspect you had overlooked this nuance of the math.
-
SEAN O at 00:32 AM on 10 May 2013Cherrypicking to Deny Continued Ocean and Global Warming
scaddenp'
Thanks, Fig. 1 in Levitus makes it clear.
-
John Russell at 23:05 PM on 9 May 2013Who is Paying for Global Warming?
Skeptical Wombat @3
The claim that "China increased its wind power production of electricity be more than it increased its coal fired electricity production last year" is not quite all it seems and should be put in context. So it's true, but one of those outliers that can distort the actual picture.
But don't get me wrong; China is the one country that if it has the will, will find a way, and, because of it's political set up, can turn things round rapidly.
-
gelderon52 at 19:52 PM on 9 May 20132013 SkS Weekly News Roundup #19A
Hello,
I would like to introduce a modest effort of mine and of some colleagues and friends in the field of disseminating the results of climate science. It is titled "The frog that jumped out"
http://thefrogthatjumpedout.blogspot.it/
As I said, it is a modest effort, but the idea is that there are many blogs about climate science, but not so many about communicating climate science. So, we hope to have a bit of an impact in this field and we are trying to do our best.
If you were interested in collaborating with us with your thoughts, papers, or comments, you are most welcome.
Ugo Bardi
-
scaddenp at 14:49 PM on 9 May 2013Cherrypicking to Deny Continued Ocean and Global Warming
Sean O - Sparcity of data is reflected in error bars. Note the increase in size of these at 2003. Its especially noticable in 0-2000 data in the Leviticus 2012 paper
-
sidd at 13:04 PM on 9 May 2013Who is Paying for Global Warming?
The war continues. China is closing older coal plants:
http://www.chinadaily.com.cn/business/2010-07/26/content_11047808.htm
Environmentalists knock down another in India
http://www.huffingtonpost.com/justin-guay/indian-court-strikes-down_b_3203153.html
sidd -
Sceptical Wombat at 12:13 PM on 9 May 2013Who is Paying for Global Warming?
While it is clear that we must do much better at replacing fossil fuels with other forms of electricity generation, we should recognise that some progress is being made. For instance last year China increased its wind power production of electricity be more than it increased its coal fired electricity production. And that is before you count its investment in photovoltaic generation.
Also many of the new coal powered generators are replacing older, smaller, less efficient and dirtier plants, so it is misleading to simply quote the number of new power plants.
-
Mark Bahner at 11:07 AM on 9 May 2013Global Warming: Not Reversible, But Stoppable
(-snip-)
Moderator Response:[DB] And with that, we are done here, as we have erred well into sloganeering territory. Anyone wishing to engage Mark further on this may do so at his blog:
http://markbahner.typepad.com/
Let us return now to the OP of this thread, Global Warming: Not Reversible, But Stoppable
-
Riduna at 10:33 AM on 9 May 2013Who is Paying for Global Warming?
John – As far as I know, the only means of reducing CO2 emissions from fossil fuelled power plants is CCS technology which, in its present form, requires 40%-50% of power plant output to operate. If more effective and cost-efficient technology is not developed, ff power plants will be replaced by power plants fuelled by renewable sources.
That will occur. When depends on the speed with which advances are made in production and storage of electricity.
Thanks for your PS. Quite right.
-
John Russell at 09:52 AM on 9 May 2013Who is Paying for Global Warming?
It's an inevitable fact of life that 'keeping the lights on'—and the population in a state to which they've grown accustomed—will always trump long-term concerns. I believe it's becoming clear that it's only when the costs of 'carrying-on-as-we-are' manifest themselves in the short-term, perhaps as a result of the escalating costs of extreme weather events and their impact on the food supply, will the pendulum swing towards action on climate.
This was driven home to me when I read a paragraph on 'discounting' in the Ereskes/Conway book 'Merchants of Doubt' (p180)—quote:
"A dollar today is worth more to us than a dollar tomorrow and a lot more than a dollar a century from now, so we can 'discount' faraway costs."
This is the mantra of the majority of economists everywhere, and it's this head-in-the-sand, Micawberesque— 'something-will-turn-up'—mindset that drives the economists and lawyers who dominate our political elites.
Regarding CCS; I also think it's inevitable that it will be viewed as a means to make new fossil-fuel fired plants viable—that's why Shell is so keen on it—and never as a means to reduce CO2 from the atmosphere. So, what with inevitable leakages and failures, the GHG ratchet will always be upwards. I hope I'm wrong.
[PS: perhaps the words 'coal-fired' should be added to the title of fig 1?]
-
SEAN O at 08:07 AM on 9 May 2013Cherrypicking to Deny Continued Ocean and Global Warming
In discussing rising OHC, a commenter objected to Levitus etal on the grounds that the data is too sparse, what is the best response?
Thanks in advance.
-
John Hartz at 05:40 AM on 9 May 2013Global Warming: Not Reversible, But Stoppable
I believe we can all agree that humans require food and water to subsist. In the context of the ongoing discussion of what manmade climate change may wrought in the near future, here is very sobering assessment.
"Half the world's population—5.2 billion people—could be doomed to an insecure and greenhouse gas-causing reliance on food imports by 2050, according to a new study.
"In the study appearing in Environmental Research Letters, Marianela Fader of the Potsdam Institute for Climate Impact Research (PIK) and her team looked at water and land constraints affecting national food self-sufficiency, and investigated how cropland expansion and increased productivity could create the potential for greater national food self-sufficiency."
Source: Are We Doomed to Food Insecurity? New study shows billions more people reliant on food imports in 2050 by Andrea Germanos, Common Dreams. May 8, 2013
-
KR at 04:11 AM on 9 May 2013Global Warming: Not Reversible, But Stoppable
My issue with Mark Bahners projections are that they are a combination of cornucopian thinking (all needs for the future can be met by continuing advances in technology, with an underlying assumption of extremely low costs - no limits to growth) and the assumption of numerous black swan events (AI singularity, economic growth an order of magnitude that which has been observed, revamping of all methods of production without economic upheaval, etc).
These are not reasonable assumptions, or realistic projections - they are just wishful thinking.
And they ignore what has been determined to date - that mitigating further greenhouse warming by reducing emissions will be far less expensive than adapting to it later, or diverting the resources/energy to try to sequester CO2 released by continued "Business as Usual" behavior. The economically sensible path is to minimize the GHG problem as much as possible, not to band-aid it later on.
Cornucopian/black-swan goals like his, to me, represent little more than an avoidance of the issues - an attempt to kick the problems down the road under wishful projections that the costs down the road will be trivial.
Personally, I would rather address the issues now - based on supportable economic predictions that current action will cost far less than future re-actions.
-
Rob Honeycutt at 03:33 AM on 9 May 2013Global Warming: Not Reversible, But Stoppable
There is a fundamental fallacy where Mark states:
"The value of this information is a simple matter of science. Science consists of one person predicting “a”, and another person predicting “b” (each with explanations for why they are making their predictions) and then observing to see which predictions are correct (or it could be “c” and neither is correct). Or both persons could agree on “a” or “b” in which case there’s not a point in further debate."
What Mark is describing is a "controlled experiment." His predictions are not controlled experiments. He ignores a certain level of randomness in the system. Just because prediction "a" might have been correct does not necessarily mean that the methods used by "a" were better than those of "b" when the experiment takes place in an uncontrolled environment, like world economics.
Again, you can use various methodologies to establish a range of outcomes in order to better constrain uncertainties about future events. You can't use methodologies to predict the future.
Think of it this way. There is some young, hyper-brilliant kid recently born who has the capacity to understand the AI issue better than anyone ever has. That person could grow up to fundamentally change the future of the human race by the year 2040. But, as fate would have it, that child is killed in an auto accident at age 9.
This is what bugs me about what Mark is putting forth. His "predictions" include highly uncertain events occurring at unknown points in the future. So, relative to how we respond today to the challenges humanity faces down the road, his predictions are completely without value.
-
Tom Dayton at 03:29 AM on 9 May 2013Trenberth on Tracking Earth’s energy: A key to climate variability and change
The links to Trenberth's papers in this post by Trenberth are broken, because all his files were moved to a new spot at UCAR. Will somebody please update the links?
Moderator Response:[DB] All links are now updated; thanks!
-
John Hartz at 01:20 AM on 9 May 2013Global Warming: Not Reversible, But Stoppable
In the context of the ononging discussion of what the future portends, the following paragraph jumped-out at me when I read Tom Englehardt's essay, And Then There Was One: Imperial Gigantism and the Decline of Planet Earth posted May 7 on TomDispatch.com.
"The present capitalist model (the only one available) for a rising power, whether China, India, or Brazil, is also a model for planetary decline, possibly of a precipitous nature. The very definition of success -- more middle-class consumers, more car owners, more shoppers, which means more energy used, more fossil fuels burned, more greenhouse gases entering the atmosphere -- is also, as it never would have been before, the definition of failure. The greater the “success,” the more intense the droughts, the stronger the storms, the more extreme the weather, the higher the rise in sea levels, the hotter the temperatures, the greater the chaos in low-lying or tropical lands, the more profound the failure. The question is: Will this put an end to the previous patterns of history, including the until-now-predictable rise of the next great power, the next empire? On a devolving planet, is it even possible to imagine the next stage in imperial gigantism?"
-
JasonB at 18:51 PM on 8 May 2013Global Warming: Not Reversible, But Stoppable
Mark Bahner @ 105,
You're a "doer" in the field of how AI affects macroeconomic growth?
No, I'm a "doer" in the field of AI, which gives me a much better idea of the problems that need solving and the likelihood of fantasies about its capabilities in the next few decades coming true than a macroeconomist who has NFI about the subject and thinks it all boils down to FLOPS/$.
You know your way around basic economic models like the Solow-Swan model?
As it happens, I actually did some software development for an economics professor to earn extra money while I was a postgrad and my observation at the time was that the problems in economics are either trivial to solve ("You've found an analytic solution! Well done! I'm sure that those simplifying assumptions you made do hold in the real world...") or so intractable that solutions aren't possible (or meaningful). The paper you presented has done nothing to dispel that notion.
No, the computing power is not there. Using an estimate of say, 20 petaFLOPS for a human brain, and the human population is approximately 7 billion. So that’s 140 billion petaFLOPs.
Why would an AI's processing power need to be comparable to the combined processing power of the entire human race? We can't network our brains together to achieve higher levels of intelligence (in fact, evidence suggests the opposite...) so the total figure is meaningless. If a computer had more processing power than a single human brain and we knew how to harness that processing power to create an AI then there's no reason to believe that a smarter-than-human AI wouldn't result. And, unlike humans, we can always build more powerful computers (the first exaFLOPS computer is expected by about 2018, which would have the processing power of 50 humans according to your estimate) so there's no real upper limit to intelligence in that regard.
The problem is that it's still just a very fast calculator.
If we ever do manage to crack that nut — and this is still an open question — then it wouldn't be suprising for this genius-level AI to set about writing its own AI software that was better than what we could conceive, and lead to the rapid escalation in artificial intelligence known as the technological singularity, at which point all bets are off.
In the meantime, we have a gradual and hard-fought increase in "intelligence" that really does improve productivity (or else I'd be out of a job), but it's been going on for a long time now and it hasn't seen the magical boost in GDP that your link suggested, as demonstrated by Tom Curtis. Moreover, as we are less and less constrained by the computational abilities of the machines we are using, the more and more obvious it becomes that the constraints are us, and so the less impact each successive improvement in hardware has. (Some examples to ponder: how much better are word processors today than they were five years ago? Ten years ago? 15 years ago? 20 years ago? During the 80s and 90s improvements were obvious; now the only way you can tell which version you're using is the arbitrary cosmetic changes introduced to differentiate the products. What about games, or film CGI? In the beginning there were massive improvements in hardware and software every few years that allowed more and more realism to be introduced; now each generation is much like the last. This tailing off in advancement is normal as technology matures, and completely the opposite of what your forecast assumes.)
The bottom line is that there's no evidence that AI will be the magic bullet that makes out-of-this-world growth rates of GDP possible, and if AI really did make such a massive breakthrough, there's a good chance it would be the end of us anyway so it's perhaps not something to hope for.
The value of this information is a simple matter of science. Science consists of one person predicting “a”, and another person predicting “b” (each with explanations for why they are making their predictions) and then observing to see which predictions are correct (or it could be “c” and neither is correct). Or both persons could agree on “a” or “b” in which case there’s not a point in further debate.
The problem is that (a) the predictions are utterly worthless and (b) the timeframes are so long that we wouldn't even know who turned out to be correct.
The fact that you are willing to give people $20 to just Make Stuff Up is consistent with the value you place on other worthless projections, I suppose.
I think it's also worth pointing out that the difference between these "predictions" and the IPCC's scenario-based projections is that the latter allow us to evaluate the likely effects of decisions that we make today to aid our decision making. The equivalent in your case would be a scenario where the AI Silver Bullet hits, malaria is cured, etc., etc. — in other words, those are your inputs, your assumptions for your scenario, not a prediction of the future.
Additionally, in the case of my asking for your predictions for all those parameters (not just GDP) is to see whether or not we agree regarding some parameters that I think reflect "quality of life" (e.g. life expectancy at birth, number of malaria deaths, people with access to adequate sanitation, etc.).
Suppose, for the sake of argument, that the number of malaria deaths reaches zero because e.g. a cure has been found by then. How does that justify pushing the CO2 drawdown problem onto them? It's as if you are saying "Hey, they will be better off than us because they won't have to deal with problem X, therefore we can burden them with problem Y".
You also seem to be forgetting that there are plenty of countries in the world today that don't have malaria. Doesn't that mean that those countries should start reducing CO2 on that basis?
-
nuclear_is_good at 18:18 PM on 8 May 2013The anthropogenic global warming rate: Is it steady for the last 100 years? Part 2.
While it is great to have scientists explaining their published work to the public, I find a little surprising that people still try to do various forms of regression based on surface temperatures and completly neglect the amount of energy going in and out of the ocean - that amount is easily dwarfing the amount of "AMO corrections" and there is a passing mention on how that could be part of the explanation but as far as I can see there is no attempt at including that data into the model and calculations!
-
K.a.r.S.t.e.N at 11:05 AM on 8 May 2013The anthropogenic global warming rate: Is it steady for the last 100 years? Part 2.
Thank you very much for the posting! I appreciate your effort to elaborate on the AMO issue in such detail. Many points to discuss in much more depth, which I'll do at a later stage (as soon as time allows). For the time being, I would like to clarify and stress that Fig.5 was taken from Tamino! Some may misread that part. It is not mine! While the fluctuations are the true AMO signal (amplifying the external sulfate aerosol forcing), the negative trend is most likely due to the delayed response to the very strong warming once the effect of the Clean Air Act was detectable in the sulfate aerosol loading. It merely reflects the thermal inertia. It's not the aerosols as far as the trend is concerned. The ups and downs are an amplified aerosol response (+ other forcings of course).
As a teaser: I strongly disagree that debate is about whether the observed AMO is anthropogenically forced or not. The debate is about how strong the Atlantic ocean (namely the AMOC) responds to the external forcing. The external (anthropogenic) sulfate forcing is there. We know it! We measured it! It's therefore a well established fact which I won't further discuss. I pointed to the respective literature already. Your reference to the CET time series is therefore rather pointless in my point of view. It just shows how sensitive European climate (and the North Atlantic at that matter) is to external forcing, i.e. volcanic eruptions before the 20th century.
More to come later ...
-
Daniel Bailey at 10:30 AM on 8 May 2013Leave It in the Ground, Climate Activists Demand
@ Mark Bahner:
You have posted 2 comments thus far on this thread that, rather than adding to the signal of participation and dialogue on this thread that the other contributors work hard to maintain, do nothing more than detract from that discussion. As such, they serve no useful purpose, being noise among the signal. To that end, if you do not wish to have your noise filtered out, please attenuate said noise in favor of greater signal.
Capiche?
-
Rob Honeycutt at 07:59 AM on 8 May 2013Global Warming: Not Reversible, But Stoppable
And Mark... I just don't think you get the point to economic predictions. Everyone understands they're wrong. I'll say it again, you can't predict the future.
You can explore potential outcomes. You can discuss market influence that might or might not come about. You can discuss trends, opportunities, etc.
They way people use this information is so they can mitigate risk.
The problem with what you're doing is, you're taking your assumptions as fact. I'm sorry but you just don't have any more insight than the next person on future facts.
-
Rob Honeycutt at 07:49 AM on 8 May 2013Global Warming: Not Reversible, But Stoppable
Mark... You have not "predicted the future" for the coming century. You have put forth predictions about the future. Not only that, you've made predictions about things that you will never know.
I can make a prediction that pigs will develop the capacity to vocalize their thoughts in 2150, and I can make grand bets on the accuracy of the prediction, but none of us will be there to see it.
Making bets you can never collect on borders on delusional.
You say, " Based on that calculation, I think only the 2020 prediction is potentially too high. I think the others will be way too low." And then you add, "(Barring takeover by Terminators or global thermonuclear war, of course.)"
So, even you are already saying that you are likely going to be wrong.
(Psst. Also, you might take strong notice of the fact that China is ramping down it's red-hot economic growth of the past 30 years.)
-
Mark Bahner at 07:34 AM on 8 May 2013Global Warming: Not Reversible, But Stoppable
Rob Honeycutt makes this remarkable comment:
Mark seems to not be aware of the purpose of economic forecasting. You, literally, can not predict the future.
Rob, I have predicted the future:
“The world per-capita GDP in the year 2000 was approximately $7,200. The world per-capita GDP (in year 2000 dollars) will exceed $13,000 in the year 2020, $31,000 in 2040, $130,000 in 2060, $1,000,000 in 2080, and $10,000,000 in 2100.”
And Nobel Laureate Robert Lucas Jr. predicted the future in his Journal of Economic Perspectives article. The difference between our two predictions is that I think that the development of artificial intelligence will greatly increase economic growth, whereas Robert Lucas Jr. either did not consider the development of artificial intelligence and its effects on economic growth (most likely) or considered the development of artificial intelligence, but thought it would not affect economic growth (possible--I've never had any contact with him--but I think highly unlikely).
Further, the Long Bets site alone has many other economic predictions, such as #626: "The United States will not experience hyperinflation (defined by 3 consecutive months of 6% Month over Month inflation according to the Billion Prices Project measurement of MoM inflation) from April 17th 2012 to April 17th 2017. ”
The thing about forecasting is, no matter what, you will be wrong.
No, I will be right if the world per-capita GDP (in year 2000 dollars) exceeds $13,000 in the year 2020, $31,000 in 2040, $130,000 in 2060, $1,000,000 in 2080, and $10,000,000 in 2100.
"...you can't build a rosy scenario..."
Those predictions are not a "rosy scenario." At the time I made the Long Bets #194 I hadn't done my calculation of the number of human brain equivalents added every year. Based on that calculation, I think only the 2020 prediction is potentially too high. I think the others will be way too low. So if I make it past the 2020 prediction of $13,000 (in year 2000 dollars), I think there's smooth sailing to the end of the century. (Barring takeover by Terminators or global thermonuclear war, of course.)
-
Kevin C at 06:32 AM on 8 May 2013The anthropogenic global warming rate: Is it steady for the last 100 years? Part 2.
Dr Tung:
The spatial temperature patterns you've shown here are very interesting, but I am concerned that you have attributed a significant amount of temperature variation to the AMO which is already well explained by other causes. In particular I draw your attention to the volcanic record, e.g. here for the recent data, and here for a longer record. The short record is shown below, and shows two clusters of volcanoes with the intervening quiet spells.

The volcanic record explains the apparent oscillation in the temperature record (your figure 4) rather well, with the dips in temperature corresponding to eruptions as follows:
1809-1835: Tambora, Consiguina and two unknown erruptions
1883-1912: Krakatau, Novarupta, Santa Maria
1960-1990: Agung, El Chicon, Pinatubo
This is illustrated by the fit to the data obtained by the Berkeley team using just volcanoes and CO2.
-
John Chapman at 06:20 AM on 8 May 2013Distinguishing Between Short-Term Variability and Long-Term Trends
Dana, now that I hunt it down I see the year is more like 2015 rather than 2013, though there would have to be a transition towards 2015. The source is www.skepticalscience.com/david-archibald-exaggerates-solar-influence-on-future-climate-c see figure 3.
-
IanC at 04:38 AM on 8 May 2013The anthropogenic global warming rate: Is it steady for the last 100 years? Part 2.
Dr. Tung,
Thank you for taking the time to write this series of posts.
I'm wondering, how sensitive are the results of Zhou and Tung 2013 to the choice of AMO index? i.e. what will the results look like if the index as defined by van Oldenborgh et al. 2009 or Trenberth and Shea 2006 were used instead?
-
Bob Tisdale at 03:19 AM on 8 May 2013The anthropogenic global warming rate: Is it steady for the last 100 years? Part 2.
KK Tung: Thanks. The post was easy to read and understand.
Regards
-
Dikran Marsupial at 02:54 AM on 8 May 2013Global Warming: Not Reversible, But Stoppable
Mark Bahner, I think you have missed the point, regardless of the PFLOPS available, we don't know how to write the software, so the point is moot.
Secondly, making projections based on speculation is not science, it is futurology. In science whether a projection is worth paying attention to (or for that matter making) rather depends on the strength of the supporting argument/evidence. Merely challenging someone to make a prediction so we can wait and see who is right is not science, and comes across as a rhetorical device to avoid addressing the factual basis for your position.
At the end of the day, physics is a lot more predictable than economics, which suggests physics is a more reliable solution to the problem than deligating the problem to others in the hopes that they can fix it more cheaply.
-
Mark Bahner at 02:50 AM on 8 May 2013Global Warming: Not Reversible, But Stoppable
One final thing about the predictions I requested JasonB to make. (Offered him $20 to make! I challenge anyone to make me similar offers!)
The table with the various parameters is located here. That table has the parameter values circa 2012 (and the units, such as for PM10 concentration), for greater ease in making predictions. For example, malaria deaths are estimated at 770,000 in the table. But I've seen a Lancet article up to 1.2 million. Similarly, the estimate of 37% of the world without proper sanitation circa 2012 is just one estimate. So the idea would be to assume that the number I gave in the table was correct, and go off of that.
-
Mark Bahner at 02:40 AM on 8 May 2013Global Warming: Not Reversible, But Stoppable
Oops. Here is a repeat of that post, with JasonB's words as quotations (it may be confusing the way I first did it):
JasonB writes: "I can't speak for Tom but I have published (a long time ago) in the field of AI and I make a living today creating technology that greatly enhances productivity so I guess I'm one of the "doers" (as opposed to "thinkers") in that area."
You're a "doer" in the field of how AI affects macroeconomic growth? So...you've had some courses in macroeconomics? Or even an advanced degree, perhaps? You know your way around basic economic models like the Solow-Swan model?
Estimates vary on the processing power of the human brain, from about 10 petaFLOPS up to about 100 petaFLOPS, but somewhere in the middle seems reasonable.
The estimates I've see run from 0.5 petaFLOPs (Moravec) to 20 petaFLOPs (Kurzweil). So yes, "somewhere in the middle...towards the lower end" seems reasonable.
The computing power is there.
No, the computing power is not there. Using an estimate of say, 20 petaFLOPS for a human brain, and the human population is approximately 7 billion. So that’s 140 billion petaFLOPs. What was the total number of petaFLOPS added by all computers in the world in 2012? How many will be added by computers in 2022? 2032? 2042?
"Why? You've made that offer a couple of times now and I can't see what possible value there would be in any of our predictions of future GDP growth,..."
I offered $20 to Tom Curtis to predict world per-capita economic growth in each decade of the 21st century. I offered you $20 to predict world per-capita GDP in 2050 and 2100, but also many other parameters for 2050 and 2100: 1) world life expectancy at birth, 2) global CO2 emissions, 3) atmospheric CO2 concentration, 4) global surface temperature anomaly (NASA GISTEMP), 5) global malaria deaths, 6) Beijing annual average PM10 concentration (that’s particulate matter less than 10 microns), 7) percent of world population without access to proper sanitation, 8) global sea level rise (relative to 2013), 9) percentage of species in the 2010 IUCN “Red List” listed as “vulnerable,” “endangered,” “critically endangered,” and “extinct in the wild” that will be declared extinct, and 10) the cost to desalinate 1000 gallons of seawater.
The value of this information is a simple matter of science. Science consists of one person predicting “a”, and another person predicting “b” (each with explanations for why they are making their predictions) and then observing to see which predictions are correct (or it could be “c” and neither is correct). Or both persons could agree on “a” or “b” in which case there’s not a point in further debate.
Additionally, in the case of my asking for your predictions for all those parameters (not just GDP) is to see whether or not we agree regarding some parameters that I think reflect "quality of life" (e.g. life expectancy at birth, number of malaria deaths, people with access to adequate sanitation, etc.).
-
Mark Bahner at 02:36 AM on 8 May 2013Global Warming: Not Reversible, But Stoppable
JasonB writes: "I can't speak for Tom but I have published (a long time ago) in the field of AI and I make a living today creating technology that greatly enhances productivity so I guess I'm one of the "doers" (as opposed to "thinkers") in that area."
You're a "doer" in the field of how AI affects macroeconomic growth? So...you've had some courses in macroeconomics? Or even an advanced degree, perhaps? You know your way around basic economic models like the Solow-Swan model?
Estimates vary on the processing power of the human brain, from about 10 petaFLOPS up to about 100 petaFLOPS, but somewhere in the middle seems reasonable.
The estimates I've see run from 0.5 petaFLOPs (Moravec) to 20 petaFLOPs (Kurzweil). So yes, "somewhere in the middle...towards the lower end" seems reasonable.
The computing power is there.
No, the computing power is not there. Using an estimate of say, 20 petaFLOPS for a human brain, and the human population is approximately 7 billion. So that’s 140 billion petaFLOPs. What was the total number of petaFLOPS added by all computers in the world in 2012? How many will be added by computers in 2022? 2032? 2042?
"Why? You've made that offer a couple of times now and I can't see what possible value there would be in any of our predictions of future GDP growth,..."
I offered $20 to Tom Curtis to predict world per-capita economic growth in each decade of the 21st century. I offered you $20 to predict world per-capita GDP in 2050 and 2100, but also many other parameters for 2050 and 2100: 1) world life expectancy at birth, 2) global CO2 emissions, 3) atmospheric CO2 concentration, 4) global surface temperature anomaly (NASA GISTEMP), 5) global malaria deaths, 6) Beijing annual average PM10 concentration (that’s particulate matter less than 10 microns), 7) percent of world population without access to proper sanitation, 8) global sea level rise (relative to 2013), 9) percentage of species in the 2010 IUCN “Red List” listed as “vulnerable,” “endangered,” “critically endangered,” and “extinct in the wild” that will be declared extinct, and 10) the cost to desalinate 1000 gallons of seawater.
The value of this information is a simple matter of science. Science consists of one person predicting “a”, and another person predicting “b” (each with explanations for why they are making their predictions) and then observing to see which predictions are correct (or it could be “c” and neither is correct). Or both persons could agree on “a” or “b” in which case there’s not a point in further debate.
Additionally, in the case of my asking for your predictions for all those parameters (not just GDP) is to see whether or not we agree regarding some parameters that I think reflect "quality of life" (e.g. life expectancy at birth, number of malaria deaths, people with access to adequate sanitation, etc.).
-
Djon at 02:32 AM on 8 May 2013Distinguishing Between Short-Term Variability and Long-Term Trends
Dana - I suspect John had http://wattsupwiththat.com/2012/08/13/when-will-it-start-cooling/ in mind, though it's nowhere near as dramatic a drop as McLean was foolish enough to predict and it looks to me as though Archibald left himself a fair bit of wiggle room to claim, at least for a few more years, that the failure of cooling to start when he said it was likely to doesn't invalidate his longer term prediction of major cooling over the course of the next few solar cycles.
-
Rob Honeycutt at 00:54 AM on 8 May 2013Global Warming: Not Reversible, But Stoppable
Mark seems to not be aware of the purpose of economic forecasting. You, literally, can not predict the future. The point of forecasting is to establish potential outcomes in order to mitigate risk. No one is going to take the best case scenario and base their plans on that.
The thing about forecasting is, no matter what, you will be wrong. You can create boundary conditions and base plans on that, but you can't build a rosy scenario where all problems are magically solved and expect anything like that is going to happen.
-
John Hartz at 23:52 PM on 7 May 2013Global Warming: Not Reversible, But Stoppable
@Mark Bahner #96:
In response to Tom Curtis, you state, When we get your predictions, we can figure out whether Robin Hanson, I, or you are right about world GDP growth in the 21st century.
Exactly who is the "we"?
Exactly how are "we" going to figure out who is right?
-
cRR Kampen at 23:11 PM on 7 May 2013Participate in a survey measuring consensus in climate research
#36 SirCharles, you're right. That measure is inappropriate.
Great conspiracy theorizing at WUWT. They should develop that, then tomorrow they can go into the trash cans of hollow earthists, chemtrail believers, UFO nutcases and creationists - or have they already arrived there? -
cRR Kampen at 19:09 PM on 7 May 2013WMO Annual Climate Statement Confirms 2012 as Among Top Ten Warmest Years
LarryM #2, perfect :)
Of course WMO's graph depicts the same thing and it is only its 2012 bar I'm fussing about.
The picture you provided suggests, by the way, a slight divergence in trend between La Niña- and El Niño years. Not at all statistically significant I guess, but La Niña seems to inhibit atmospheric(!) AGW some more than other EN/SO phases.
-
JasonB at 14:11 PM on 7 May 2013Global Warming: Not Reversible, But Stoppable
KR:
I find this approach delightfully optimistic in its child-like charm, yet completely unrealistic.
Reminds me of Star Trek, where apparently GDP has grown so much that nobody actually needs to work nor earn money any more, they just do whatever takes their fancy and everything is free.
Still can't figure out why some fancy being starship captains and others "fancy" being bossed around rather than sitting at home all day watching TV and playing computer games...
-
JasonB at 14:05 PM on 7 May 2013Global Warming: Not Reversible, But Stoppable
Mark Bahner @ 96:
And though the analysis of the economic aspects of artificial intelligence is a small field, I’d say he’s one of the leading thinkers in that area. So I’m curious what your credentials are? Have you ever published any papers on either economics or artificial intelligence?
I can't speak for Tom but I have published (a long time ago) in the field of AI and I make a living today creating technology that greatly enhances productivity so I guess I'm one of the "doers" (as opposed to "thinkers") in that area. In fact, a couple of months ago a free trial I offered was turned down out of concern that the "amazing efficiency" gained would result in management taking the opportunity to downsize the department in question, which highlights the flip side (also mentioned in the paper you linked to): productivity gains often result in job losses and the need for humans to find another niche to fill that the machines aren't yet capable of performing. GDP could well rise while a few get incredibly rich and the rest struggle to find work and survive.
But back to an earlier point I made: I get annoyed by so-called "futurists" predicting wonderful advances in the technology, usually based on the ever-diminishing cost of computing power, who appear to have no idea that the thing that makes that computer power actually useful is a much harder nut to crack. As someone who has spent a long time and lots of money developing "intelligent" software — although I wouldn't classify it as "artificial intelligence", and I would regard as clueless anybody who tried to — I can tell you that that's where the real challenge lies.
Allow me to explain:
Estimates vary on the processing power of the human brain, from about 10 petaFLOPS up to about 100 petaFLOPS, but somewhere in the middle seems reasonable. Titan, the current fastest computer in the world, is about half that. In theory, then, Titan could run a human-equivalent AI at about half real-time. Except it can't, because we don't know how to write such a program.
Put the top two supercomputers together and they actually have enough power to run a human-equivalent AI in real time. The top five, combined, have enough power for two human brains or, presumably, one really smart one. Even Folding@home has approximately 12 petaFLOPS at its disposal, which would put it at #3 in the world.
The computing power is there. It already exists. In the future it will just get cheaper. (It's still hard to compete with ~50 petaFLOPS that can be mass produced by unskilled labour, of course.)
But we don't know how to harness it to create an artificial intelligence; we use it for simple number crunching. I don't think any of these supercomputers has ever deduced the existence of rice pudding nor income tax on their own.
I’m so interested to get your expert opinion on what economic growth will be like in the 21st century, that I’ll send you $20 if you’ll provide your predictions in a similar manner to mine.
Why? You've made that offer a couple of times now and I can't see what possible value there would be in any of our predictions of future GDP growth, just as I see very little value in any of the economists' predictions of future GDP growth. You seem to place a lot of value in something that is utterly worthless. At least with the IPCC's temperature projections there's some physical models underlying them; I tend to view economic forecasts as coming under the heading "Just Making Stuff Up". They have a hard enough time predicting the present, let alone the future.
-
SirCharles at 12:49 PM on 7 May 2013Participate in a survey measuring consensus in climate research
@cRR Kampen at 00:48 AM on 3 May, 2013
I believe it's anything but about the 97%. I suppose it's all about how ordinary people are evaluating the findings of scientific studies. -
KR at 12:41 PM on 7 May 2013Global Warming: Not Reversible, But Stoppable
See the Climate Troll Illustrated Bestiary, Breakthrough Boys. Mark Bahner seems to assume that we will economically rocket out of our own problems with no other effort.
I find this approach delightfully optimistic in its child-like charm, yet completely unrealistic. Real economics, looking at the potentials for growth in the developing world and with a more grounded evaluation of technical change, are less likely to predict magic growth that will wipe away all issues due to excess capacity - rocket cars in every garage, AI's that do the hard work for us, etc, would be great, but experience doesn't support such a cornucopian view.
-
Mark Bahner at 12:41 PM on 7 May 2013Global Warming: Not Reversible, But Stoppable
I appear to have hit a nerve (Mark Bahner @96).So much so that Bahner is resorting to the implicit argument that Hanson must be right because he has good credentials.
No, I'm asking who you are, that you can write things like:
“…an article which overstates recent real growth rate, and assumes that the introduciton of AI is the golden goose of economics without actually plotting the course of economic growth durring the information revolution. That is, it has no more intellectual credibility than Bahner's attempt, for all that the author is seeking to have it published."
“Of course, this merely reminds me of what they say about stopped clocks, or, perhaps more aptly in Hanson's case, a clock I once saw whose hour and minute hands tracked the second hand, and hence was also right twice a day (and accurate never).”
[-snip-]
The interesting feature is the prediction of a 4.3% growth rate per annum, doubling every 16 years...
That's not a prediction. It's an observation of the recent growth rate (up to the time of the paper, of course...which I think was 2001).
However, given that Bahner likes credentials, perhaps he will like the predictions of the Noble Prize winning economist, Rober Lucas Jr:
Yes, Robert Lucas Jr. has a Nobel Prize in Economics. And who wouldn't respect that (except you, perhaps)? But I bet he's wrong:
Long Bets Prediction #194 (Circa 2004)
That prediction is:
“The world per-capita GDP in the year 2000 was approximately $7,200. The world per-capita GDP (in year 2000 dollars) will exceed $13,000 in the year 2020, $31,000 in 2040, $130,000 in 2060, $1,000,000 in 2080, and $10,000,000 in 2100.”
Again, what are your predictions?
P.S. I don't have the Journal of Economic Perspectives paper in front of me, but I'm pretty sure the figure you cite is of per-capita income growth (so population growth would need to be included to get the total world GDP growth rate).
Moderator Response:[RH] Definitely no cyberber stalking allowed at SkS.
[DB] Please note that posting comments here at SkS is a privilege, not a right. This privilege can and will be rescinded if the posting individual continues to treat adherence to the Comments Policy as optional, rather than the mandatory condition of participating in this online forum.
Moderating this site is a tiresome chore, particularly when commentators repeatedly submit offensive or off-topic posts. We really appreciate people's cooperation in abiding by the Comments Policy, which is largely responsible for the quality of this site.
Finally, please understand that moderation policies are not open for discussion. If you find yourself incapable of abiding by these common set of rules that everyone else observes, then a change of venues is in the offing.Please take the time to review the policy and ensure future comments are in full compliance with it. Thanks for your understanding and compliance in this matter.
-
Tom Curtis at 11:32 AM on 7 May 2013Global Warming: Not Reversible, But Stoppable
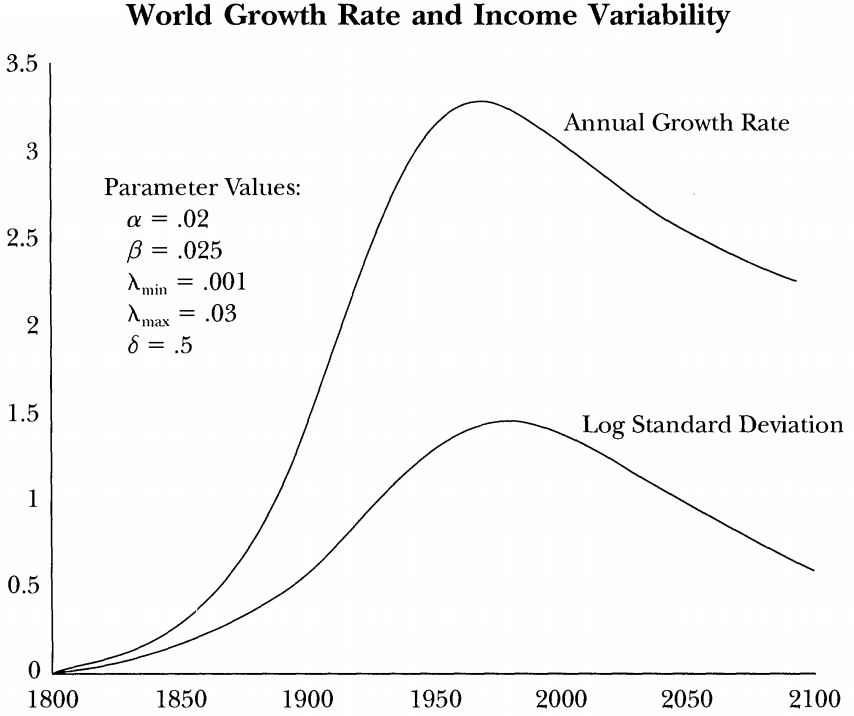
I appear to have hit a nerve (Mark Bahner @96). So much so that Bahner is resorting to the implicit argument that Hanson must be right because he has good credentials. I am more (un)impressed by Hanson's claim that:
"Without machine intelligence, world product grows at a familiar rate of 4.3% per year, doubling every 16 years, with about 40% of technological progress coming from ordinary computers. With machine intelligence, the (instantaneous) annual growth rate would be 45%, ten times higher, making world product double every 18 months! If the product shares are raised by 20%, and general technology growth is lowered to preserve the 4.4% figure, the new doubling time falls to less than 6 months."
The interesting feature is the prediction of a 4.3% growth rate per annum, doubling every 16 years with technological advancement in computers, but no AI. That is an emperical prediction that can be compared to the economic record since the advent of commerical computers in the 1960s:


or the penetration of computers (or at least computer chips) into all aspects of the market in the 2000s:

The simple fact is that the world has seen declining, or at best steady economic growth over a period in which Hanson's theory predicts a doubling of economic growth every 16 years. Therefore his theory is falsified empirically, and was falsified when he published it as he would have known had he done any retrodiction with the theory to compare with empirical data. Given that it does not matter what his credentials are; we have no empirical basis to accept his theoretical projections.
However, given that Bahner likes credentials, perhaps he will like the predictions of the Noble Prize winning economist, Rober Lucas Jr:
-
Mark Bahner at 10:03 AM on 7 May 2013Global Warming: Not Reversible, But Stoppable
Tom Curtis (#94) writes:
"I would not assume that Bahner is an economist,..." -->That's right, I'm an engineer.
"...or indeed, that he has any university level economics training."-->Four or five courses. (I generally sought out the least "human" of the Humanities courses that were a required part of my engineering degree. ;-) Other courses included the History of Science (excellent); History of the U.S. from 1929-1941; Astrophysics; and others (a fairly eclectic mix).
"The only thing it really shows is that he likes reading cornucopian futurists, and that he is almost completely ignorant of physics..."-->That makes me curious about your background. What did you study and what is your career?
I ask this because of your opinion that I am “almost completely ignorant of physics” and because you have said things like this about Robin Hanson, and his paper on "Economic Growth Given Machine Intelligence":
“…an article which overstates recent real growth rate, and assumes that the introduciton of AI is the golden goose of economics without actually plotting the course of economic growth durring the information revolution. That is, it has no more intellectual credibility than Bahner's attempt, for all that the author is seeking to have it published."
“Of course, this merely reminds me of what they say about stopped clocks, or, perhaps more aptly in Hanson's case, a clock I once saw whose hour and minute hands tracked the second hand, and hence was also right twice a day (and accurate never).”
Just for folks who don’t know: Robin Hanson has a PhD from the California Institute of Technology (aka, Caltech). He’s an associate professor of economics at George Mason University and a research fellow at the Future of Humanity Institute at Oxford University. He’s an expert on idea futures and was involved in the creation of the Foresight Exchange and DARPA’s FutureMAP project. And though the analysis of the economic aspects of artificial intelligence is a small field, I’d say he’s one of the leading thinkers in that area. So I’m curious what your credentials are? Have you ever published any papers on either economics or artificial intelligence?
And I’m also curious to get your expert opinion on what economic growth will be like in the 21st century. (You're obviously an expert, given your easy dismissal of Robin Hanson's and my analyses.) In October 2004 I made the following predictions for inflation=-adjusted world-wide per-capita GDP growth rates in the 21st century::
2010-2020 = 3.5 %/yr
2020-2030 = 4.5 %/yr
2030-2040 = 6.0 %/yr
2040-2050 = 8.0 %/yr
2050-2060 = 11.0 %/yr…2060-2100 > 11.0 %/yr
In November 2005, after I made those predictions in October 2004, I did calculations of the number of human brain equivalents (HBEs) added each year by computers
Nov. 2005: Why 21st century economic growth will be spectacular
After doing those calculations, I think the economic growth is likely to be much higher from 2030 onward than I even predicted in 2004. (Barring takeover by Terminators or global thermonuclear war.)
I’m so interested to get your expert opinion on what economic growth will be like in the 21st century, that I’ll send you $20 if you’ll provide your predictions in a similar manner to mine. That is, if you provide your predictions for inflation-adjusted world per-capita GDP growth for every decade in the 21st century, I’ll send you $20. When we get your predictions, we can figure out whether Robin Hanson, I, or you are right about world GDP growth in the 21st century. It makes a big difference regarding whether removing CO2 from the atmosphere will be viable in the 22nd century.
P.S. Though I should again note that even if the IPCC economic growth rate and CO2 projections are correct, it’s pretty clear that removing CO2 from the atmosphere will be viable in the 22nd century.
-
Steve Metzler at 09:32 AM on 7 May 2013Roy Spencer's Catholic Online Climate Myths
I'm with composer99 and others on this. Whenever Spencer's name comes up in a positive light in a climate science related thread, inevitably flung out there by a contrarian, I now throw the Cornwall Alliance book right back at them. It's nearly always *crickets* after that.
The poor man must carry a boatload of cognitive dissonance around with him. -
dana1981 at 09:21 AM on 7 May 2013Distinguishing Between Short-Term Variability and Long-Term Trends
John Chapman @5 - do you have a link to that Archibald prediction?
-
barry1487 at 09:01 AM on 7 May 2013Participate in a survey measuring consensus in climate research
From the article that dealt with crowd funding of this project;
Over the past year volunteers here at Skeptical Science have been quietly engaged in a landmark citizen science project. We have completed the most comprehensive analysis of peer-reviewed climate science papers ever done. Some 21 years worth of climate papers – more than 12,000 in all – have been carefully ranked by their level of endorsement of human-caused global warming. We also invited thousands of the authors of these papers to rate their own papers.
https://skepticalscience.com/Be-part-of-landmark-citizen-science-paper-on-consensus.html
Seemed pretty clear to me that many papers had been rated by the authors of those papers.
Prev 930 931 932 933 934 935 936 937 938 939 940 941 942 943 944 945 Next


