


 Arguments


Recent Comments
Prev 940 941 942 943 944 945 946 947 948 949 950 951 952 953 954 955 Next
Comments 47351 to 47400:
-
Glenn Tamblyn at 17:44 PM on 19 March 2013February 2013 Arctic Sea Ice Death Spiral Update
Then there is the huge arc of ice fractures building up acros the Canadian arctic as we speak. This has been developing for several weeks, starting in the Chukchi and then Beaufort seas. It has now spread across the top of the Canadian Arctic islands and is now fracturing above Greenland, starting to merge with the existing fracturing around the Fram strait. And some of those fractures are within kilometers of the pole.
Some fracturing always occurs but this is extensive and perhaps unprecedented. And importantly, it is virtually all of the remaining Multi-Year Ice that is now fractured. With the right weather conditions over the next 6 months a lot of the remaining MYI could get moved to warmer waters.
Neven is covering this in more detail on his Arctic Sea blog crack-is-bad-for-you-and-sea-iceHere are some images:
This is above Greenland(right) and Ellesmere Island (left)
-
scaddenp at 17:21 PM on 19 March 2013Lessons from Past Climate Predictions: Syun-Ichi Akasofu
Labelling is always something of a problem, but calling someone a denialist seems accurately descriptive. Its a term for someone who denies the scientific evidence. Tree hugger is an epithet for an environmentalist. Its a bad error to confuse concern about the changing climate for environmentalism, especially when you mean environmentalism as a value system. Furthermore claiming use of WfT index as tree-hugger or cherry-picking is plain bizarre. On the other hand, "eric the red" and his other sock-puppets havent exactly been beacons of clear thinking here.
Climatastrology is a term for predicting future climate without a physical basis. Yes, its an another insulting epithet, but are you really supposed to take seriously theories that ignore the physical factors affecting past climate in preference for some wishful "natural cycle". Its bad maths, bad science and needs to be labelled as such.
On the hand I agree that I am quite sure akosofu put a lot more thought into his original article than the commentator or me into the comments, but its shame his talents were not more usefully employed.
-
Auslin at 16:52 PM on 19 March 2013Lessons from Past Climate Predictions: Syun-Ichi Akasofu
I agree that climate change is real, but the comments on this article show even less thought than akosofu's original article.
I find it hysterically ironic that the person who finds it patently offensive to use the term tree hugger, even saying it is elitest, then uses the term climastrology, and gets high fives from Dana for using it. Also interesting that the terms denialist and denier were used, but does not seem to offend Dana the way tree hugger did. Pot, meet kettle.
-
Glenn Tamblyn at 16:43 PM on 19 March 2013February 2013 Arctic Sea Ice Death Spiral Update
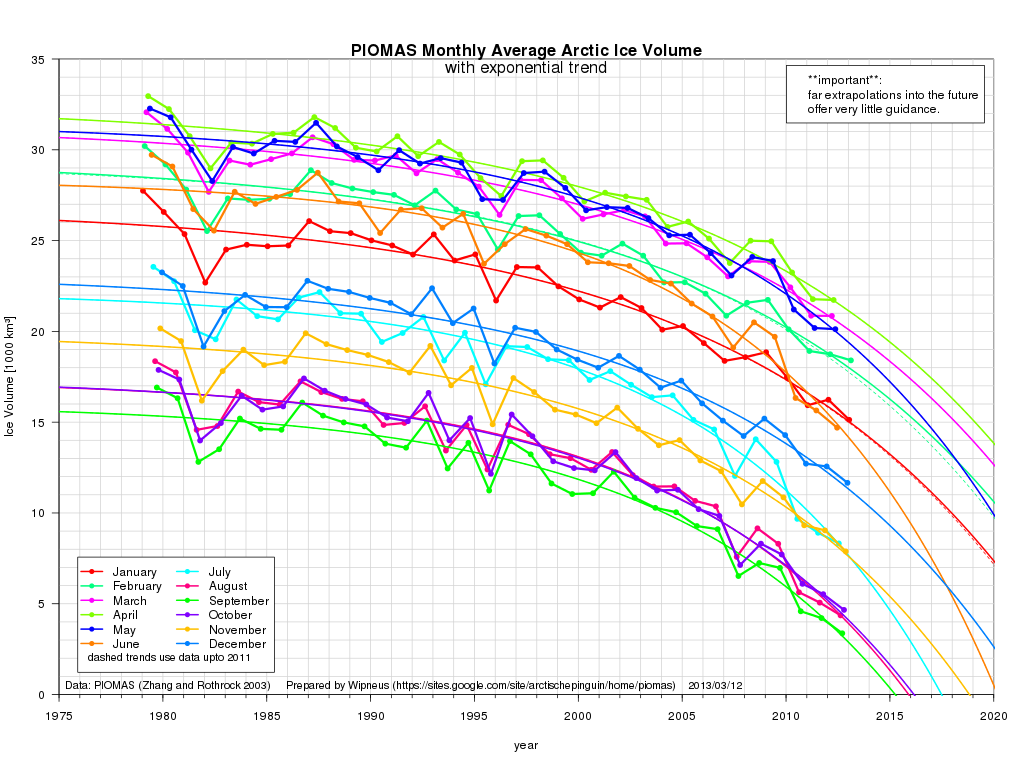
Then there is this graph from Wipneus at Arctic Penguins. He has looked at a number of regression curve fits to the data on ice volume and found exponential fits are the closest. Here is the data for each month and overlayed on top, the exponential curve fits. If things continue on their current trend, Santa drowns in 2015. And by 2016 the Arctic is ice free for 3 months of the year.
It doesn't matter which variation of a graphic you use, they all show the same thing. The Arctic sea ice is exiting stage left...
-
Bob Lacatena at 13:56 PM on 19 March 2013Watts Interview – Denial and Reality Mix like Oil and Water
Ray, to restate what I think DSL's main point was, your mistake is that you think there are two types of people, those who trust Watts and those who don't. But those two groups make up a very small segment of the population. There is always a much larger segment of the population outside of those groups; people who are unfamiliar with the climate issues, those who are uncertain, those who are uninvested, and more.
SkS is meant to serve exactly those people. SkS provides a source of reliable and consistent information, based on the actual state of the science, rather than poppycock and nonsense fabricated to give an illusion of truthiness.
So what purpose does this post serve? It exposes Watts' hypocrisy and idiocy to people who might otherwise stumble into Watts' site and be led to believe that the guy has a clue about anything, or is to be trusted in any way.
-
DSL at 13:04 PM on 19 March 2013Watts Interview – Denial and Reality Mix like Oil and Water
Ray, you seem to assume that there are two groups of people: those who trust Watts and those who trust SkS. No. WUWT is allegedly a popular blog. It also (somewhat systematically) feeds a number of mainstream news sites. Watts influences public opinion. Not a day goes by that I don't get someone out in the internets trying to feed me a link to WUWT in defense of some bizarre claim (e.g. "16-year trend = no global warming"). Watts even made it onto PBS--not because he's an expert, but because his site is popular. It is a primary source of the faux debate. WUWT misinforms the democracy. Watts could care less about scientific progress. His goal is to smear grease on the glass between science and political will. Note that SkS is a defensive site. Little original science is published from its regulars. Instead, commenters present, defend, and argue about the published science. The linkage to the published science on this site blows away--a massive understatement--that of any other climate site on the net. WUWT publishes a great deal of original "science" that is strictly designed to attack mainstream climate ideas perceived as foundational (e.g. surface temp trend explained not by CO2 but by unknown physical mechanism with 65-year cycle). The weak methodologies of these publications are hidden by biting and inflammatory rhetoric. And it works really, really well. Very little published climate science is linked at WUWT--except when it's the target.
-
Ray at 10:47 AM on 19 March 2013Watts Interview – Denial and Reality Mix like Oil and Water
Thanks for the reply Dana but I still don't get it. (-snip-)
Moderator Response: [DB] You have registered your dissatisfaction. Re-pressing the point crosses the line into ergot repetition and sloganeering. -
Watts Interview – Denial and Reality Mix like Oil and Water
Ray - If you look at the stated purpose of SkS (About Skeptical Science), you will see that correcting the misinformation of climate denial is its core. Watts certainly isn't a climate scientist, his (mis)information is almost invariably incorrect, and even those defending him can't claim good quality - yet he gets air time on Fox, and considerable traffic on his website. He is a serial presenter of denial myths who has an audience.
It's entirely appropriate to point out the contradictions and fallacies when someone like Watts is making public statements.
-
Ray at 10:23 AM on 19 March 2013Watts Interview – Denial and Reality Mix like Oil and Water
Dana@99 Thanks for the reply Dana but what interest is an interview of Anthony Watts to those that read Skeptical Science. I accept yhat your answer could, very reasonably. point to the number of comments generated but these by and large, are merely supporting and confirming one another's opinions so I'm not sure what it was that was hoped to be gained. Personally I didn't read much of it for the little I did read added nothing to my understanding of climate change and as Anthony Watts is hardly a climate scientist, agreed he doesn't claim he is, his views carry little weight in the mainstream community of climate scientists. Sure his shortcomings, at least those perceived to be shortcomings by those that wrote the piece, were well aired but to what avail? Those who believe what Watts says are unlikely to read this post and so will continue on in their ignorance while those who don't believe what Watts says will have their beliefs confirmed. Sorry , still don't get the point of it
-
Tom Curtis at 09:58 AM on 19 March 2013Mars is warming
HK @40, you raise a very good point. It is likely that most of the differences between polar cap size in Mar's observations will be due to seasonal cycles, something Nahle has failed to consider (along with the majority of the evidence on the changes in the size of Mars's icecaps over time.
-
Jonas at 09:55 AM on 19 March 2013February 2013 Arctic Sea Ice Death Spiral Update
There is also an interesting graphics on EPI (Earth Policy Institute, Lester Brown):
http://www.earth-policy.org/data_highlights/2012/highlights31
(can also be found here on sks: http://www.skepticalscience.com/record-arctic-sea-ice-melt-to-levels-unseen-in-millennia.html ):

-
EliRabett at 09:10 AM on 19 March 2013Watts Interview – Denial and Reality Mix like Oil and Water
One would expect that for the same underlying trend the three slopes would be very close to each other if not exactly the same.
-
Doug Hutcheson at 08:38 AM on 19 March 2013Water vapor is the most powerful greenhouse gas
Further to my comment above, Radio National have come back to me. I was wrong to attribute the comment to Pielke Jnr: it was actually Lindzen. From the transcript:
"Richard Lindzen: My own particular research on this topic has dealt with water vapour, for a very simple reason; water vapour itself could account for 98.5% of the present greenhouse effect. It's the giant greenhouse gas, and in fact no model would give more than about 1° warming for a doubling of CO2 unless it had water vapour amplify it. And so we've been looking at how they deal with water vapour.
And they don't have the physics that we know accounts for water vapour, they are having numerical errors all over the place. So here you have the major greenhouse gas, you're worrying about something that's in the 1% region, and you're getting the thing that is 98.5% totally wrong, 100% errors.
We've been doing some studies on it, and I strongly feel that water vapour in fact is acting in the opposite direction from what the models suggest, and according to our calculations it should keep the warming for a doubling of CO2 down to about two-tenths of a degree. You couldn't tell that from natural variability."
So, warming from a doubling of CO2 amounts to two tenths of a degree, if the good Professor does not have his facts bass ackwards. There, don't you feel safer now?
-
Mars is warming
Tom Curtis #29:
If all the photos in your figure 3 were taken close to opposition (when Mars is closest to the Earth), each of them must have been taken about 780 days later than the previous one, or one Martian year plus 93 days. That is like taking photos of the Earth with 415 days intervals or 50 days later every year.
Based on the surface markings it seems to me that the photo from 2001 must have been taken close to northern hemisphere autumn equinox on Mars, corresponding to late September on Earth.
That means that the photos from 1995, 1997 and 1999 roughly corresponds to late April, mid June and early August respectively (spring and summer in NH), while the photos from 2003 and 2005 corresponds to early November and late December (spring and summer in SH).
In other words, the changes in this photo sequence are simply caused by the seasons, and have nothing to do with any climate change on Mars!
I wonder how this guy Nasif Nahle would explain away that?
-
scaddenp at 07:06 AM on 19 March 2013New Study, Same Result - Greenhouse Gases Dominate Global Warming
Come on. Science always investigates what is unknown. The settled bit is that increasing GHG in atmosphere will change climate. Unsettled is things like understanding and predicting short-term variations (eg ENSO); source and relative strength of past forcings; the value for climate sensitivity; etc etc. For gravity - well what is the mechanism? Why the equivalence principle? Do gravity waves exist? (and similar questions around reconcilation of general relativity and quantum mechanics).
-
dana1981 at 06:37 AM on 19 March 2013Watts Interview – Denial and Reality Mix like Oil and Water
Ray @98 - the post is about an interview of Watts in the mainstream media, not about content on WUWT, which I agree is not even worth debunking.
-
dana1981 at 06:28 AM on 19 March 2013New Study, Same Result - Greenhouse Gases Dominate Global Warming
Clyde - not sure why you think a correction is needed. Aerosols are the main negative anthropogenic forcing.
-
Klapper at 06:27 AM on 19 March 2013New Study, Same Result - Greenhouse Gases Dominate Global Warming
@dana1981 #4:
Natural variability should be smoothed out over the period I'm discussing (1910 to 1945 or 36 years inclusive). I checked the trend 1910 to 1945 inclusive on your trend calculator for all 3 SAT datasets: answer is 0.15 to 0.14C/decade +/- .04, meaning the minimum temperature trend in that period is about 0.01C/decade.
Using data from the KNMI data explorer website the model ensemble mean of the CMIP3+ runs for the 20th century, the trend is 0.05C/decade. What do you think 2sigma is on that trend? We use the term "within the model envelope". Are you saying that the model envelope is equivalent to 2 sigma on our best guess at the model generated warming rate for this time period?
This is a tricky question but I think the answer to my last question is no.
-
Ray at 06:22 AM on 19 March 2013Watts Interview – Denial and Reality Mix like Oil and Water
Thinking about this particular topic, what on earth was the point of discussing WUWT on this blog? Everyone, well nearly everyone, here dismisses WUWT as risible rubbish and regards Anthony Watts as a complete charlatan. Conversely, most of those that don't are highly unlikley to consider accessing Skeptical Science and should they do so are likely to get short shrift Why then give him traction?
-
Jan Sæther at 05:34 AM on 19 March 2013Science vs. the Feelies
The Runaway Greenhouse Effect - James HansenModerator Response: [DB] Note that it is customary on this website to include explanatory text when posting links; in this case, at least have shown that you were replying to Jake above. -
DSL at 05:19 AM on 19 March 2013New Study, Same Result - Greenhouse Gases Dominate Global Warming
Clyde, it would be fascinating to study the amount of research that has been performed solely in response to the denial industry's proven ability to misinform. Note how many investigations were performed based on the never-formalized "climategate" allegations. No other area of science is twisted so systematically by opinion-making organizations. It matters, even if scientists say they try to stay out of politics. If the denial industry is successful, climate science will simply go away, because it will be deemed by the misinformed public to be a fraudulent use of taxpayer money. The denial industry, of course, will move on to another target, just as it moved from tobacco-cancer to climate science.
As for gravity, yes, people are still studying it. (note the time limit on the search)
-
michael sweet at 05:08 AM on 19 March 2013A Detailed Look at Renewable Baseload Energy
JvD,
here you claim that renewables cannot be built higher than nameplate capacity compared to usage because occasionally some power would not be used. All current fossil and nuclear capacity is desigend overcapacity and much capacity goes to waste. Why do you think they subsidize night time load balancing? I thought you claimed that you designed power systems. You are claiming we cannot build renewable power to the current fossil standards! You need a consistent argument.
-
Watts Interview – Denial and Reality Mix like Oil and Water
Note: In my previous post, "his unpublished work" refers to the Anthony Watt's paper critiqued in DS#5, which fails to stand on its content or merits.
-
Watts Interview – Denial and Reality Mix like Oil and Water
John Nielson-Gammon has calculated uncertainties for his predictions; he has predicted GISTEMP for 2013 to be +0.70 +/- .09 C, for example.
Kevin - While you have some problems with the figure adapted from John N-G, you have certainly not pointed out any errors in it. Which, again, is irrelevant to the worth of Watt's paper, which has been noted to erroneously ignore 150 years of literature on TOB biases. Are you supporting his unpublished work? Or just continuing to push an Ad Hominem Tu Quoque fallacy?
-
CBDunkerson at 04:39 AM on 19 March 2013A Detailed Look at Renewable Baseload Energy
JvD, in addition to the points raised by KR... MacKay's book is based on data from five years ago. That's a completely different world in terms of solar cost and efficiency. Yet even so he found that most household electricity needs could be covered by rooftop solar (even in the UK). Where he says solar falls far short is in covering total energy needs... which basically means petroleum for automobiles and industrial power. Switch over to electric vehicles, factor in huge improvements in solar technology since MacKay did his research, add in utility solar and/or wind, allow for power transmission from sunnier climes, and use those electric car batteries to smooth out intermittency problems and suddenly a 100% renewable solution is not some distant impossibility.
Also, it is usually better if you can make an argument for your case directly rather than just saying, 'see what this other guy over here says'.
-
Clyde at 04:21 AM on 19 March 2013New Study, Same Result - Greenhouse Gases Dominate Global Warming
The abstract of the paper says -Analysing the multi-model mean over 1951 to 2010 (focussing on the most robust result), we estimate a range of possible contributions to the observed warming of approximately 0.6 K from greenhouse gases of between 0.6 to 1.2 K, balanced by a counteracting cooling from other anthropogenic forcings of between 0 and -0.5 K. -
Clyde at 04:18 AM on 19 March 2013New Study, Same Result - Greenhouse Gases Dominate Global Warming
Oops hit sumbit to soon sorry about that.dana181 says - The results of this study are consistent with the wide body of evidence supporting the settled science that human greenhouse gas emissions are the dominant cause of the current global warming.Is it a common practice in science to contine to publish papers on settled science? Like say gravity. Are scientist still (on a regular basis) publishing papers to prove gravity is settled science? -
dana1981 at 04:16 AM on 19 March 2013Watts Interview – Denial and Reality Mix like Oil and Water
The slopes of all thee trend lines are the same (0.16°C per decade). I haven't calculated the uncertainty in those trends, but that's not relevant to the question whether their most likely values are they same - they are.
-
Clyde at 04:16 AM on 19 March 2013New Study, Same Result - Greenhouse Gases Dominate Global Warming
The abstract of the paper says -Analysing the multi-model mean over 1951 to 2010 (focussing on the most robust result), we estimate a range of possible contributions to the observed warming of approximately 0.6 K from greenhouse gases of between 0.6 to 1.2 K, balanced by a counteracting cooling from other anthropogenic forcings of between 0 and -0.5 K. -
Clyde at 04:14 AM on 19 March 2013New Study, Same Result - Greenhouse Gases Dominate Global Warming
I think some minor corrections are needed.dana1981 says - This was offset by a cooling from other human influences (mainly from aerosols) of 0 to 0.5°C. These results are consistent with all prior studies of the causes of global warming (Figure 1).The abstract of the paper says -Analysing the multi-model mean over 1951 to 2010 (focussing on the most robust result), we estimate a range of possible contributions to the observed warming of approximately 0.6 K from greenhouse gases of between 0.6 to 1.2 K, balanced by a counteracting cooling from other anthropogenic forcings of between 0 and -0.5 K. -
CTG at 04:12 AM on 19 March 2013New Study, Same Result - Greenhouse Gases Dominate Global Warming
Yes, Klapper, that does make you a fake. For a start, a real skeptic would have observed that the observations during that period lie within the confidence limits of the model runs, meaning that there is no significant difference between the model runs and the observations.
Thanks for illustrating one of the key markers of the fake skeptic - perfectly happy to sieze on terms like "not statistically significant" when applied to things that you think work in your favour, like "no warming for x years", but completely ignoring them when it would work against you. -
dana1981 at 04:11 AM on 19 March 2013New Study, Same Result - Greenhouse Gases Dominate Global Warming
Klapper @2 - maybe you shouldn't assume that somebody who isn't talking about you is talking about you.
Your comment about Figure 2 also isn't correct - the 1910 to 1945 observations are within the envelope of model runs. The fact that the observed rate is faster than the multi-model mean is probably due to natural variability, which is also likely the primary explanation for the same multi-model mean vs. observations discrepancy over the past decade.
-
Composer99 at 04:10 AM on 19 March 2013New Study, Same Result - Greenhouse Gases Dominate Global Warming
Klapper:
The warming in the observations during the period you note appears to be entirely contained within the model spread of CIMP5 models, and very nearly entirely contained within the model spread of CIMP3 models. As such, your claim that "The warming rate in the observations from 1910 to 1945 is clearly way higher than the models show it should be" is incorrect.
-
A Detailed Look at Renewable Baseload Energy
JvD - I will if possible answer in more detail later, but even a quick look at Dr. Ted Trainer's work shows some poor assumptions - such as an assumed max of 25% supply from wind due to integration problems, whereas the UK has estimated 1.5-3% increase of integration costs (to the consumer) with wind providing 40% of electricity. Given that Dr. Trainer is from the UK, I find that odd, and suspect there are other errors that will become evident upon careful examination. His other points about sustainability and energy usage level are quite interesting, and worth consideration, but are quite frankly off-topic regarding the technical possibilities of supplying current and near-future power from renewables.
You are quite correct about maximum output vs transmission capacity - but I will point out that those costs are also under consideration by planners. It is clear that significant renewable input will have impacts on electrical integration - but the costs seem reasonable, and I am not aware of any show-stoppers at this point.
I've read Dr. D. MacKay's book, it's very well researched, and agree that the UK does not have the landspace required for wind/solar to supply all their needs - as I mentioned here, the UK may have a future as a net importer of energy. A transition for the UK, moving away from coal, but they are hardly the only country that is or will be an energy importer.
---
In summary, I am hearing a lot of "it isn't possible" in your posts, but little in the way of data.
-
Klapper at 03:36 AM on 19 March 2013New Study, Same Result - Greenhouse Gases Dominate Global Warming
@Albatross #1:
Why not drop the repetitive "fake skeptics" theme. Just because not everyone agrees with your interpretation of the data doesn't make them "fakes". Look at Figure 2 above. The warming rate in the observations from 1910 to 1945 is clearly way higher than the models show it should be. I'm thinking the models are missing something. Does that make me a fake?
-
Bob Lacatena at 03:12 AM on 19 March 2013Watts Interview – Denial and Reality Mix like Oil and Water
Kevin,
You can find a very clear and explicit explanation for this graph here:
http://www.skepticalscience.com/john-nielsen-gammon-commentson-on-continued-global-warming.html
Are there differences? Yes. That's why it's termed an adaptation.
It is extremely unlikely that the slope of all three trend lines are the same.
Perhaps. But have you done the math to establish the fact, or simply presumed that it is unlikely, and therefore assumed that they have been doctored? And if it turns out that the slopes are correctly computed and really are that close to each other... what does that tell you?
-
JvD at 03:00 AM on 19 March 2013A Detailed Look at Renewable Baseload Energy
"JvD - Average capacity for renewables (wind, solar, etc) is the only appropriate number to be used when judging output, and is the number used when considering input to the grid."
No. The nameplate capacity matters. When connection a wind-farm to the grid, the transmission lines need to be sized to the full nameplate capacity of the wind farm, even while perhaps only 25% on average of the transmission capacity will be utilised. similarly, in order to integrate a wind farm into an energy system, the maximum power addition that can be absorbed is the nameplate capacity, not the average capacity. For example, if a country has a peak demand of 10 GW, then you cannot install more than 10GW of *nameplate* capacity wind. Anything more than the 10GW will be curtailed (lost).It is a popular but fatal flaw to assume the average capacity is what is important. It is precisely this fatal flaw that causes the IPCC, WWF and Greenpeace scenario's to crash and burn completely.
I will once again (fourth time) point to Dr. Ted Trainer's research papers on the feasibility of large scale transitions to intermittent renewables. Simply google "Ted Trainer" and you will quickly find them all. I can also recommend Dr. David MacKay's work on renewables and his book "Sustainable energy without the hot air". Together, MacKay and Trainer have already proven everything I'm trying to explain now on this thread. It is not rocket science but very simple to understand once you think about it.
-
CBDunkerson at 03:00 AM on 19 March 2013A Detailed Look at Renewable Baseload Energy
JvD wrote: "Yes I have read probably all of them. None of them disagree with my assessment, since none of them show how renewables can power the globe. All they do is show that there is enough sun, wind, etc."
Then, when confronted with studies which DO show the "how" the response is that these studies are 'propaganda' and 'not based on science'.
How is this not classic denial?
Denier: 'No evidence exists!'
Reality: 'What about all of this evidence?'
Denier: 'None of that evidence counts!'JvD, you seem to concede that "there is enough" available renewable power to cover demand. Given that, how would you prove that energy storage and transmission are both impossible? Because, if they aren't, then 'more than enough power' + 'means of delivering power when needed' = 'problem solved'.
-
Kevin8233 at 02:42 AM on 19 March 2013Watts Interview – Denial and Reality Mix like Oil and Water
And more importantly, that the [adaptation of Neilson-Gammon's] graph is correct - unless you have some issues with it, in which case you should say so.
No, the adaptation is not correct.
1. When Neilson-Gammon made the graph, he purposefully did not calculate the confidence of the trend lines because he had made subjective choices to identify the time period and exclude "volcanic" years.
2. It is extremely unlikely that the slope of all three trend lines are the same. Assuming that his premise is correct, the noise in the system, given the small amount of data, would dictate that the trend lines would have a different slope. To state that they are the same is wrong. The only way to have them be equal is to set them equal, and not have the best fit slope prevail.
3. Even if they were the same in 2008 when the figure was created, there has since been more data points added. There is no way that these new data points exactly fit into the previously calculated trend line slope.
4. In his graph, there are only 3 volcanic years, this adaptation has 6.
5. 2006 is now a La Nina year.
So, yes, I do have a few problems with the figure.
-
Matt Fitzpatrick at 02:40 AM on 19 March 2013February 2013 Arctic Sea Ice Death Spiral Update
Figure 2 plots daily values. Figure 1 simplified the data to monthly averages. A single day could be about the same three years in a row, but the average for that entire month would not necessarily be the same as well.
-
DSL at 02:33 AM on 19 March 2013February 2013 Arctic Sea Ice Death Spiral Update
Kevin, here's the average, using PIOMAS, for the first 28 days of Feb since 2000:
2000 24.33407 2001 24.17046 2002 24.83382 2003 24.17132 2004 22.6975 2005 22.70664 2006 22.07546 2007 20.86318 2008 21.57939 2009 21.73621 2010 20.11296 2011 18.92079 2012 18.7425 2013 18.40486 Linear trend is roughly -500 km3 per year.
-
Kevin8233 at 02:22 AM on 19 March 2013February 2013 Arctic Sea Ice Death Spiral Update
One point of confusion (on my part) that hopefully someone can clear up. In the second figure, it appears that the last 3 years are all at the same level for February (the points overlap), yet in figure 1, the February line appears to be decreasing for the past 2 years? If this is representing the same data, obviously this can't be, so correct me where I've gone wrong interpretting the second figure.
Moderator Response: [JH] Please cease and desist from reposting a comment that has been previously deleted for sloganeering. If you do not comply, your posting privileges will be rescinded. -
Composer99 at 02:22 AM on 19 March 2013Watts Interview – Denial and Reality Mix like Oil and Water
Kevin misrepresentation #1: Composer99 comment set up as authoritative voice on Skeptical Science posts. As the preface to my comment notes, I am expressing my personal opinion. It might be correct, or it might not. Nevertheless, treating what I think as being equivalent to what Skeptical Science authors think is a misrepresentation.
Kevin misrepresentation #2: In a post chock-a-block full of references to the professional literature, a graph used for illustration, that happens not to be peer-reviewed (though still useful for reasons discussed by KR) is highlighted as being of special importance.
Kevin misrepresentation #3: Debunking myths requiring peer-reviewed science of necessity. If a myth can be debunked using high-school-level statistics, or elementary logic, or 19th-century physics (which could hardly be said to be peer-reviewed in the modern sense), then that is all you need to do the debunking.
In addition, as your response to Dana in #91 shows, you are still belabouring under the mistaken impression that what's important about Watts vs Neilson-Gammon is whether or not they agree or disagree with Dana's viewpoint. What's important is what KR noted:
The point here is that Watts' paper is wrong, not that it is unsubmitted.
and
And more importantly, that the [adaptation of Neilson-Gammon's] graph is correct - unless you have some issues with it, in which case you should say so.
-
A Detailed Look at Renewable Baseload Energy
JvD - Average capacity for renewables (wind, solar, etc) is the only appropriate number to be used when judging output, and is the number used when considering input to the grid.
Some numbers: 2011 US net summer generating capacity was 1.05 TW. Estimated potential US wind capacity, at a 30% gross cpacity factor, ~10-12 TW, and if using a 1/3 baseload scalar that comes out to 3-4 TW baseload. Note that this does not include solar, hydro, or other renewable possibilities - all of which expand both the average power and (by being subject to different influences on itermittancy) increase the percentage of power available as baseload.
The US National Renewable Energy Laboratory (NREL) finds it quite possible (plausible is of course another matter, mired in politics) for renewables to supply 80% of US electrical generation by 2050 meeting baseload, hourly needs, over the entire country.
If you disagree with Archer and Jacobsons numbers, please point to research supporting your point - otherwise, you are making an ad hominem argument. His opinions on nuclear, whether correct or not, are irrelevant to the data on interconnected wind plants and baseload.
-
Albatross at 00:53 AM on 19 March 2013Watts Interview – Denial and Reality Mix like Oil and Water
Leto @84,
Excellent points, thank you.
-
Albatross at 00:49 AM on 19 March 2013New Study, Same Result - Greenhouse Gases Dominate Global Warming
Interesting post, especially the part about the spread of the CMIP5 members being broader than those from CMIP3.
Well, say the fake skeptics, scientists must be conpsiring to obtain such similar results from independent studies using different methods, tools and data (/sarc). Nope fake skeptics, it is simply called consilience.
-
Bob Lacatena at 00:44 AM on 19 March 2013Watts Interview – Denial and Reality Mix like Oil and Water
A. Scott,
You said:
...you claim Watt's and crew do not discuss the science regarding this recent paper. Please support that claim.
But I did not make that claim. You fabricated it. I said that Watts spews BS (he does). That he occasionally has posts discussing science does not alter his BS output, and therefore it does not improve his credibility. And I certainly never said anything about his having or not having posts specifically addressing this paper. Obviously he has, as evidienced from this line from Dana's original post:
This is evident from the six separate posts on Watts' blog (to date) desperately trying...
However, Watts has committed enough sins over the years that anyone and everyone (or at least everyone who is not adamantly hoping for a particular foregone concusion from the discussion) should look askance at his words, and look elsewhere for answers.
-
jake7351 at 00:37 AM on 19 March 2013Science vs. the Feelies
Who did that Michael W?
-
Composer99 at 00:20 AM on 19 March 2013Watts Interview – Denial and Reality Mix like Oil and Water
Kevin:
Putting words into other people's mouths (figuratively speaking) is very poor form.
I strongly urge you not to engage in such disingenuous behaviour again.
Moderator Response: [JH] Kevin fell through the thin ice of sloganeering in his most recent post. It was therefore deleted. -
JvD at 23:51 PM on 18 March 2013A Detailed Look at Renewable Baseload Energy
"JvD: Could you provide some specifics on this? Perhaps refer to a few of these papers and explaining why they support your view?"
As I already wrote, Dr. Ted Trainer (among others, including Dr. David McKay) has already worked this out and has shown where the IPCC, WWF and Greenpeace renewable energy scenarios' fall down very badly. He has authored several peer-reviewed papers on this, and an article explaining his (and my) position can be found here:
http://bravenewclimate.com/2011/08/09/ipcc-renewables-critique/
"On what basis is your view superior to theirs?"My view is informed by science.
"Renewable baseload: Distributed networks can and will have baseload capacity - I believe the reliable baseload for a sufficiently distributed network, with zero energy storage, has been shown to be ~1/3 of average capacity (Archer & Jacobson 2007). Average capacity is IIRC ~15-30% of installed capacity, varying with type/site - by no means perfection, but a predictable fraction."
1/3 of capacity when capacity is 30% = 10% of installed capacity, which is probably about right. In Europe, the firm capacity for wind calculated in the case of a European supergrid with distributed wind power was 8% as I recall (wind industry figures), so I guess the takehome is that the USA case offers slightly higher firm capacity for connected wind than Europe. Still a 10% firm capacity rating for wind power is *terrible* and does not contradict my position on the feasibility of 100% renewables so I don't know why you are making this point. Concerning solar PV it has a firm capacity of only 0%.Be warned BTW that Stanford's Jacobson is a known propaganda producer. After Fukushima, he made some headlines in the EU with a very frightening (and completely wrong) risk assessment for the safety of European nuclear reactor fleet. Similarly, in this paper about wind firm capacity it *appears* as if connected windfarms can provide reliable baseload, but in fact the firm capacity is only 10% of nameplate capacity using Jacobson's own numbers. Similarly, the Jacobson paper on the EU nuclear fleet risk *appeared* to show huge amounts of expected fatalities per year in the EU due to nuclear accidents (and it made headlines because of this frightening appearance), but on more carefull study it turned out that EU nuclear reactors actually *save* thousands of lives yearly when compared to the alternative: coal power.
So this is a general warning: researchers like Jacobson engage in propaganda which means you have to be extra alert when trusting their research papers. Often, the conclusions that *appear* in the abstract are 180 degree opposite to the actual conclusions that follow from the particular science, as in this case. Jacobson writes to make headlines, not to increase understanding. Wind power cannot serve as significant firm capacity, which means it can only provide a minority of energy needs. The rest has to be nuclear, or else it will be natural gas or ultimately coal which equals death.
Prev 940 941 942 943 944 945 946 947 948 949 950 951 952 953 954 955 Next


