


 Arguments


Recent Comments
Prev 967 968 969 970 971 972 973 974 975 976 977 978 979 980 981 982 Next
Comments 48701 to 48750:
-
Tom Curtis at 00:53 AM on 22 March 2013How Increasing Carbon Dioxide Heats The Ocean
trunkmonkey @55, got it. Your argument is that you will ignore data you find inconvenient.
-
Tom Curtis at 22:18 PM on 21 March 2013How Increasing Carbon Dioxide Heats The Ocean
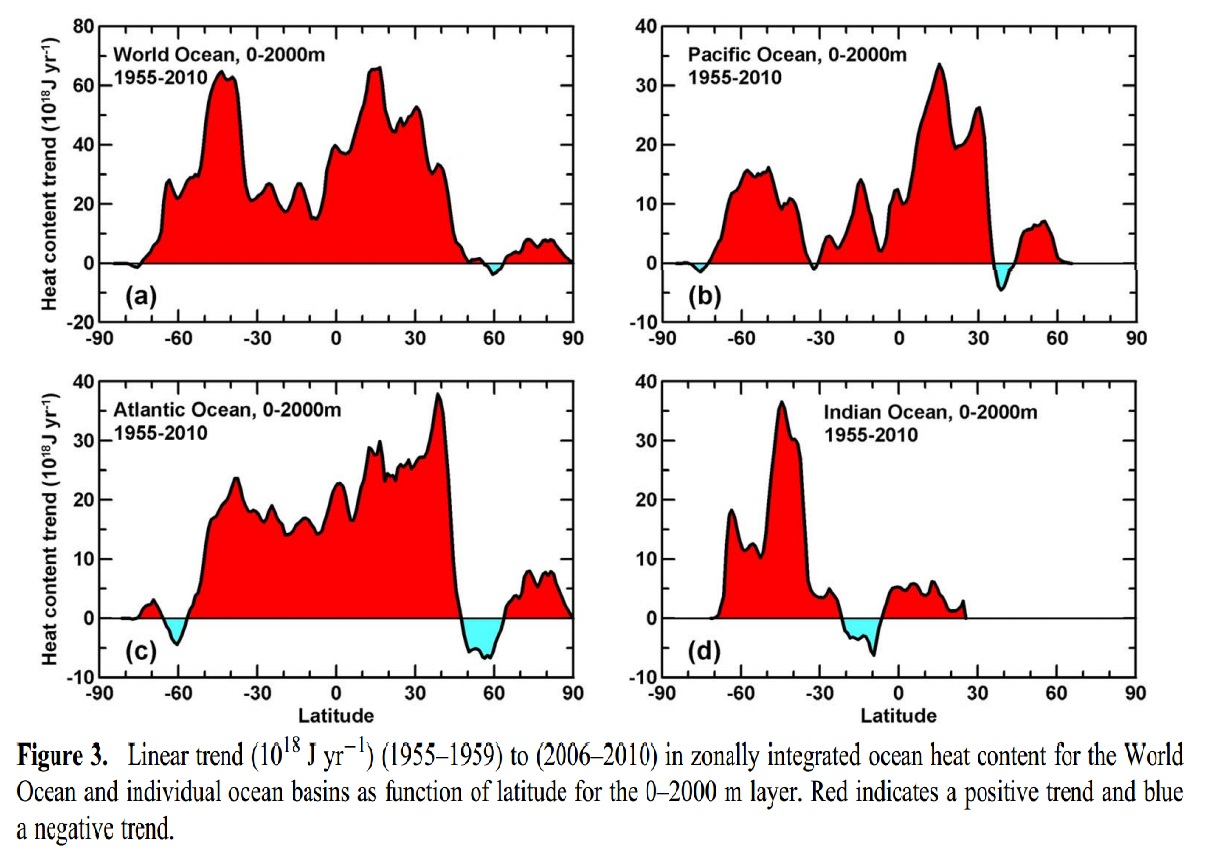
trunkmonkey @50 would like an explanation as to why the Indian, North Atlantic and Arctic are warming, while "All the other oceans are flat or cooling". I can offer no explanation for his claim is simply false:

As can easilly be seen, the South Atlantic, South Indian, and North and South Pacific are all warming quite strongly. Of course, Levitus et al (2012), the source of the graph, just divide the worlds oceans up into three oceans, so that the Southern Indian, Southern Atlantic and Southern Pacific oceans by their division includes the Southern Ocean. Perhaps it is flat or cooling?:
trunkmonkey, it appears, wants to claim falsehoods, and then fault climate science for not explaining why those falsehoods are true. No doubt he will next disprove climate science by pointing out, quite correctly, that it has no explanation as to why the moon is made of green chease.
-
Watson at 21:45 PM on 21 March 2013Tung and Zhou circularly blame ~40% of global warming on regional warming
I'm sorry, I don't understand why you object to Tung and Zhou 2013 assessement. Taking the temperature of the earth in 1910 and 2013 and joining the dots, we get a total temperature rise of 0.8o C, as confirmed by the Hadcrut 4 Global Mean temperature. Isn't that an average of 0.08o C per decade? Isn’t that what the IPCC claims is the extent of Global Warming?
Some of us have been observing the AMO effect for years, noting the almost perfect coincidence between a plot of the peaks of the 'apparent' AMO cycle, as reflected in the Southern Hemisphere temperature peaks circa 1880,1940, and 2000 and the steady rise in concentration of CO2 in the atmosphere.
If the CO2 curve is extended with ice core data, the rise in the peaks follows the carbon dioxide rise for 160 years. Meanwhile, the extended period of cooling by almost 0.3oC from 1880 to 1910 has never been explained by conventional climate science. CO2 didn't rise much in that period, but it definitely didn't fall, and yet the temperature declined for 30 years! You might like to offer that explanation today.
After 1940 there is another AMO explicable cooling phase that is always explained away by a magical process involving the increase in light reflecting aerosols. But that explanation is deeply flawed for two reasons. One, the major global cooling in the Southern Hemisphere during the period 1940-1960 takes place in the early part of the period before the aerosol build up, which according to the theory, mostly affected the industrialized Northern Hemisphere. Secondly it magically reverses the cooling trend moment clean air legislation to reduce SO2 emissions is passed, despite the fact that the SO2 emissions have fallen only slowly.
That sudden temperature rise, especially in the Northern Hemisphere, corresponds not to aerosol effects but the return of the warming phase of the AMO, a cycle that began in the Southern hemisphere in the 50s. Since 2000 the Southern hemisphere has shown some slowing in cooling followed by the Northern Hemisphere. This is exactly the same hemispheric pattern that occurred during the 40s and 50s and again in the period 1880, 1905. All the evidence is there to explain why there has been a slowing in global warming over the past decade or so, pointing to a return to rapid waming by 2020 at the latest.
What I can't understand is, why, if as this analysis shows, the AMO makes no difference to the fact that real global warming is being driven by CO2, and it is clearly accelerating alarmingly, why not tell the full story?
Moderator Response: [RH] Fixed links that were breaking page formatting. -
CBDunkerson at 20:52 PM on 21 March 2013A Detailed Look at Renewable Baseload Energy
So... extracting uranium from the oceans is a feasible plan, but storing wind and solar power for later use is not.
Right, we've crossed the 'five fold crazy' line. I'm done here.
-
Tom Curtis at 19:35 PM on 21 March 2013Most of the last 10,000 years were warmer
Lanfear @20, the GRIP and GISP2 icecores where both drilled at the Summit. Hence the difference in temperature as measured at GRIP is a reasonable proxie for the difference at GISP2.
Your chart shows the difference between the absolute temperature in 1895 as measured using the GISP2 ice core proxy, and the absolute temperature as measured at a nearby location using the thermometers in the 2000s, ie, the difference between the end of the GISP2 icecore and the higher of the two blue crosses in last graph in the original post. However, as can be seen in the second last graph, GISP2 temperatures are cold relative to GRIP site temperatures in 1895, so it is far better to take the anomaly as is done in the OP or in the second graph @15. Even that should be taken as indicative only, rather than an exact measure.
-
Lanfear at 19:14 PM on 21 March 2013Most of the last 10,000 years were warmer
Here is my very crude attempt to recreate the graph to modern times, and I would very much like to hear what mistakes I have done along the way.
FWIW I'm not a scientist, so there...
Anyway, the reason for my effort is that I have for some time been a bit annoyed that the current temperature (2009) grafted on the last graph in the text is not directly from the GISP/dome, rather it is derived from GRIP. This IMO makes it a bit weaker as a argument when presented to a layman/'skeptic' even if it does have a sound scientific methodology behind it.
So after some hunting I found some near surface temp measurements here; from the summit, which AFAIK is where GISP2 was drilled. The station numbers are documented here.
I threw the data in a spreadsheet and took the average from (after converting each timepoint to decimal) 2005.813 - 2011.813, which gave me -28.3°C. Incidently, and not necessarily meaningfully, the max temperature of the last 3 years are all above 0°C and 'rising'.
Anyhow. I take that average and add it as a data point in to the Alley record linked in the text as for 2008 and get the following graph:

The trend is for Alley data only (-9000 - 1880), just as reference.
I'm sure I have made some grave errors in the process, and would appreciate constructive input. Thanks.
-
trunkmonkey at 14:47 PM on 21 March 2013How Increasing Carbon Dioxide Heats The Ocean
On average the oceans are always warmer that the atmosphere and net transfer is skewed 14% from the oceans to the atmosphere. Theoretically the thermal mass of the atmosphere, if it were warming, would reduce the margin and warm the oceans. (snipped)
The oceans on average have continued to warm, quite a bit. This is really wierd. But what is even wierder is that all of the net ocean warming can be accounted for by the North Atlantic, the Indian, and the Arctic oceans. All the other oceans are flat or cooling.
So if you can explain to me how the atmosphere could cause these three oceans to warm and allow the rest to languish or cool, I would be very interested to hear it.
Moderator Response: (Rob P) - Sloganeering snipped. Do you have a reputable scientific link to back up your claim? I'm aware the the Pacific Ocean has not warmed in the last few years, but this is nothing new. It's happened many times before, each time followed by abrupt warming. The oceans are dynamic and shuffle a lot of heat around - even while the oceans are gaining heat though the greenhouse gas forcing of the cool-skin layer. There is no expectation that year-to-year warming is continuous because changes in ocean circulation, such as ENSO (La Nina/El Nino), can temporarily act against the long-term warming trend. Therefore, over short time frames, it can appear very noisy, but thus far, over longer (decadal) timescales, the warming pattern is smooth and incompatible with natural variation. See Sedlácek & Knutti (2012). -
Composer99 at 12:42 PM on 21 March 2013How Increasing Carbon Dioxide Heats The Ocean
Kevin, even with greater evaporation, when one considers all the energy fluxes into and out of the ocean cool skin layer, as long as the change in net energy flux causes the cool skin to warm, the temperature gradient between the cool skin layer and the bulk ocean below it will decrease.
Conduction from atmosphere to ocean is not the only (and I suspect not even the primary) manner by which energy transfers from the atmosphere into the ocean cool skin layer.
-
Magma at 12:14 PM on 21 March 2013Death in Jurassic Park: global warming and ocean anoxia
John, as a geoscientist that would certainly be my own preference. Nice job on the original post, by the way.
-
JasonB at 11:42 AM on 21 March 2013A Detailed Look at Renewable Baseload Energy
JvD,
How would you propose to solve the mismatch between supply (which is ideally constant at a high capacity factor) and demand (which fluctuates over a wide range) at high penetrations of nuclear power?
The places I've checked have a difference between minimum demand and maximum demand over the course of a year of about 2.5:1, and over the course of a day as much as 2:1.
If you want to use nuclear to meet peak demand, then the capacity factor will be much lower than 100% and the cost of the nuclear power will be much higher than advertised.
If you want to maintain close to 100% load then you either need to limit nuclear to about 40% penetration, in which case it's only ever one part of the solution, or you need to find useful things to do with the unused capacity, in which case I'd be interested in knowing why the same solutions wouldn't apply to intermittent renewables in an over-capacity situation.
The bottom line is that both intermittent renewables and nuclear power need to be coupled with some storage mechanism, albeit for different reasons. Neither are a good substitute for the current mix of low-cost baseload power plants coupled with higher-cost load-following and peaking power generators on their own and it's disingenuous to dismiss either simply on that basis because no technology scales up to 100% well, and that includes coal — otherwise we wouldn't have a mixture of technologies now!
Also, if you're going to use fast breeders to counter the claim that there are genuine and well-founded concerns about uranium supply, then you should also be up-front about the cost of electricity from those fast breeders and the current state of production readiness of the technology. Exactly how far away are we from large-scale rollout of fast breeders (especially given how far behind schedule and over budget the first two EPRs are, and they're conventional reactors!)? How much CO2 can be abated by continuing to build wind farms at the present rate in the meantime?
-
Doug Bostrom at 07:59 AM on 21 March 2013A Detailed Look at Renewable Baseload Energy
JVD: "In my country, advocates are advising we raise energy taxes on industry to pay for the production subsidies and other sustainability projects. This will move industry out of the country, since energy costs are easily 30% to 50% of total revenues for the largest energy users (chemistry and metalurgy). Fine factories, smelters and forges are already closing, citing energy costs and prospects. Where do these factories go?"
Adopting a blanket refusal to acknowledge human nature or the art of compromise or the difference between what ought to be and what is, as do you, a rejoinder equally as plausible as the nuclear panacea you offer would be to say, "Just make sure there are international agreements to prevent migration of economic activity to the least responsible host. Just make sure everybody behaves responsibly."
The problem is, even while having only four letters, "just" is too often a substitute for a reasoned, credible plan requiring much more thought, let alone wisdom.
Let's start with understanding the basics before we move to extract all the uranium from the world ocean. How do we keep rats out of the switchboards of nuclear power plants? More to the point, how do we account for the foible of human nature that means we overlook the possibility of a rat interrupting the primary flow of cooling water at a fission generation facility? If we have N nuclear facilities with X/N significantly affected by a rodent, how many facilities will be affected by the same general problem of failure of imagination if we multiply N by 10,000? What is X? How many collisions of an unimagined rat with a switchboard may we expect? How many plants will have inoperative backup power available, leading to some probablility of a collision between a wayward rat and yet another facet of human fallibility in the form of a disgruntled or simply incompetent employee?
So far, X as it is emerging doesn't look promising as a number when it comes to replacing all of our energy supplies with nuclear fission plants; with about 450 operating power generation plants attached to a record of 3 plants suffering failures of human nature leading to irreparable damage in at least one core, X isn't looking very attractive. Moving the present proportion of nuclear generation capacity against demand from about 6% to 100% would produce what number of failures over 40 years, in keeping with the actual record?
But perhaps we can change human nature. Or perhaps we can keep N to a number more in keeping with X.
-
Tom Curtis at 07:59 AM on 21 March 2013How Increasing Carbon Dioxide Heats The Ocean
Kevin @45:
1) If there is no increase in skin surface temperature, there is no increase in evaporation (by your argument), and hence no evaporative cooling. Therefore while an increase in evaporation may limit the increase in temperature (by your argument), it cannot prevent there being an increase.
2) In a confined volume, an increase in evaporation will result in an increased vapour pressure of H2O in the atmosphere above the water surface. The increased vapour pressure results in an increased frequency of water molecules in the amosphere striking the surface, and being absorbed, carrying there energy of motion into the water as heat. After warming stops, an equilibrium will be reached in which the frequency of water molecules entering the atmosphere from the liquid will equal the frequencey of molecules entering the liquid from the atmosphere resulting in an equilibrium of transfer of water molecules and (if atmosphere and liquid are the same temperature) of energy transfers.
If the atmosphere is warmer than the liquid, on average the energy transferred to the liquid by water molecules being absorbed will excede the energy transfer to the atmosphere by evaporation. Warming the atmosphere without warming the liquid will result in an increased energy transfer to the liquid by this means.
The Earth's atmosphere is slightly more complex. It is closed for practical purposes, but some of the water vapour in the atmosphere precipitates out. The increase in evaporative cooling with increased surface temperature is therefore limited by the increase in precipitation, not by the increase in sea surface temperature. As Kevin has shown nothing about how much precipitation will increase, his argument does not even get of the ground.
-
Leto at 07:54 AM on 21 March 2013How Increasing Carbon Dioxide Heats The Ocean
Kevin,
You wrote:
Since conductive heat transfer from gas to liquid is quite small, it is obvious that the increase in evaporative losses shall dominate.
Are you really trying to say that the dominant effect of a warmer atmosphere is to increase evaporation so much it cools the ocean? Or did I misread your post at #45?
-
Paul D at 07:06 AM on 21 March 2013David Rose Hides the Rise in Global Warming
Interesting twist that Myles Allen response in The Guardian.
I also think that if Rose is a neighbour, then Allen is being diplomatic.In any case, has Allen seen the attack Rose made in the follow up article?
Currently it is law that all local government councils in the UK must have one climate change officer, Rose was attacking this (amongst other things). In fact the follow up Rose article used FOI data which must have taken weeks/months to obtain. So Rose appers to have planned the 'attack' before speaking to Myles Allen. -
JvD at 06:46 AM on 21 March 2013A Detailed Look at Renewable Baseload Energy
"You argue that there is so much excess renewable power that it must regularly be given away to neighboring countries for free and that renewable power cannot be used to power various forms of energy storage facilities because they would frequently sit idle due to the lack of excess power."
No, I argue that if we try to go for a 100% intermittent fuel supply, we will probably fail in getting there, due to the cost.Additionally (and this gets my goat), it actually worsens the problems we are trying to solve. In my country, advocates are advising we raise energy taxes on industry to pay for the production subsidies and other sustainability projects. This will move industry out of the country, since energy costs are easily 30% to 50% of total revenues for the largest energy users (chemistry and metalurgy). Fine factories, smelters and forges are already closing, citing energy costs and prospects. Where do these factories go? (let alone the poor highly skilled workers, who are lamenting their years of investment in Best Practice industry practices. A kick to the teeth. Their craft will ikely move to coal burning giants. So much for good intentions.
Obviously, it seems, we should - if anything - seek to lower energy costs for energy intensive industries, bringing them into our countries so they abide by our environmental laws and efficiency standards. But this evidence is completely lost on popular sustainability guru's advising for more taxes on energy producing industries.
Nuclear power answers this problem. Nuclear power can power solar panel factories, electric car factories and wind turbine factories, serving the relatively minor demand from households in stride. Solar panels cannot, wind turbines cannot, and electric car batteries cannot do this. Not without grotesque energy storage facilities and legions of fossil fuels plant, burning their poison quietly on the side, more of it every year, while happily egging us on to simply 'believe in the possibility of a 100% fossil-free future'. The big joke is on us suckers, I argue.
Nuclear fuel is inexhaustible. The earth's crust contains hundreds of trillions of tons of uranium and thorium fuel. Enough to power thousands of GW of nuclear power plants for billions of years. Of course, we can only get at a small fraction of that vast radioactive source. There is 4 billion tons in the ocean we could extract at a cost that would factor negligably in the price of nuclear power. Enough to power the entire world economy five times over for tens of thousands of years. More than enough time to carefully build out what truly sustainable and cost effective renewable source we have, including fusion.
(Hopefully only very little 'bio-based' energy, which is overhyped and dangerous in worse ways than nuclear. And very inefficient. See Hartmut Michel http://www.treehugger.com/renewable-energy/all-biofuels-are-nonsense-says-nobel-winning-photosynthesis-expert-hartmut-michel.html.)
The myth about so-called 'uranium shortage' has to be put to rest and I argue that posting an article on SkS illuminating people on the basics of advanced nuclear energy would be a very good development.
http://www.mcgill.ca/files/gec3/NuclearFissionFuelisInexhaustibleIEEE.pdf -
Matt Fitzpatrick at 06:45 AM on 21 March 2013David Rose Hides the Rise in Global Warming
I'd argue it's a gallop all the way through. There's at least three unsubstantiated claims about climate science and policy in the headline alone.
Pieces like these read more like advertising than any real scientific endeavor. Kind of like the offers for cheap pharmaceuticals I get by email twenty times a day. The message never changes, but sometimes the volume does.
-
Neven at 06:10 AM on 21 March 2013David Rose Hides the Rise in Global Warming
The only thing I'm interested in is if, how and how much Rose is paid by the GWPF for his handiwork.
-
John Russell at 06:04 AM on 21 March 2013David Rose Hides the Rise in Global Warming
Just in case anyone missed the update (above) which we just added, the Mail on Sunday have now added these words (including the link) to the end of Rose's article...
"The original graph was produced by Dr Ed Hawkins, a senior research scientist at the National Centre for Atmospheric Science. Discussion of the graph and its meaning can be found on the website Climate Lab Book.
We apologise that this credit was initially missing."
Of course, they should have written, "The original graph which we plagiarised..." .
We understand from a tweet today by Tamsin Edwards of Bristol University that the Mail's footnote came about as a result of requests to David Rose by her and Ed Hawkins.
-
DSL at 04:28 AM on 21 March 2013How Increasing Carbon Dioxide Heats The Ocean
Kevin, have you been over to SoD on this subject?
-
Nick Palmer at 04:03 AM on 21 March 2013David Rose Hides the Rise in Global Warming
Funglestrumpet @18 "Surely, the opening sentence to this post: "It seems like we have to debunk this myth on a weekly basis" shows that a change of tack has at least to be considered"
The roots of this consistent denier/"sceptic" meme must be that the effects of increased CO2 have been consistently presented as X° C per decade which created a loophole for critics to pounce on every time the surface temperatures don't respond in such a linear way.
While the normal presentation of the expected cumulative heating of the total sytem is a scientifically "pure" parameter, when modelled projections are put to the public there strongly needs to be some way to better communicate that the cyclic non-cumulative variations (ENSO etc) are pretty large and can swamp the upward trend for a long time - like waves on a beach can swamp the incoming tide line.
I think the graphs from Foster and Rahmsdorf, which clearly show the underlying signal by subtracting natural variations, need massively greater exposure. Full page newpaper ads. 30 second TV infotainment ads. The more academic scientists, who are bad at adequately communicating the science to the public, need to be trained to use such aids when speaking to or being interviewed in public. The IPCC itself needs to feature them prominently, right up there in the summary for policy makers and not buried deep in some attribution study appendix.
-
Kevin8233 at 03:49 AM on 21 March 2013How Increasing Carbon Dioxide Heats The Ocean
I know that this thread is old, but some comments are still appropriate.
As I understand this article, the decrease in temp gradient in the cool skin layer is what allows increases in atmospheric CO2 concentrations to further warm the oceans.
This can only be possible if conductive warming of the cool skin layer from the ghg warmed air above can prevent more heat loss than an increase in evapoaration heat loss due to a ghg warmed atmosphere.
Greenhouse gases, such as carbon dioxide, trap heat in the atmosphere and direct part of this back toward the surface. This heat cannot penetrate into the ocean itself, but it does warm the cool skin layer, and the level of this warming ultimately controls the temperature gradient in the layer.
From other threads, it is known that the increase in evaporation heat losses is 4%. This is substantial. Since conductive heat transfer from gas to liquid is quite small, it is obvious that the increase in evaporative losses shall dominate.
Moderator Response: (Rob P) Note the experiment carried out by Professor Minnett which effectively debunks your claim - it is a central plank of the post. Also read Fairall (1996)- their observations & modelling demonstrated the the net effect of the cool-skin is to warm the ocean in the tropics. This is where the bulk of sunlight enters the ocean. -
Bob Loblaw at 03:37 AM on 21 March 2013New Study, Same Result - Greenhouse Gases Dominate Global Warming
Klapper@35:
After I had posted my previous comment, it occured to me that you might be referring to Sun Spot Number. Sadly, sunspots are not a measurement of TSI. SSN and variations of it (umbra-penumbra ratios, etc.) are one of the wasy that some people have estimate past TSI. Moderator DB has pointed you to a post here that discusses reconstruction of TSI. Your correlation of TSI to SSN confirms a link, but you have not presented any results that would tell me what the uncertainty in that correlation means in terms of TSI input to a model.
As for aerosols, you seem to be under the illusion that the only thing that matters is volcanic events, and even then only that they happen. Estimating the actual optical properties of the ejecta is important, as is the background level of aerosols from other sources (e.g. industrial).
From that point, all you seem to have is Feelings. You certainly haven't convinced me that you actually understand the importance of the accuracy of inputs to a model for studying past climates, how those inputs can be estimated (in the lack of direct readings), or the limitations that places on what we can do with such a model run.
If you wish to continue this, I will follow you to the What caused early 20th Century warming? thread. Nothing here at SkS is truly dormant - all comments will show up in the Recent Comments thread (in the middle of the main menu bar just under the masthead of each page here at SkS).
-
Doug Bostrom at 02:48 AM on 21 March 2013A Detailed Look at Renewable Baseload Energy
I should add that while I think we're very much unsuited to build and operate nuclear plants because of the nature of our species, I also think that with sufficient humility we may yet still do so with a net positive benefit despite a track record that has been spotty and will continue so. However it's still the case that several decades of intensive experimentation in self-deception by the nuclear industry seem to confirm that viewing nuclear power generation as it exists today through rose-tinted glasses does not adequately work as a means of popularizing the technology.
-
Doug Bostrom at 02:42 AM on 21 March 2013A Detailed Look at Renewable Baseload Energy
Further to Michael, many reasonable people will conclude that an irreparably damaged nuclear plant has become nuclear waste and hence a waste disposal problem. To the extent that waste then redistributes itself in an uncontrolled fashion, it's a waste disposal failure. Not having a successful plan to deal with the aftermath of a failure is itself a waste disposal failure.
Unfair framing? Well, is the Fukushima Daiichi generation plant nuclear waste, or not?
Our poor imaginations are no excuse for our errors. The hopeful outcomes we imagine collapse in the face of opposite facts.
-
Lionel A at 02:24 AM on 21 March 2013David Rose Hides the Rise in Global Warming
finglestrumpet #18
Point and SHIFT/Click on the link in the 'ps' will take you there.
I did try using the
Explosive Evidence - Experts Speak Out
construct that once worked but had trouble with it in this new gizmo editor, it did not look right in Preview, and there is no way back for further editing or using Submit.
-
OPatrick at 02:13 AM on 21 March 2013David Rose Hides the Rise in Global Warming
Dana #16 - I suspect Myles Allen's generosity towards David Rose may be somewhat influenced by their being near neighbours. Very local politics may be coming in to play here.
-
Stephen Leahy at 02:11 AM on 21 March 2013David Rose Hides the Rise in Global Warming
I too was surprised by Allen's final words. Given Rose's track record on the issue he must be quite the charming actor. The Mail has a pretty clear anti-renewable energy agenda but Rose doesn't have to be a party to it.
#15 Exactly indeed. That is why we jurnos call experts in first place. Scientists do, and should, check me out before agreeing to talk on record. And check with colleagues about their experience w specific reporters.
Dana - nicely done explanation of yet another messy distortion.
-
michael sweet at 02:03 AM on 21 March 2013A Detailed Look at Renewable Baseload Energy
JvD:
you say: "This is not speculation, but demonstrated by history. In OECD countries, nuclear waste was always handled, has hurt noone and poluted nothing. Strong indication that we know how to handle it."
In Fukushima the nuclear waste pools built on top of the released steam into the atmosphere and may have boiled dry. It released enormous amounts of radiation into the local environment, in addition to radiation released from the nuclear cores. Thousands of people have been forced out of their homes and parts of the sea are not fished due to the radioactive materials, an unknown amount coming from nuclear waste. Babies have been tested for nuclear exposure. Milk and vegetables have been withdrawn from the market. If that means "has hurt noone and poluted nothing" to you I am amazed. Are the rest of your claims as good as this one???
-
funglestrumpet at 02:02 AM on 21 March 2013David Rose Hides the Rise in Global Warming
It is all very well critising David Rose and his ilk, but they have families to feed and mortgages etc. to repay. While no present or future sanction exists for him and his fellow correspondents, such as Melanie Philips, Peter Hitchens etc., they have a choice: submit articles that are going to please their editor and thus win more commissions, or tell it the way it really is and lose a significant source of income. I don't for one minute think that they are not fully aware of the error of their ways. The print media is collectively in dire straights, thanks to the internet, and will do anything to please its advertisers. As for their ethics, well, they are newspaper people, which says it all in my book.
Similarly, one also has to have sympathy for those scientists who take the fossil fuel industry's shilling and by pure coincidence find that climate change is not going to be too bad after all. I am sure that they, too, have families to support. It is just the way the world works today. Look at the role of lobbists and political sponsors and the millions spent trying to become President of the U.S.A. Can you remember when democracy actually worked and money did not swear when it talked? I can, but only just. I don't like it one bit, but I can't ignore it. It is called facing the facts.
Perhaps this side of the fence should take a leaf out of Architects and Engineers 911 Truth's approach to getting its message across. Imagine something like Explosive Evidence - Experts Speak Out but with climate change as the issue. (Pilots for 911 Truth videos are also interesting to watch, especially for those interested in aeronautics.)
Surely, the opening sentence to this post: "It seems like we have to debunk this myth on a weekly basis" shows that a change of tack has at least to be considered. I imagine that most, if not all, of those in the scientific community will by now have formed an opinion on climate change, so there are very few left that have yet to decide their stance on the matter, no matter how often this site publishes the latest findings.
Perhaps a few record breaking temperature years will do the trick, but do we have that long? It seems to me that Old Mother Nature is having a laugh at our expence. Perhaps by not quite providing headline grabbing global temperatures so that there is not a collective effort to combat the changes to the climate that are slowly taking place is her way of solving over-population. It is all very sad when one looks back at the missed opportunities the world's leaders have had to act collectively for the common good.
ps. The above link is a technique that I have not used much, so if it fails, please copy and paste: http://www.youtube.com/user/ae911truth into your browser.
-
DSL at 01:55 AM on 21 March 2013David Rose Hides the Rise in Global Warming
Yah, Dana, that's actually laughable. The suggestion that Rose is a victim is apalling. Knowing what I know about the construction of rhetoric, the "newsroom" would have had to completely re-write Rose's pieces each week. I suspect that Allen knows this, though. I, too, am prepared to believe that, if evidence can be found to support it.
Ha. Ha. Ha.
-
dana1981 at 01:29 AM on 21 March 2013David Rose Hides the Rise in Global Warming
Dr. Allen's conclusion seems rather naive:
"I am perfectly prepared to believe David sent in an accurate article that was then hacked to pieces in the newsroom"
Given Rose's long long history of misrepresenting and distorting climate science and scientists, I wouldn't believe that for a second.
-
Matthew L at 01:21 AM on 21 March 2013Lessons from Past Climate Predictions: Syun-Ichi Akasofu
Thanks Tom for taking the time with those comments. The first one went over my head somewhat, but the second with the history on the sunspot cycle research and backwards projection of Akasofu's chart was very informative.
This example has also clarified in my mind that climate prediction isn't amenable to simple linear models - there are just way too many factors involved.
-
Albatross at 01:08 AM on 21 March 2013David Rose Hides the Rise in Global Warming
Thanks OPatrick @14,
Someone in the comments section summed up part of the problem nicely:
"[Dr. Myles Allen] "But if climate scientists refuse to talk to Mail on Sunday correspondents, then their only information sources left are bloggers and David Whitehouse."
And the problem with that is? "The Mail story is based on bloggers and a non-expert" doesn't have much credibility in comparison to "The Mail story is based on an interview with climate scientist, Myles Allen". You gave their lies credibility."Exactly, therein lies the problem and scientists need to wake up to that fact. If scientists do elect to speak to a journalist, then they need to insist that they (the scientist) record the interview.
-
OPatrick at 00:40 AM on 21 March 2013David Rose Hides the Rise in Global Warming
Myles Allen has responded in the Guardian.
-
Philippe Chantreau at 23:36 PM on 20 March 2013A Detailed Look at Renewable Baseload Energy
"In OECD countries, nuclear waste was always handled, has hurt noone and poluted nothing."
Fair enough, and mostly accurate, although I haven't researched it. However, you're talking about making a drastic switch to global scale production in which nuclear will be the dominant source and inevitably will be undertaken by most countries, including non OECD. Kabul can't even keep up a decent sewer system and people there get exposed to this lovely thing known as "fecal dust", you feel like taking up a nuclear energy contract in this human environment? Hmmm...
Furthermore, we have not yet moved beyond storing away that waste with the assumption that we will continue to do so for 20K years or so. Perhaps we should reserve definitive statements on our ability to handle it until that time has gone by.
You didn't adress the supply issue. At current consumption rates with current technology, it would last about 200 years. Projecting from current rates of growth, the MIT study below sees a peak in 2076, only about 60 years away, depending on what's really in Australia. Of course, they're too busy extracting coal right now.
http://dspace.mit.edu/handle/1721.1/54467
However, with the rate of growth you suggest, it's anybody's guess how much earlier that would happen, even with immense undiscovered Australian deposits. Some of the equipment might not have too much of a chance to become obsolete. Of course, we could extract U from seawater but then how closer are we to a commercially viable solution of that kind than to energy storage solutions that would solve the curtailment problem?
Bottom line is, while nuclear in its current form is probably an indispensable step, it is still only a transitional solution. It may be good for 70 years, or a couple of hundreds, but to be a longer term panacea it has to be different than what we have now, different enough that a radical transformation will be necessary again. There is no silver bullet, unless we get fusion going. This is a finite world.
-
gws at 23:17 PM on 20 March 2013A Detailed Look at Renewable Baseload Energy
JvD, thanks for coming back and explaining your position better.
I think there is an issue here, which your assertiveness suggests you have not accepted yet, namely that your position is not the ultimate one. While climate science itself is consilient and displays a remarkable consensus, how best to go forward to address our climate and energy problem is not settled. But it is a needed discussion, so you are welcome to argue the way forward.
Statements such as "... which is the scientific position" (JvD @353 and your whole post at @351) suggest that you seem to assume you know a truth few other people have realized yet, while several people here have put reasonable arguments forward suggesting you are not entirely consistent, or correct. Thus, so far the conversation is not goal oriented, which is also your fault. Too many assertions, too little focus on either side. Everyone should focus on a smaller issue first, say "why is the economic forecast (in the EU paper link you gave) so bleak?" and "is that an accepted fact we cannot hope to change?", or "how can we (best) make renewables provide baseload power?", I suggest. Then take it from there.
On the nuclear discussion: You will not likely see a statement on SkS in favor or against nuclear energy. As there are many arguments for and against that technology, so there are many views among folks here, quite democratic. Your posting style only alienates in this case.
-
Michael Whittemore at 22:55 PM on 20 March 2013Science vs. the Feelies
Great video series by David Archer, but you have to wonder if a mass release of Methane was able to drive up the temperature, it might be able to increase the amount of water vapour in the atmosphere like seen on Venus and also warm the Tropopause just enough to start a runaway Greenhouse Effect. It may not have happened on Earth before, but Earth has never had humans until now.
-
John Mason at 22:31 PM on 20 March 2013Death in Jurassic Park: global warming and ocean anoxia
@ Magma - I can append the following, if it's helpful - elemental abundances in typical seawater by ppm and % as opposed to atomic:
Element ppm Percentage Oxygen 883,000 86.0341% Hydrogen 110,000 10.7177% Chlorine 19,400 1.8902% Sodium 10,800 1.0523% Magnesium 1,290 0.1257% Sulfur 904 0.0881% Calcium 411 0.0400% Potassium 392 0.0382% Bromine 67 0.0066% -
John Mason at 22:06 PM on 20 March 2013David Rose Hides the Rise in Global Warming
@ John, St Barnabas - have sent them a link to this page.
-
StBarnabas at 21:53 PM on 20 March 2013David Rose Hides the Rise in Global Warming
@John Russell
Not a report as such. Just a regular slot what is in the papers early Sunday morning, where it got a mention. Sadly half asleep in bed at the beginning- had a rude awakening!, Possibly I can find it on BBC I-player but it was just a 30s or so summary going through the main points of Rose's article. Job done as far as the Skeptics are concerned of course...
-
CBDunkerson at 21:15 PM on 20 March 2013A Detailed Look at Renewable Baseload Energy
JvD, setting aside the fact that your analysis is at odds with findings by numerous studies... it also seems to be at odds with itself.
You argue that there is so much excess renewable power that it must regularly be given away to neighboring countries for free and that renewable power cannot be used to power various forms of energy storage facilities because they would frequently sit idle due to the lack of excess power.
These scenarios cannot both be true. Indeed, my understanding is that they are both false, but it is clearly impossible for there to be both 'too much' excess renewable power and 'too little' at the same time. Thus, surely you must acknowledge that at least one of these arguments is allowing hyperbole to run amok?
-
JvD at 19:53 PM on 20 March 2013A Detailed Look at Renewable Baseload Energy
My comments don't seem to be published anymore ... will come back later.
-
JvD at 19:52 PM on 20 March 2013A Detailed Look at Renewable Baseload Energy
Excerpt from Barry Brooks analysis, which describes my position (which is the scientific position):
"The critique of the future global role of renewable energy by
Trainer (2010) underscored many important limitations associated
with variability, dispatchability, large-scale energy storage, the need
for overbuilding and geographical replication (and the likely consequence: ‘dumping’ of unused excess energy), energy returned on
energy invested, and other key points. The meta-analysis by
Nicholson et al. (2011) also considered technological maturity, cost
and life-cycle emissions as constraints on renewables’ capacity to
displace fossil fuels. Although I support Trainer’s (2010) conclusion
that renewables alone will not be able to ‘solve’ the greenhouse
problem, I argue that his dismissal of a major role for nuclear fission
energy, working in complement with other low-carbon energy
sources, was unjustified.
The principal limitations on fission energy are not technical,
economic or fuel supply—they are instead tied up in the complex
issues of societal acceptance and public education (Adamantiades
and Kessides, 2009; Pidgeon et al., 2008), fiscal and political
inertia (Hyde et al., 2008; Lund, 2010), and inadequate critical
evaluation of the alternatives (Jeong et al., 2010; Nicholson et al.,
2011; Trainer, 2010). Ultimately, as the urgency of climate change
mitigation mounts, and requirements for sustainable growth in
developing economies and replacement of aging infrastructure in
the developed world come to the fore, pragmatic decisions on the
viability of all types of non-fossil technologies will have to be
made. Engineering and economics realities point to a large role for
fission in this new energy future." -
JvD at 19:48 PM on 20 March 2013A Detailed Look at Renewable Baseload Energy
"And... you consider your assumption of 100% curtailment of excess renewable energy to be 'honest'?"
Excess energy from intermittent renewables will follow the following path:
1. First, it will be forced exported. It may even be exported at negative price, which already happens sometimes in Denmark and Germany. In that case, foreign energy consumers are actually *paid* to take the electricity. That is because destroying electricity costs money, so sometimes it is cheaper to pay energy users to take it. Of course, using energy export as a way of mitigating the problem of oversupply of intermittent renewables simply transfers the problem to the neighbouring country. For example, in my country, the Netherlands, the liberal politicians are reducing the targets for intermittent renewables build because we are already getting more and more imported electricity from Germany. In fact, we are getting this energy very cheaply, because the Germans have to underbid our local energy suppliers. Sometimes, we literally get 'free' electricity from Germany in this way. Obviously, increasing amounts of curtailment and forced export will bankrupt the energy suppliers sooner or later, which is the kind of problems Germany and Denmark are currently grapling with, although almost nobody realises this. Still, as long as German taxpayers are willing to ignore how they are being exploited, Dutch consumers will happily consume their expensive electricity for free.
2. Second, if 1 is not an option, and if it is possible, the intermittent energy source will be taken offline. Modern wind turbines have the ability to shut themselves off precisely for this reason, which reduces the need for costly stand-alone electricity destruction facilities.
3. Finally, destruction. If 1 and 2 are tapped-out, and if large, prompt supply shock occur (which happens when cloud front pass over solar farms, or when storms hit wind farms, when demand drops quickly, or when there is no where to go for the excess electricity for some other reason, the electricity is then destroyed in load banks. Load banks may consist of large resistence circuits or steel shafts drilled into the ground to dissipate electricity in the ground. This is currently used in Denmark and Germany. Note that those countries still only have a minority penetration of intermittent renewables, yet the problems of curtailment are already glaring. As they increase those sources further, they will need larger and larger electricity destruction facilities. Moreover, the tax-payers in those countries always pay for the full production cost of the renewable electricity that is being destroyed in this way, thereby also destroying their own pocketbooks and failing to reduce their coal use. in fact, Germany used 5% more coal last year, even while intermittent sources grew. Closing nuclear power plants is of course a massive own-goal of the Germans and a hit against the health of the planet and the German people. The increasing coal use in the EU will kill an additional 900 people every year (5% of 18000 per year current), which is 15 times the number of people killed in total by Chernobyl.
Finally, the concept of using the excess electricity for hydrogen or synthetic liquid fuels production or some other worthy cause will not work, for a simple reason. Such facilities are extremely capital intensive and need to be used 24/7 in order to have a hope of recovering investment costs. Certainly, if such facilities would sit idle until such time as there is an excess of intermittent energy, the unit cost of the hydrogen or synfuel produced will multiply.
-
JvD at 19:20 PM on 20 March 2013A Detailed Look at Renewable Baseload Energy
"You are putting some blame on SkS in your last post @340. If you want to improve the post and get people to do it, because you are convinced of being correct regarding the "faulty and baseless treatment", you need to be more convincing, maybe even do a selective rewrite for consideration."
The post should be rewritten using Ted Trainer's conclusions, which are credible. Subsequently, SkS should indicate that nuclear power can allow a decarbonised energy supply when it is used rather than fossil fuels, such as explained by Barry Brooks in the above link.
Thank you,
Joris
-
JvD at 19:18 PM on 20 March 2013A Detailed Look at Renewable Baseload Energy
"What is your alternative scenario (to 100% renewables)? What alternative scenario do the sources you cite offer (quoting Ted Turner from that blog you cited: "It is also my view that we should transition to full dependence on renewables as soon as possible…although this will not be possible in a consumer-capitalist society.") ?"
Ted Trainer does not include nuclear power in his assessments, which is why he concludes that we must move to a 'simpler way'. That is: economic collapse. As is happens, there is a good article that discusses how Ted Trainer's research conclusions would change if the nuclear option was added. I'm going to present the following paper as a good description of my 'alternative scenario'. In my scenario, economic collapse is not a feature, but something that is successfully avoided without harm to the environment.
-
JvD at 19:12 PM on 20 March 2013A Detailed Look at Renewable Baseload Energy
"IMHO, your arguments did appear a bit unfocussed, and you moved the goalpost throughout the discussion and addressed few of the questions posed to you to understand the background assumptions you seemed to make."
IMHO i moved no goalposts and addressed all relevant questions. Note that I was asked four individual times to point to scientific literature before it was acknowledged that I had in fact provided such. It is difficult for me to understand why now I am the one ignoring questions.
By 'moving goalposts throughout', if you mean that I excluded war-zones from suitable sites to build nuclear power plants, then I must dismiss this criticism as simply being argumentative. For that matter, in a war-zone, wind farms and solar farms will also not likely be built. Arguably, wind farms and solar farms less suitable, because micro nuclear power can be trucked-in to provide power where it is needed, whereas solar and wind farms are fixed location assets that are extremely vulnerable to small weapons fire and sabotage.
-
JvD at 19:07 PM on 20 March 2013A Detailed Look at Renewable Baseload Energy
"As you cited only 1-2 sources though, I wonder what makes you think the contents of these are superior to what others have written?"
In the sources I mentioned, numerous additional sources are mentioned in the references. This is normal science, i.e. reading scientific literature rather that suggesting it's not there. Normal science also shows you can't run an aluminium smelter (24-hour operation) using solar or wind power (intermittent). Therefore, it is up to the deniers of this common knowledge to come up with research that shows aluminium smelters *can* be run on solar power. Instead, all I see is handwaving and references to pumped storage. However, pumped storage is far to small to help in providing storage for a 100% intermittent renewables scenario. There just aren't enough sites to built pumped storage. -
JvD at 19:03 PM on 20 March 2013A Detailed Look at Renewable Baseload Energy
"One obvious one is that, on the long term, there is only so much uranium on the planet, so very large scale nuclear generation using that as a fuel has the same basic problem as fossil fuels, GW notwithstanding. The other is that the same very large scale (global) generation will multiply the problem of waste which I already stated I wasn't so sure we handle well. "
This is a popular myth produced by fossil fuel pushers. It needs to be stamped out for there to be any kind of serious discussion about stopping AGW economically. Nuclear waste handling is far easier than handling co2, nox, sox and heavy metal waste from alternative energy sources. Even solar power and wind power produce waste. For example, the solar and wind farms built in the USA in the 20th century were never decommissioned and still sit there rusting and leaking heavy metals into the ground water. Presumably, modern windfarm and solar farms will also rust and leak after they are broken or after subsidies stop. This is not speculation, but demonstrated by history. In OECD countries, nuclear waste was always handled, has hurt noone and poluted nothing. Strong indication that we know how to handle it.http://www.mcgill.ca/files/gec3/NuclearFissionFuelisInexhaustibleIEEE.pdf
-
John Russell at 18:35 PM on 20 March 2013David Rose Hides the Rise in Global Warming
@SCM
Actually this was the first of two complementary (note: with an 'e' not with an 'i') articles written by David Rose and published by the Mail on the same day. This is 'No 2'. 'No 1' sets up the con that justifies No 2.
As to whether these are a continuing series: based on both the Mail's and Rose's history to date, I fear so.

Prev 967 968 969 970 971 972 973 974 975 976 977 978 979 980 981 982 Next


