


 Arguments


Recent Comments
Prev 967 968 969 970 971 972 973 974 975 976 977 978 979 980 981 982 Next
Comments 48701 to 48750:
-
chriskoz at 20:05 PM on 11 February 20132013 SkS Weekly Digest #6
AU env minister Tony Burke approves huge gas and coal plans news just came out. "This is a black day for the environment in NSW", a statement I tend to agree with. Apparently, those projects will increase AU CO2 footprint by 8% which will no doubt push AU back to the first place in per capita emissions. Note that Tony Burke represents the federal Labor govs, so those who introduced CTax a year ago and who are supposed to care. Apparently, still, they cannot resist the presure of coal/fracking industry...
-
ChrisJJ at 20:04 PM on 11 February 2013The Great Disconnect: the human disease of which climate change is but one symptom
This is a great article. It has been criticised by some commenters for not being scientific enough. Well, OK, but it does highlight some of the reasons why it's difficult to explain scientific concepts to ordinary, everyday people.
There is a general malaise in society today, and this article points very clearly to the reason for it.
I think I might summarise these ideas on my own blog and link to this article. More people need to read it and give it serious thought.
Thanks for publishing it here.
-
Tristan at 19:52 PM on 11 February 201316 years - Update and Frequently Asked Questions
Without a winking smiley or other blatant display of humor, it is impossible to create a parody of fundamentalism that someone won't mistake for the real thing.I thought the bathysphere comment would be enough, but apparently not. -
chriskoz at 19:23 PM on 11 February 2013Announcing the Skeptical Science Glossary
Term lookup dropdown does not seem to be very useful. What is is supposed to be? An autocomplete? If so, it misses some terms. E.g. a dictionary term "AR4" is missing. Even if I type it and invoke it with "Define" button, and then try to look for it again in the list (in case the list is supposed to be updated with my browser chache) it's still not there. Also the list is not scrollable. My browser: FF 18.0.2
Don't get me wrong: awesome work guys. Just this little semi-baked list list bugs me, as
I don't understand its purpose and how it works. -
Tom Curtis at 19:05 PM on 11 February 201316 years - Update and Frequently Asked Questions
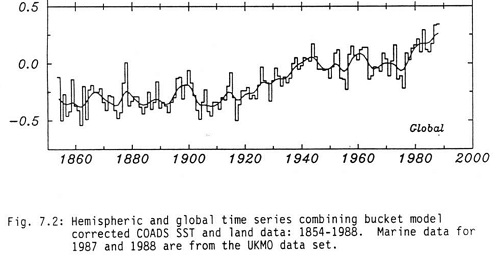
Tristan @15, it is difficult to imagine how you could think that a ship, entering new water at 4 knots or higher could warm that water significantly before it was measured after being collected from in a bucket thrown from the bow. Regardless, buckets show a cool bias, particularly canvass buckets, with evaporation cooling the water in the bucket prior to measurement. It is true that direct instrumental measurements in engine intakes show a warm bias of about 0.1 C, but great effort has gone into measuring that (and bucket) bias, and correcting for it.
That, apparently means noting for you. In fact, your comment looks like nothing more, to me, than a mere assertion that you don't like the facts, with a tissue of excuse as to why you choose to ignore them.
-
Dikran Marsupial at 19:01 PM on 11 February 201316 years - Update and Frequently Asked Questions
Habilus you do know, don't you, that "no statistically significant warming for 16 years" does not mean that there has been no warming for 16 years?
It just means (loosely speaking) that we can't rule out the possibility that it hasn't warmed during the last 16 years. If you read the BBC interview, you will find that Prof. Jones clearly understands this, and is perfectly happy to say that the (cherry picked) trend wasn't significant, because he understands why that isn't actually all that surprising (the time span is short, so the power of the test is fairly low).
-
Tom Curtis at 18:57 PM on 11 February 201316 years - Update and Frequently Asked Questions
I have been trying to follow up on Habilus' (@8) claim that the Met Office asserted that the globe had coolled by 0.5 C degrees between 1940 and 1970. I have been unable to track down any such claim. What I have found is the global land temperature record, as determined Mitchell, 1961:

(Source)
That shows just less than a 0.3 C degree fall between the 1940s and the 1960s; but is a land only record and so covers only 30 percent of the globe.
The earliest attempt at a true global, land-ocean temperature record I can find is Farmer 1989, which shows a decline of just over 0.1 C:
Indeed, the only early record showing a 0.5 C decline over that interval is from figure 7.6 (a) of the IPCC FAR, WG1, Chapter 7 (1990). That, however, shows only Northern Hemisphere, land only temperatures.
Giving the Habilus the benefit of the doubt, and assume his distant memories, unbacked by physical evidence, are correct; and that for a brief period the met office showed a greater decline in temperature from 1940 to 1970 than the scientific evidence supported before, or after. But even with this improbable assumption, Habilus can give us no reason why this brief revision showed the naked truth, which later revisions have corrupted.
-
Kevin C at 17:46 PM on 11 February 201316 years - Update and Frequently Asked Questions
I have one focussed interest in the sociology of science denial (DK alert - no formal sociology education), which is whether it is possible to identify scientific skepticism from science denial by the form of the arguments alone without even examining the content. I think it often is. In ortherwords, is there a 'fingerprint' we can use to identify science denial? Habilus' comment is a good case study.
First, we have to understand the difference between scientific skepticism and science denial:
- Scientific skepticism is knowledge seeking - it raises arguments with the aim of testing and/or correcting hypotheses in order to improve their correspondence to reality.
- Science denial is knowledge avoiding - it seeks to reassure the speaker and convince hearers that a hypothesis may be rejected in order to defend the speaker's worldview from inconvenient evidence.
Now, the point of the video is that 'warming' and the 'human contribution to warming' are two different things, and that a change in one is not necessarily evidence for a change in the other.
Habilus' response is to reassert a change in the rate of warming, which the video doesn't dispute. (S/he also relies on appeals to authority rather than data, thus showing a predisposition to social rather than evidence based reasoning, and falls for the null hypothesis fallacy). I think this demonstrates my point.
This raises an interesting possibility: Whenever someone makes an argument which has the fingerprints of science denial, don't engage with the argument - by doing so you are validating their position. Point out the structure of their argument.
-
jyyh at 15:51 PM on 11 February 2013Announcing the Skeptical Science Glossary
SSW (Sudden Stratospheric Warming) seems to even have a wikipedia article http://en.wikipedia.org/wiki/Sudden_stratospheric_warming
then there are other interactions (Stratosphere-Troposphere Exchanges aka) STE (an early summary article on the subject: http://www.ems.psu.edu/~brune/m465/strattropdynholton.pdf)
-
Lanfear at 15:25 PM on 11 February 2013Announcing the Skeptical Science Glossary
I would suggest putting the 'close all' at the top of the list. As it is now (FF18.0.1 Win7), if I have more than a screenful (my resolution is 1920x1200) of those definitions open, then I'm forced to close them individually until the 'close all' becomes visible again.
I also concur with llewelly that there should be a brief delay before popping the definition up.
-
jyyh at 14:32 PM on 11 February 2013Announcing the Skeptical Science Glossary
SSW (Sudden Stratospheric Warming) but as this is also south of southwest it might pose difficulties. ONI (forgot this was Oceanic Nino Index, but there are more Indexes describing aspcets of ENSO, such as MEI, SOI, so I'd leave it to readers to do the 10 second googling ( ONI + climate ) to find some of the acronyms out.
-
jyyh at 14:26 PM on 11 February 2013Announcing the Skeptical Science Glossary
Great feature, I might add. :-). AABW, ONI, IOD, SSW. (testing)
-
jyyh at 14:20 PM on 11 February 2013Announcing the Skeptical Science Glossary
Just learned that PIOMAS = Pan-arctic Ice-Ocean Modeling and Assimilation System, i.e. the model that assimilates the sparse ice thickness data from north of the 45°N latitude (to fully include Hudson Bay, and northern parts of the Black Sea that may also freeze, I guess) and creates a physically consistent (not necessarily fully accurate) dataset of artcic sea ice thickness data. partially gridded dataset available f.e. here. http://dosbat.blogspot.fi/2013/02/piomas-volume-thickness-breakdowns.html , there is also a fully gridded set of data somewhere.
As this is a hot topic at Neven's I suggest including the Acronym.
-
Rob Honeycutt at 13:13 PM on 11 February 201316 years - Update and Frequently Asked Questions
You know, I just remembered something another climate change denier pointed out a few months ago. I don't think I could find it again, but it was a newspaper story from the 1970's that showed "Met Office data" from mid-century. The diagram, indeed showed a ~0.5C drop in temps during that time period. But the graph was obviously not directly plotted from Met data but was a graphical representation done by someone at the newspaper (as far as I could tell).
What I believe was going on with that graph was, the artist misinterpreted -0.05C (which is what the data now shows) for -0.5C.
-
Tristan at 13:04 PM on 11 February 201316 years - Update and Frequently Asked Questions
The bucket data shows a spurious warming trend due to the ships heating the water arund them. The only data I accept is from bathyspheres.
-
JasonB at 12:55 PM on 11 February 201316 years - Update and Frequently Asked Questions
Even ignoring the basic confusion and accidental mixing of fake skeptic memes, there's something even more fundamentally wrong with Habilus' comment.
Apparently science is not allowed to progress.
Even if, for the sake of argument, he was actually correct about what the Met office was saying back in the 70s, what he's basically objecting to is the Met office doing additional work that allows a more accurate figure to be determined.
Let's just take one issue, for example — the sea surface temperature measurements. After WWII, there was a sudden increase in the number of temperature measurements being recorded by British ships, using buckets dropped over the sides of ships, which leads to a cooler temperature reading than what would be measured by engine intakes, the dominant method before then. This leads to a sudden and artificial drop in SSTs, causing a pronounced dip in global temperature reconstructions of that period.
HadCRUT4 now tries to correct for that effect, and the result is that the dip is a lot less pronounced than it was before.
According to Habilus, advancing the science to make the historical temperatures more accurate is simply to "conveniently" iron out a dip that for unnamed reasons was "inconvenient" in the first place. Apparently.
I suppose disco was the pinnacle of music as well.
-
llewelly at 12:20 PM on 11 February 20132013 SkS Weekly Digest #6
Please require the cursor to hover over the term for a longer period of time before popping up the definition.
As it is, when I scroll through a comment section looking for a comment, every time a term passes under my cursor, a definition pops up, however fast I am scrolling. This results in a lot of pop ups, which obscure what I'm trying to read. (It's a great idea, but I am already quite familiar with most of the definitions.)
(I see this behavior with FF 18.02 on debian gnu/linux 6.0.6 and OS X 10.7.5) -
Bob Loblaw at 12:01 PM on 11 February 201316 years - Update and Frequently Asked Questions
What was Phil Jones up to "back in the seventies"? Not sure. The first major paper of his looking at the temperature record that I'm aware is the 1982 paper that looked at northern hemisphere record:
Variations in Surface Air Temperatures: Part 1. Northern Hemisphere, 1881–1980
I've linked the abstract, and the pdf link for the full paper on that page is not paywalled.
Note that to maximize the "drop" in that record, you have to pick 1940 as the start year, just as fake skeptics keep picking 1998 these days. Spikes in the record - the gift that keeps on giving...
Methinks that Habilus is mixing up a whole bunch of fake skeptic memes:
- They predicted an ice age in the 1970s
- UK Met Office is bad (aka Climategate and the CRU hack)
Just what were you paying attention to in the '70s, Habilus?
-
Tom Curtis at 11:40 AM on 11 February 201316 years - Update and Frequently Asked Questions
... but presto magico, he still gets to have an opinion - and to think it is worth something.
-
Rob Honeycutt at 11:14 AM on 11 February 201316 years - Update and Frequently Asked Questions
Habilus... Please note that James Hansen works for NASA's Goddard Institute of Space Studies (GISS) not the Met Office.
It seems you're confused on quite a number of points.
-
Rob Honeycutt at 11:11 AM on 11 February 201316 years - Update and Frequently Asked Questions
Habilus... You're going to have to provide a reference to the statement that Met office claimed -0.5C from 1940-1970, otherwise your statement has no credibility.
And it was not Hansen that made the statement about statistically significant warming, it was Phil Jones of the CRU. And he stated that there was warming of 0.12C/decade but the time frame that was in question fell just short of statistically significant. The transcript from the interview can be viewed here.
-
Habilus at 10:55 AM on 11 February 201316 years - Update and Frequently Asked Questions
My apologies, Dr. Hansen claimed no warming for 10 years, not 16.
-
Habilus at 10:45 AM on 11 February 201316 years - Update and Frequently Asked Questions
For those of us who were alive and paying attention back in the seventies, the Met office claimed a -0.5C drop in temperatures from ~1940 to 1970. I see they've conviently ironed that out.
Besides, it was the progenitor of this very data, James Hansen, who claimed "no statistically signifigant warming" for the last 16 years. But presto magico, now we have warming again.
-
MattJ at 10:38 AM on 11 February 20132013 SkS Weekly News Roundup #6
Is there a mistake in the wording of the headline/article? I cannot for the life of me understand how cutting allowed carbon emissions even more is supposed to encourage electric utilities to comply. If anything, it would give them incentives to defeat all legal proposals to make them pay for the externalities of their industry -- something they have already shown themselves very good at doing.
-
SoundOff at 08:32 AM on 11 February 2013Announcing the Skeptical Science Glossary
Great feature. If you could spellcheck and proofread the glossary definitions they’d be even greater.
The glossary says under AR4: “Th 2nd report - Second Assessement Report (or SAR) released in 1966.”
Moderator Response: [Sph] Fixed.Thanks. -
Alexandre at 06:34 AM on 11 February 2013Announcing the Skeptical Science Glossary
Congratulations, guys! SkS became the ultimate tool for the layman to understand climate change science. Only those determined NOT to understand it will remain in ignorance now.
-
william5331 at 05:14 AM on 11 February 20132013 SkS Weekly News Roundup #6
The Arctic Hurricane of Aug6 (right on the border between a Cat2 and Cat3) may be absolved as the cause of the incredible ice melt but such storms do not only "churn up" the arctic water. A counter clockwise rotating air system induces similar counter clockwise currents in surface water. Coriolis shunts moving water to the right; that is to say, away from the centre of the storm. The only source of water I can see to replace this outflowing water is from the deeper, warmer, saltier water which lies under the surface water. In addition, the larger the surface waves induced, the larger the internal waves between water layers of different densities. These waves, presumably break when they reach shallow water, just as surface waves do, Except instead of mixing air and water (surface waves) they mix the layers of different densities. I think it might be a little early to absolve hurricanes of causing accelerated melting.
-
Tristan at 01:35 AM on 11 February 201316 years - Update and Frequently Asked Questions
Thanks for the enlightenment! Much appreciated :) Looking forward to your future posts.
-
Kevin C at 01:32 AM on 11 February 201316 years - Update and Frequently Asked Questions
Tristan: On the satellite record, I'm afraid that's beyond my expertise. Glenn and Rob have done articles here and here which you may already have seen.
On coverage, GISS is close enough to global (>98%). The recent BEST memo from Robert Rhode suggests their informal method of extrapolation gives results which are pretty close to optimal. Look for my JMA post later in the week which adds a couple more details, and hopefully a fuller treatment later in the year.
-
Tristan at 01:19 AM on 11 February 201316 years - Update and Frequently Asked Questions
Two questions for Kevin
1) What do you make of the disparities between the RSS, UAH and STAR interpretations of the satellite records? Is some sort of reconciliation in the future or will this be an issue for the foreseeable future?
2) Do you think we will get satisfactory 100% coverage from GISS any time soon, via more data or better algorithms?
-
Tristan at 00:35 AM on 11 February 201316 years - Update and Frequently Asked Questions
I'm lookin forward to Kevin's followup video in 2029 refuting the 'no warming since 2014' claim.
-
Kevin C at 00:28 AM on 11 February 201316 years - Update and Frequently Asked Questions
Thanks for the comments!
John: Real Climate have an update to the F&R results here. By chance I did the same calculation using Foster's released code a couple of weeks back, with the same results.
HR: I'm slowly working towards producing what I hope to be the best possible estimate of short term trends and their attibution - what you've seen here is just a part of that work. As the uncertainties are narrowed down the underlying trend will probably become more significant, but at the same time any genuine change in trend (which is scientifically interesting) will also become more significant.
The uncertainty in the volcanic+solar lag term is currently the biggest issue, which is why the 35 year calc is unsatisfactorary. I think I am addressing a real issue with the F&R calc, but I am pretty sure my solution is suboptimal. I can't currently claim with any certainty that my results are closer than theirs.
However the 2-box model is also unsatisfactorary, because the uncertain human forcings have a far bigger role in determining the response function than the volcanic term. The fact that it gives similar conclusions is reassuring, but inconclusive.
That's why I think a hybrid method is needed, rather than the 2-box model in it's current form. I'd be very happy if someone else was inspired to look at this.
In the mean time, I posted 2-box model graphs with just enso subtracted, and with enso+volcano+solar subtracted here which give you some idea of what the plots would look like.
-
John Brookes at 18:00 PM on 10 February 201316 years - Update and Frequently Asked Questions
Thanks! A very nice explanation. Its easy to see that multivariate linear regression is very much susceptible to abuse, and so the number of variables must be limited to those most likely to effect the result.
I'm looking forward to the extension of the Foster Ramsdorf graph as the future unfolds.
-
rockytom at 15:22 PM on 10 February 2013Introducing the History of Climate Change Science
DB, the URL for Dr. Weart's timeline is as follows: http://www.aip.org/history/climate/timeline.htm
Moderator Response: [DB] Thanks! Updated link. -
mbryson at 13:15 PM on 10 February 2013An Updated Look at What Keystone XL and Alberta Tar Sands Mean for the Climate
I think the problem with XL is the implicit commitment it represents, that we will indeed burn whatever we can extract. The tar sands are an expensive, dirty source of oil, and even burning all the conventional oil we can extract has devastating implications for our climate and oceans. Since XL's construction will support continued expansion (and increased profitiability) for the tar sands, it's a step down the wrong path. Even if all it does is replace other sources of oil in the short run, in the long run it implies burning more fossil fuels rather than beginning the transition to much greater efficiency and a low-carbon energy economy.
-
Spencer Weart at 12:36 PM on 10 February 2013Introducing the History of Climate Change Science
Thanks for the reference to my timeline ...It's just been updated to 2012, with links to the full historical discussions.
Moderator Response: [DB] Fixed link. -
PhilipR at 10:14 AM on 10 February 2013For Psychology Research, Climate Denial is the Gift that Keeps on Giving
This is truly a wonderful article and a hugely enjoyable set of responses in the comments section. It's refreshing when you live as a foreigner in the United States to see that critical thinking is alive and well elsewhere in the world.
Which brings me to the bigger problem that I think is the root of the issue both with science in general and climate science in particular. That is the assault upon the impartiality and the credibility of science as a methodology and tool for problem solving. For me the origins of this issue go back to the tobacco 'debate' but I'm sure it's roots go much further. What was done in the name of free speech and the freedom to pursue corporate interests was that the tobacco industry was allowed to call into question the findings of the medical establishment vis a vis lung cancer, stroke, emphysema etc. By commissioning bogus or bad science for the express purpose of contradicting or casting doubt upon legitimate science and redirecting public policy in a direction that was more favorable to the industry.
Fast forward to the new millennium and the same successful tactic is rampant across the board for all areas of public policy and science, with the most critical being environmental protection, energy policy and obviously climate science. The honestly dishonest skeptics may be a thorn in your side but the mischief makers: those who are not skeptical at all merely hell bent on destroying the credibility of scientists and arguments that contravene a pre-existing agenda, are the greater issue.
Conspiracy ideation in relation to lung cancer was created and actively fostered by an industry intent on avoiding regulation. Similar skuldugerry is now so widespread that the term 'astro turf' which is in common parlance describes a fake grass roots movement created solely to oppose genuine social unrest. It's great to be able to find a tool to rebuff the hysterical as well as the commentators, bloggers and climate deniers but these are simply zombies created to cast doubt where no doubt exists, to tie up resources and time in rebuffing what is nonsense and to sap the credibility of those rasing the alarm.
It's one of the sadder aspects of the present climate debate that those on the side of science and truth hold themselves aloof to conspiracy regarding the other side as simply ignorant and misguided. Whilst they themselves remain hopelessly naive and blind to the real agenda of people who are anything but.
-
Jose_X at 09:35 AM on 10 February 2013An Updated Look at What Keystone XL and Alberta Tar Sands Mean for the Climate
Dana, thanks for this article. I don't know what are the total long term carbon and environmental costs to starting new infrastructure that Andy Skuce (#16) spoke about for the case of tar sand, but generally your data shows that XL will have a very small negative carbon impact since what counts otherwise are marginal costs (1/700 of total consumption based on your observation).
It seems that whether XL gets added or not is not that important from the global warming perspective. More important is what jyushchyshyn (#1) mentioned about consumers changing habits, but this is only realistic I think if government takes steps like raising taxes, eg, like MartinG (#2) mentioned, in order to cover total costs to society from fuel processing.
See, just like Shell drilling up north, if you give a limited trial offer to industry, give them a bone and an opportunity to prove themselves, and then require that externalities be covered in the costs/tax (and threaten legal action if they screw up), then you can keep that new exploration limited and force safety and efficiency innovation on the part of industry. If industry sees a chance, they have incentive to try and innovate or abandon the effort if it proves too costly. And if pipelines are the most efficient transports, forcing other ways may create more harm than good.
A real victory might be to accept XL conditionally on taxes being raised to help fight global warming costs and other environmental costs. This can be asked of Congress. A precedent can be established to make it easier to later address real costs to all the areas mentioned by Andy Skuce. Allow the pipeline if its full costs are included today -- a future generation carbon defrayal tax -- think of the (great great grand) children!. With higher costs, consumers are more likely to change habits.
We have to keep perspective on XL or we lose people in the middle who can rationalize. XL doesn't seem to add that much harm from a global warming perspective. It can serve as an opportunity to add taxes or gain something else that can have a real positive impact that far exceeds the tiny marginal impact of XL.
And if the XL costs are high in other environmental areas (something being addressed), then that should be the argument. -
HumanityRules at 07:22 AM on 10 February 201316 years - Update and Frequently Asked Questions
Thanks. Sorry I know people always want more. Since the Ramsdorf method was publshed I've been curious what the longer term data looked like. Fig 4 is interesting but is there any chance you can show the breakdown of the different forcings that go into making that, similar to Fig2 for the shorter time period. I'm curious what the long run of La Nina in the mid-20th century are doing and what the anthro contribution over the whole century looks like.
Cheers
-
Bob Loblaw at 01:58 AM on 10 February 2013Introducing the History of Climate Change Science
Shoyemore:
Slightly before Manabe and Wetherald (1967) came Manabe and Strickler (1964). The '64 model assumed constant absolute humidity for its scenarios, whereas the '67 paper used relative humidity.
What I think is a free version of the '67 paper is here.
Ditto for the '64 paper here (abstract at the journal, but there is a link to the PDF that doesn't seem to be paywalled).
Moderator Response: [DB] Updated the link to the 1967 paper to an openly-available copy. -
shoyemore at 19:42 PM on 9 February 2013Introducing the History of Climate Change Science
I often get the "climatology is not a mature science" trope from fake-sceptics, and posts like this are important for rebutting it.
If I could assign a moment when climaet science became "mature", it would be Manabe & Wetherald's 1967 model of the Earth's climate, the first radiative-convective model. Before that, you have individual giants like Arrhenius, Plass and Keeling but after the 1960s, everything starts to coalesce in theory and methodologies. Stephen Schneider's memoir Science as a Contact Sport is an excellent personal view of subsequent history.
To draw an analogy, while Arrhenius was investigating CO2, Henri Becquerel was investigating radioactivity. Only 40 to 50 years or so separated Becquerel (and other giants like Rutherford) from the discovery of nuclear fission and the atomic bomb, which can be looked upon as moment nuclear physics matured.
Climate science took a bit longer, but not inordinately so.
-
Doug Hutcheson at 17:10 PM on 9 February 2013Introducing the History of Climate Change Science
The graphic showing events along the historical time-line of understanding AGW, will be a valuable resource to point to when rebutting the contrarian 'climate science is immature' meme. Nice work.
-
Doug Hutcheson at 16:56 PM on 9 February 2013An Updated Look at What Keystone XL and Alberta Tar Sands Mean for the Climate
It's time for the USA to take a climate leadership role
What a difference it would make, if only they would exercise the global leadership they are so fond of talking about.
-
JasonB at 13:48 PM on 9 February 2013Temp record is unreliable
scaddenp is correct. Most of the historical changes that have introduced inhomogeneities into the temperature record have tended to cause recorded temperatures to suddenly go down. Station moves from built-up locations to more rural locations (e.g. Darwin, Port Hedland); switching to Stephenson screens; changing Time of Observation; changing the method sea surface temperatures were recorded after WWII; heck, in the very earliest part of the Central England Temperature record, the temperatures are not comparable because the thermometers were placed inside to avoid having to go out in the cold to read them!
So we should expect corrections to often be increasing recent temperatures or decreasing older temperatues as we become more able to isolate and correct for various effects.
However, suppose that in spite of the facts:
- That these effects have actually been measured in order to create formulas to correct for them.
- That GISS has been releasing all source code and data for years, and publishing all algorithms in the peer-reviewed literature for decades, and independent groups have replicated their results, and not one single fake sceptic has ever published a criticism of any of the algorithms used.
- That using raw data, and even tiny subsets of the raw data, gives almost identical results.
In spite of all those facts, you just don't trust any form of correction? Not because you can actually identify anything wrong in all that publicly-available information, but just because your gut tells you it must be so?
Well, in that case you can completely avoid all corrections by simply detecting when a discontinuity in a temperature station's record occurs, and then simply break the record in two at that point. Pretend it's actually two completely different records, and make no effort to quantify the effect of the discontinuity so that you can correct for it.
What do you get then? Why, BEST of course!
And guess which land-only temperature series has the highest trend?
-
John Brookes at 13:08 PM on 9 February 2013For Psychology Research, Climate Denial is the Gift that Keeps on Giving
fydijkstra makes a very good point. Each side in this issue sees the other as denying reality. Of course we know that is just projection on their part :-)
But its now impossible for "skeptics" to change their minds. When you start from the position that scientists are lying and have falsified the temperature record, then no amount of information (just more lies) will change your mind.
Scientists just need to keep trying to do the best they can to further our understanding of climate. And their peers need to keep being tough on them, keeping them honest.
The "skeptics" can be ignored.
-
scaddenp at 12:06 PM on 9 February 2013Temp record is unreliable
I think the expectation that adjustments should be even is also misplaced. If you want to compare temperature measurements mad today with measurement taken in the morning, against same station but temperature done in afternoon, then you have to move past temperature down. Its a change of practise. Likewise, comparing modern screened electronic thermometer against past unscreened and glass thermometer also require past to be adjusted down.
I would certainly not expect any of the temperature records to be beyond improvement. Its a case of methodology advancement and available funding. What is also clear though is that you cant blame GW on adjustments.
-
Tony O at 11:32 AM on 9 February 2013An Updated Look at What Keystone XL and Alberta Tar Sands Mean for the Climate
If we are to have a chance of saving any sort of world that we can live in, then we need to stop all these new projects. If we fail to stop the XL pipeline shipping this dirtiest of oils to the world then we are in very deep trouble.
To those campaining and demonstrating I salute you.
-
Tom Curtis at 08:41 AM on 9 February 2013Temp record is unreliable
Kevin @253 claims:
" ...a 10% adjustment is rather large, considerring everyone "thought" the data was correct before the adjustment."
In fact, if you look at the SkS trend Calculator you will see that the trend for Gistemp is 0.064 C per decade +/- 0.007 C per decade (11%). So his point is that the temperture record is not as accurate as advertized because a change smaller than the advertized accuracy has been made.
Even more bizzare is claim that:
"I don't have enough info regarding the algorithm to say anything more about it, except the general observation, again, that the chances of all the adjustments being on "the correct side of the belief paradine" can't be 100%"
It has been already established that the change in gistemp is primarilly because of changes in the Global Historical Climate Network, whose algorithim Kevin claims ignorance of. Here are the actual adjustments from raw data made by that algorithm:

(Note: Darwin is highlighted because it comes from a discussion of a frequent denier cherry pick used to suggest the GHCN adjustments are wrong.)
The key point for this discussion is that the adjustments are not 99% in one direction. They are very close to being 50/50. In another discussion of adjustment bias, it was found that the mean adjustment of 0.017 degrees C/decade. This data is for the GHCNv2 rather than v3, but no doubt the statistics of the later will be similar.
-
Ken in Oz at 06:56 AM on 9 February 2013The Great Disconnect: the human disease of which climate change is but one symptom
I have to agree with the author - there is a fundamental disconnect between commercial decision making and science based - or even common sense based - understanding of the interconnectedness of people and the environment. Commercial decision making is about costs, competitiveness and profitability. There are legal obligations but limited ethical ones. There is no innate ethical framework there that requires deferring to science based reality. Climate policy, assessed in light of the commercial implications, is seen as imposing a burden of costs and regulations via government policy. Government policy is something seen as amenable to influence using familiar tools - lobbying, tankthink, PR and advertising, mostly focusing on and exacerbating economic hopes and fears. There is no requirement to defer to science or even to be fair minded or even truthful in the use of those tools of influence. In many respects what they are doing is no more than would be expected of them. But our elected representatives and community's leaders work within a framework where science based reality and truthfulness about it should not be dismissed or ignored. Commerce is doing what commerce does, but politics is letting us down. Politicians who act as the political voices of commerce, above the wider, longer term interests of their constituents have given opposition to action on climate a respectability and legitimacy it otherwise wouldn't have.
-
tlitb1 at 06:36 AM on 9 February 2013The Great Disconnect: the human disease of which climate change is but one symptom
BTW. To the some who question the benefit of cities may I suggest some resource material?
http://www.newscientist.com/article/dn16819-city-dwellers-harm-climate-less.html http://www.scientificamerican.com/cities/
Prev 967 968 969 970 971 972 973 974 975 976 977 978 979 980 981 982 Next


