Climate Science Glossary

Term Lookup

Enter a term in the search box to find its definition.

Settings

Use the controls in the far right panel to increase or decrease the number of terms automatically displayed (or to completely turn that feature off).

Term Lookup

Settings


All IPCC definitions taken from Climate Change 2007: The Physical Science Basis. Working Group I Contribution to the Fourth Assessment Report of the Intergovernmental Panel on Climate Change, Annex I, Glossary, pp. 941-954. Cambridge University Press.

Home Arguments Software Resources Comments The Consensus Project Translations About Support

Bluesky Facebook LinkedIn Mastodon MeWe

Twitter YouTube RSS Posts RSS Comments Email Subscribe


Climate's changed before
It's the sun
It's not bad
There is no consensus
It's cooling
Models are unreliable
Temp record is unreliable
Animals and plants can adapt
It hasn't warmed since 1998
Antarctica is gaining ice
View All Arguments...


Username
Password
New? Register here
Forgot your password?

Latest Posts

Archives

Recent Comments

Prev  968  969  970  971  972  973  974  975  976  977  978  979  980  981  982  983  Next

Comments 48751 to 48800:

  1. A Glimpse at Our Possible Future Climate, Best to Worst Case Scenarios

    Photon Wrangler - very well put. I wonder if this is all the fault of Climate science. In days of old you could be green and environmentally friendly just out of a desire to  protect the environment and live in harmony with the earth. ( -snip- ).

    What if there is a real problem that we can do something about?. What if its not CO2 but something we havnt figured into the equation yet? ( -snip- ). And unfortunately the climate is so complex that all our models are rough guesses, probably lacking important factors not yet discovered, and with so many degrees of variables that we can get them to produce any result we want - the denialists picking the low side, and the warmers the high side.

    Thats not  science, and as the argument rages the public lose interest in the squabble - and then nobody gives a fig leaf about the environment any more. What if this polarised debate is misleading the public into apathy???

    Moderator Response: [DB] Off-topic snipped.
  2. A Glimpse at Our Possible Future Climate, Best to Worst Case Scenarios

    Agree with Andy @5 except 4.5 and 6 are roughly the same until 2040, not 2060.

  3. A Glimpse at Our Possible Future Climate, Best to Worst Case Scenarios

    mandas@ 4

    According to this paper:

    The four RCPs are based on multi-gas emission scenarios which were selected from the published literature (Fujino et al. 2006; Smith and Wigley 2006; Clarke et al. 2007; Riahi et al. 2007; van Vuuren et al. 2007; Hijioka et al. 2008; Wise et al. 2009) and updated for release as RCPs (Masui et al. 2011; Riahi et al. 2011; Thomson et al. 2011; van Vuuren et al. 2011b). Because they were produced by four different Integrated Assessment Models (IAMs), there are some inconsistencies in the relationships between emissions and concentrations that could complicate the interpretation of the climatic consequences of the four different scenarios.

    My eyeballing of the two middle pathways tells me that they are basically the same up to about 2060. After that the world either wakes up (4.5) or decides to leave no coal unburned (6.0), at least until 2100. Based on Figure 2, it appears that both of these pathways may be a little optimistic in the short and medium term if you project our current emissions trends.

  4. A Glimpse at Our Possible Future Climate, Best to Worst Case Scenarios

    Why is RCP 6 initially lower than RCP 4.5 (or even RCP 3)?

  5. Photon Wrangler at 09:56 AM on 14 February 2013
    A Glimpse at Our Possible Future Climate, Best to Worst Case Scenarios

    *macabre. 

    I love the new comment system, but it doesn't seem to support my Firefox spell checking, which I have become shamefully dependent on.  

  6. Photon Wrangler at 09:54 AM on 14 February 2013
    A Glimpse at Our Possible Future Climate, Best to Worst Case Scenarios

    ianw01,   I agree.   It's a bit mabre, I suppose, but I actually find myself hoping for drought, for heat waves, for a (even more) dramatic reduction of sea ice.    Anything to shock people out of complacency, so we can go about properly mitigating our risks.  

    But let's fast-forward 15 years:   N. America and Europe have been getting walloped by searing heat waves and drought, interspersed with periods of unprecendented rainfall, causing massive floods.  Summer sea ice has effectivly vanished.   The era of consequences is upon us.  Yet, everything the Deniers hold to be true still applies:

    - The earth has been this warm before (true)

    - You can't prove that any given meterolgical event is "caused" by climate change.(true)

    - It's possible that man is only contributing a small portion of the warming, the rest being caused by: solar flares, ocean turnover, gamma rays, HAARP, volcanoes, God, what have you (untrue, although that doesn't stop people from believing it today)

    - Any action we take today will not significanty affect the climate in ourlifetimes (true for just about anybody in their mid 30s -- look at the above charts)

    Not sure where you hail from, but in the States there are a not ignsignifact number of individuals who would tell you that God - and only God - can change the climate.  This worldview is deeply ingrained in many folks, and virtually impossible to dislodge.  Efforts to dislodge it will be met with ever more furvor.    

    As you said, we'll need a "motivated majority".    But unfortunately, it's hard to get motivated about taking actions that at best will yield tangible results in ~40 years.   Rolling back carbon taxes or raising emissions caps will always provide immediate economic relief, with the costs pushed out to generations you haven't met yet.   Humans are exceedingly good at falling into this kind of reasoning.  Just look at our public and private debt levels. 


    Man.  I really took a pessimistic turn there.   Maybe I shouldn't have skipped lunch.. 

  7. Lukewarmerism, a.k.a. Ignoring Inconvenient Evidence

    St Barnabas @30, your graph is interesting when compared to this one of ocean temperature with depth:

    (Source)

    The important fact here is that since about 2005, gain in OHC (and hence temperature) at 0-700 meters has been much reduced.  That has been largely compensated by increased gain at 700-2000 meters, such that the 0-2000 meter OHC gain has only reduced slightly.  The important point is that an equal gain in temperature at 700-2000 meters will result in a lesser expansion to the equivalent gain at 0-700 m due to the lower average temperature; and hence the switch in where heat is accumulating will result in a decceleration in the rise in sea level, even if there were no change in gain in OHC.

  8. A Glimpse at Our Possible Future Climate, Best to Worst Case Scenarios

    The more I think about these scenarios, the more I have come to believe that the most important factors will be the lag in the warming and short term variability.  

    As humans, we will continue to emit CO2 (doubling and beyond) until a motivated majority experiences or sees a real problem. Then real action will happen.  If short term variation and a big lag in the climate response combine to delay that human realization, the ultimate impacts will be that much bigger.

    So the real question is (a) when will there be NO doubt in the public's mind that serious action is needed? and (b) at that point how much warming will we already be committed to?

    The actual sensitivity is arguably a secondary issue.

  9. Lukewarmerism, a.k.a. Ignoring Inconvenient Evidence

    Dana
    Sorry I’ll try to be a bit clearer. I would have like a bit more time to look at the literature as it seems to me that sea level rise should be accelerating rather then being a fairly static 3.2 mm/y. Over the past decade there has been considerably accelerating ice melt – Greenland, glaciers Antarctica etc. I know that temporarily water can fall as rain dropping the sea level – but all the rivers run into the sea, why is it not rising faster.

    The substantive point is that sea level rise will depend on whether the heat goes into the top of the oceans or lower down. If the heat sticks near the surface the sea will normally rise a lot faster. (If there is a paper in this you heard it here first!) As you will be well aware there seems to be a lot more heat transfer to the lower ocean below 700m in the past few years, unless I have misunderstood. This would slow down sea level rise.

    The ocean cools as the deeper it gets. (normally anyway - The Med is well mixed below the thermocline and is a constant 15 degrees or so, but I understand the big oceans are  quite different).

    The thermal mechanism for sea level rise is driven by two constants Cp the specific heat capacity of seawater and Beta the thermal expansion coefficient. Heat is absorbed by seawater and the temperature rises.  As the temperature rises the water expands. So far so obvious, however both these terms are functions of salinity (typically about 35 ppt), pressure (depth) and of course temperature. In Practice Cp varies little with these parameters however Beta is very strongly temperature dependent and not very dependent on depth or salinity. It takes a lot more heat to expand cold water than hot. For fresh water Beta becomes zero at 4C and negative below that. Beta for seawater remains positive   right down to -2C where it freezes.

    I will try attaching a graph generated by using the seawater toolbox  (CSIRO, Nathan Bindoff 1993.) but essentially as water get hotter it expands faster.

    ThermalExpansion

    Moderator Response: [RH] Fixed image width.
  10. The Japan Meteorological Agency temperature record

    DB (Mod) is correct. I double posted my comment by accident by refreshing. There is no facility to delete or edit posts (which I fully understand on this blog given the abuse allowing this could invite). Can this behaviour not be turned off as I'm sure I'm not the only one to waste valuable mod's time?

    Moderator Response: [DB] I make a point of opening up a new window on the thread on which I comment, and then close it after commenting. Regular participants here follow the Recent Comments thread anyway, where all newly added comments appear.
  11. Lukewarmerism, a.k.a. Ignoring Inconvenient Evidence

    Jeffrey Davis at 03:09 AM on 13 February, 2013

    "Warming will continue as more CO2 is added to the atmosphere" - this is so right - Luke warmer, skeptic denier - who cares. They have to be ignored as even a 0.9 C increase is already affecting food production, flowering times, animal survival (not just food source species) etc - something has to be done. Dana - sensitivity is now over - its all downhill unless actions are taken.

  12. The Japan Meteorological Agency temperature record

    bratisla: Yes, I've krigged HadCRUT4, and am working on more interesting methods.

    Have a look at this article for a start, which used nearest neighbour - but the results are very similar.

    • If you krig HadCRUT3, you get something which looks like GISTEMP.
    • If you krig HadCRUT4, you get something which shows faster warming than GISTEMP, primarily because HadCRUT4 has the addition SST corrections.
  13. Announcing the Skeptical Science Glossary

    Would prefer the "Lookup a Term" lower screen tab to be located further to the left side of the screen- out of the way of the normal text scroll through 'reading' area.

    Otherwise a handy and useful new feature - thanks.

  14. OA not OK part 20: SUMMARY 2/2

    Susanne - I'll reply without using equations, but you really need to follow the equations to understand this in greater depth:

    1. The notion of akali and acid, as it pertains to ocean acidification, is irrelevant. Ocean acidification is the process of increasing the hydronium ion concentration in seawater (lowering pH). It has nothing to do with the concept of neutral pH. The oceans will very likely remain above a pH of 7 (neutral), but can still be highly corrosive to marine life that make their shells/skeletons (calcifiers) from calcium carbonate (chalk). If someone drags up the issue of neutrality, or acids and akali, you can be certain they don't understand the fundamentals and are probably playing the troll.

    2. The oceans become corrosive to marine calcifiers because increasing the atmospheric CO2 partial pressure forces more CO2 to dissove into the oceans and leads to a series of reactions which diminish the concentration (activity actually) of carbonate ions in seawater. These carbonate ions are one of the key building blocks of the calcium carbonate shell/skeleton. So, although pH (the concentration of hydronium ions) is critical for a number of biological chemical reactions, it's not lower pH per se that makes the oceans corrosive to marine calcifiers - it's the decline in carbonate ion activity. 

    3. Now on to buffering. The carbon chemistry of the oceans (the series of reactions between the various forms of carbon dissolved in seawater) means that the oceans buffer (act against) the lowering of pH. So yes the oceans are buffered to some extent. The equation in which a hydronium ion combines with carbonate to form bicarbonate is the one which buffers against ocean pH being even lower than it is, because the "extra" hydronium is no longer free in solution - it is now bound with the carbonate ion to form bicarbonate. If this reaction did not take place the hydronium concentration of seawater would be higher and, therefore pH lower. But this is the very same reaction which lowers the carbonate ion concentration in the oceans and makes them corrosive to marine calcifiers!

    4. Two other buffering mechanisms exist, but they operate on such long timescales that they are of no use to humanity, or the marine life put at threat by ocean acidification. One is the supply of alkalinity back to the oceans through the chemical weathering of silicate rocks through rainfall. And the other is the dissolution of carbonate sediments on the ocean floor when the oceans become corrosive. These both operate on 10-100,000-year timescales, so won't be of any use to us.

    5. This slow buffering is why the oceans became corrosive in Earth's past when CO2 increased in a geologically abrupt manner, but did not when the CO2 content of the atmosphere increased slowly, or was sustained at high levels for long geologic intervals   - the system is able to readjust and move itself back toward an ocean condition which is suitable for marine life through these buffering processes. Perhaps the best example of this are the White Cliffs of Dover. These are huge chalk deposits formed by coccoliths (microscopic marine life that build their shells from calcium carbonate) during the Cretaceous - a time of very high atmospheric CO2 and much warmer global temperature. Because there was no geologically-abrupt spike in CO2 the oceans did not become corrosive, despite the low pH.

    6. Perhaps the best way to skewer bogus claims about ocean acidification is show what is actually going on today - marine life is beginning to be eaten away by corrosive seawater. The pic below is of a pteropod (sea butterfly) captured from waters around Antarctica recently:


    The pic is from this peer-reviewed paper: Extensive dissolution of live pteropods in the Southern Ocean - Bednarsek (2012).

  15. Renewables can't provide baseload power

    curiousd @81 - use the Contact Us page.  John Cook will respond and then you can email him whatever you've written up.

  16. Renewables can't provide baseload power

    Question....Some time ago I received comments from folks at SKS that they might post a lead article by me on CO2 offset solar charities. Months have passed and I have interacted with  many such organizations plus found some interesting facts. For instance, largely due to "The Swanson Effect" (crystalline silicon solar cells are factor 35 cheaper than ~30 years ago) what used to be a charity is now likely a business, though a small one. Great news in most respects but bad news for innovators like Solyndra or concentrating solar projects such as Desertec, perhaps.  Developing country inhabitants can power and light their homes cheaper with solar than using kerosene or going onto  the grid. Now what should I do?  I can send something written up, but to whom, and in what form, and what happens after that? 

  17. OA not OK part 20: SUMMARY 2/2

    I think I've just bumped into one of the concepts this series "skips lightly over", and I'm hoping you will kindly help me to crawl around it. The concept is buffer theory, and the reason I only think it's my obstacle is that I encountered it in this "simple description" of the ocean's importance for climate, written by an oceanographer:

    "...it is also clear that the ocean’s capacity for carbon dioxide is limited, as indicated by its increasing acidity. This is most extraordinary since the ocean has always been considered to be strongly buffered against acids and alkalis alike;"

    To me, a buffer is a space that separates two things for safety, as in "buffer zone" or a buffer in a schedule. After a bit of googling around I'm guessing in chemistry it's a process rather than a space and that buffer theory spells out how buffering mechanisms (mechanisms?) work. I also suspect it's such a fundamental concept that even a simple explanation requires a boatload of technical terminology, but I hope I'm  wrong about that.

    FYI the simple description is being written for a regular "climate column" we're doing for our local newspaper. Our readers' assumed level of knowledge is about year 8 school science 40 years ago. It's a great opportunity, but it would be very easy to scare the editor, never mind the readers.

    I'm not asking you to write to the level we're aiming for, but I'd be very grateful for an explanation that makes sense to me when I'm translating for my oceanographer. Can you help?

    Thanks for the series and for this site.

  18. The Japan Meteorological Agency temperature record

    "Kriging" should be added to the Glossary.

  19. Lukewarmerism, a.k.a. Ignoring Inconvenient Evidence

    StBarnabas @27 - you are correct.  If you click the "extreme flooding" link in the OP at the end of the 2nd paragraph in the Lukewarm Escalator section, that goes to a post by Rob Painting about research showing that the short-term pause in sea level rise was primarily caused by large flooding events.

    I'm not sure I understand your question about thermal expansion though.

  20. Announcing the Skeptical Science Glossary

    Thanks for the replies - might it be an idea to make sure everyone understands how to do this?  I've re-enabled scripts, but as I have FF delete all cookies when I close it, I'll need to re-check 'No Definitions' every time I visit.

    Moderator Response: [Sph] The delay has been added.
  21. The Japan Meteorological Agency temperature record

    Kevin


    many thanks. I'm constantly amazed by how little I know. Strange that a lot of my students think I know everything! What is possibly more strange that I have found that people who know little or almost nothing seem to think they know  almost everything, or at least sufficient to make profound judgements on areas totally outside their often minimal expertise.If only I could think of a relavent example. :-)


    Moderator Response: [DB] As a general note: refreshing the same browser window after submitting a comment submits a duplicate of the first comment.
  22. The Japan Meteorological Agency temperature record

    Glad to see kriging gaining ground in Earth sciences, especially since Matheron was head of a department where I work now and still was able to produce several great geostatistic ideas (several of his notes are available I think)

    Just one question : did you try kriging on HadCRU4, to see what happened ?

  23. Lukewarmerism, a.k.a. Ignoring Inconvenient Evidence

    Dana


    Good post as ever. One query, my very simplistic understanding is that in La Nina years more heat is retained in the ocean cooling the surface and in La Nino years more oceanic heat is transferred to the atmosphere cooling the ocean slightly. I had understood the sealevel drop in 2010 was due to very wet weather over large continental masses shifting c 1cm of water from the ocean to the land.


    Of course the thermal expansion coefficient of water is temperature dependent and the mix of heat between the upper and lower ocean layers would cause an effect – I could easily do a calculation, but I suspect there are already many papers on this?


  24. Sea level rise predictions are exaggerated

    Kevin @22, unless serious efforts to reduce carbon emissions are in place soon, the temperature difference between the end of this century and now will be approximately that between the coldest period of the Last Glacial Maximum and the Holocene average.  That temperature difference was enough to cause a 100 meter rise in sea level in 8,000 years, the equivalent of a 12.5 mm per year rise.  Given that, a rise of  0.785 meters (increase of annual rate to average rate of deglaciation over the century), or 1 meter (increase to deglaciation rate over fifty years, and constant thereafter) are likely.

    Given that the Earth warmed gradually after the LGM so the actual differential in temperature during the last deglaciation was less than what we will experience, and given that periods of much faster melting occurred durring the last deglaciation, sea level rises of 2 meters are a distinct possibility.

  25. The Japan Meteorological Agency temperature record

    StBarnabas: I've used nearest neighbour, inverse distance and polyharmonic splines as well as kriging. The interesting thing is that, as long as you use a distance cutoff of 1000-1500km, they all give similar results to kriging. The temperature data is pretty well behaved and it doesn't much matter what you do with it. Robert Rhode in his recent BEST memo showed something similar - that the GISTEMP method (which is essentially a kernel smooth) comes close to kriging.

    The principle benefit of kriging in this case is that you don't need to set a distance cutoff - you get a global map which naturally reverts towards the global mean if you get too far away from an observation.

    In general kriging has some awesome properties. For example it gives you a proper area weighted mean almost by magic, and weights neighbours of a cell according to how much distinct information they add. Unlike BEST I'm losing some of the benefits by starting from the gridded data, but again for this problem it doesn't make much difference.

  26. Lukewarmerism, a.k.a. Ignoring Inconvenient Evidence

    Nick Palmer @ 23, the most germaine point is that luke warmers will insist that most of the rise in temperature from the depth of the LIA until about 1940 is natural in origen.  That, is also, the concensus position.  However, it means that the "lukewarmer" prediction for temperature increase above MWP conditions given only a doubling of CO2 is from 0.7 C assuming natural conditions return to those at the lowest point of the LIA, to 1.8 C above MWP (assuming they stay at current levels).

    Of course, on current trends we will significantly more than double atmospheric CO2.

  27. The Japan Meteorological Agency temperature record

    Kevin

    thanks. Kriging looks a very interesting technique, I would be tempted to use a cubic spline or other signal processing technique. Might be an interesting comparison. With the absencence of Arctic data it is interesting that it gives such good results as I'm sure a spline or similar technique would underestimate the Arctic trend.

  28. The Japan Meteorological Agency temperature record

    Composer: The Arctic is a big issue because of the magnitude of the trend there. Here's a GISTEMP figure from U-Columbia (which I've used before).

    The Arctic trend look like around 1C/decade - that's around 6 times the rest of the planet! So yes, leaving it out is a huge deal. And when does the trend really take off? You guessed it - around 1998.

    The rest of the missing regions are mostly land, which is in turn warming faster than ocean.

  29. Sea level rise predictions are exaggerated

    Kevin @22:

    Um, you did look at figure 2, that shows the rate of change increasing? Tamino's blog also has a recent post discussing some of this. And you realize how the rate of increase is going to depend on both warming of the oceans and increased loss of land ice, and future predictions of this don't depend on the past trend alone?

    First, you ignore the fact that the rate of increase has gone up over the last hundred years, then you do a linear extrapolation, then you admit that a linear extrapolation is not appropriate, but then you claim that the principle is the same and go ahead and do it anyway, because "the math is simpler"????

    Bottom line: you don't see any evidence because you're working so hard not to see it.

  30. Lukewarmerism, a.k.a. Ignoring Inconvenient Evidence

    Jeffrey @20 - we've got a post looking at future climate change under various sensitivity and emissions scenarios tomorrow.  It's going to be a good one, stay tuned.

  31. Lukewarmerism, a.k.a. Ignoring Inconvenient Evidence

    Nick...  Yup.  And I believe this is the original source of the colored and doctored version:

    http://www.co2science.org/education/reports/prudentpath/ch1.php

    You can catch these pretty easily when they pop up because most of the Idso's MWP Project graphs are doctored in various ways.  The always add in their own notations of where MWP, LIA, etc occur.  They delete any aspect of the original that might be inconvenient and then they add the notation "Adapted from..."

  32. Sea level rise predictions are exaggerated

    So, you have a prediction for sea level rise of between 750mm and 2,000mm, but have observed rates of 3.2 mm/yr.  100 yrs X 3.2 mm/yr = 320 mm.  So, essentially, you are predicting a substantial increase in the rate of rise.Looking at the graph of sea level rise for years 1880-2000,there does not seem to be much chance of your prediction coming true. 

    A gradual, steady increase from 3.2 to 11.8 mm/yr by 2100 would give you an increase of 750 mm after 100 years, but it would take a steady increase to 36.8 mm/yr by 2100 to give you a 2 M rise.  I realize you are not advocating for a linear increase, but the math is simpler and the principle remains the same.


    Bottom line, I don't see any evidence that these increases are occurring, so I don't see the predictions happenning.

  33. Lukewarmerism, a.k.a. Ignoring Inconvenient Evidence

    Rob Honeycutt@19

    Yup it does come from a denialist source.That is why I think it can be used against lukewarmers - Judo uses the enemy's strength against himself - to make the argument powerfully that even 1°C of warming is likely to have far reaching effects.

    Connolley put in the data that was sneakily missed out - see below

  34. Lukewarmerism, a.k.a. Ignoring Inconvenient Evidence

    Nick Palmer - maybe the lukewarmers can explain why global sea level (a proxy for the volume of global land-based ice and therefore global temperature) during the Medieval Period was static during that time and only began to rise appreciably in the 19th century?

  35. Lukewarmerism, a.k.a. Ignoring Inconvenient Evidence

    This graph also shows up at Stoat:

    http://scienceblogs.com/stoat/2013/02/07/the-sleepwalkers/

    WMC comments:

    "So now we know how MR proposes to support his assertions: provide evidence that doesn’t cover the period in question, and erase information that contradicts his assertions – even when that comes from the very refs he is quoting"

    http://www.flickr.com/photos/belette/8454321768/

  36. Lukewarmerism, a.k.a. Ignoring Inconvenient Evidence

    It needs to be stressed that climate sensitivity is not a limit on warming. A climate sensitivitiy of 2C does not mean that there will only be 2C of warming. Warming will continue as more CO2 is added to the atmosphere. Nor is there any guarantee that we won't face a terrible catastrophe before warming reaches 2C. Storm damage, crop damage, the advance of insect pests have all reached terrible levels today when we've only experienced around .9C of warming.

    Ask a "luke-warmer" if they'd play Russian Roulette with 3 live bullets out of 6.

  37. Lukewarmerism, a.k.a. Ignoring Inconvenient Evidence

    Nick Palmer...  First thing I notice about that graph, even without going to Stoat to see it, is the phrase "Adapted from Ljundquist, 2010."  I would bet my bottom dollar that graph actually comes from the Idso's website, CO2science.

  38. The Japan Meteorological Agency temperature record

    What a difference in trend the missing 15% of coverage makes.

    I guess it shouldn't be surprising given that the missing areas are among the fastest-warming.

  39. The Japan Meteorological Agency temperature record

    If you keep putting together such articles I'm going to get embarrassed by the amount of compliments I give you.

  40. Lukewarmerism, a.k.a. Ignoring Inconvenient Evidence

    Graph 3 from Stoat's post "the sleepwalkers"


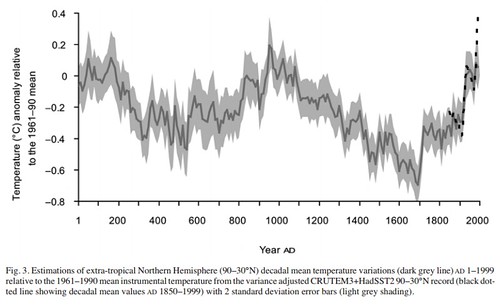
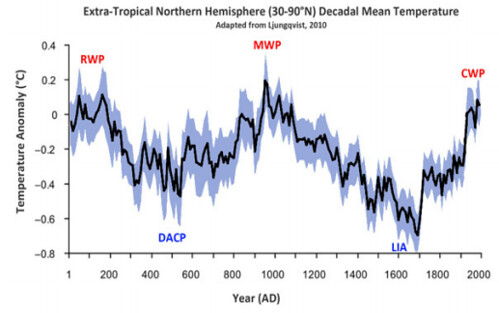
    Perhaps this is too simplistic but, from the graph aboove, which was taken from Stoat's post "The Sleepwalkers", from the height of the MWP to the depths of the LIA seems to only be about 0.9°C which is what a lot of the lukewarmers expect we are going to get, with their favoured low sensitivity figure.

    But, eyeballing, that would put us about 0.7°C on top of the peak of the MWP which suggests that such an apparently small increase (which the lukewarmer types represent as insignificant) would actually be quite a big deal in terms of the changes to the planet, no? From the LIA to the MWP was certainly a big change to the climate in the northern hemisphere…

    Do they shoot themselves in the foot by backing an approximately 1 °C rise figure? If they have already accepted up to 3°C sensitivity, as Moshers and co's self-description seems to suggest, then surely it is an open and shut case for them to agree that any rise between 1-3°C has got to be extremely risky?

  41. A Brief Note on the Latest Release of Draft IPCC Documents

    Given that their own belief sytem is almost entirely based on non-peer-reviewed material, it is ludicrous for climate contrarians to complain about the IPCC reviewing "gray literature".

  42. Lukewarmerism, a.k.a. Ignoring Inconvenient Evidence

    Andy Skuce @6

    You will find Steve Mosher's definition of Lukewarmerism in the comments to this post - reasonably early on.

    http://wattsupwiththat.com/2013/02/01/encouraging-admission-of-lower-climate-sensitivity-by-a-hockey-team-scientist/#comment-1214225

    I am still at a loss to define "Lukewarmers" - there seems to be agreement on teh fundamentals of the science, but a difference in the response. Some, like Richard Tol and Pielke Jnr, just seem to take a different tone - Tol for example is on the "academic board" of the science-denying Global Warming Policy Foundation, but supports a carbon price for all the right reasons. Others (Judith Curry) desire to be "bridge builders", but turn out to be anything but. My own suspicion is that they just get a kick out of running with the foxes and hunting with the hounds at the same time.

  43. Announcing the Skeptical Science Glossary

    Brent (and others wishing not to have glossary popups appearing), you can pull up the tab at bottom of your screen ("Look up a Term") and select "No Definitions" (at lower right). 

  44. Announcing the Skeptical Science Glossary

    Excellent idea in principle but with FF 18.0.2 it's infuriating, forever trying to avoid keywords with my cursor.  Afraid I'm going to disable scripts for SkS from now on.

    Moderator Response: [Sph] As Doug points out in the following comment, you can easily turn off the automated glossary function using the glossary tab at the bottom of the page.

    We are looking into adding a short (configurable) delay, but the coding for it is not straightforward.
  45. Lukewarmerism, a.k.a. Ignoring Inconvenient Evidence

    In the case of Mosher and Fuller, I wonder if the need to distance themselves from the consensus view despite their actually sharing the consensus view is related to the fact that they wrote and profited from a book that accused leading climate scientists of scientific fraud?

    It was Mosher who, years ago, before ClimateGate, coined the term Michael "Piltdown" Mann as part of the CA-led attack on MBH 1998/99 and the "hockey stick", in essence claiming that his work on climate reconstructions was a fraud on the level of Piltdown Man.

    Perhaps portraying the mainstream as having moved to their view, rather than the obvious fact that their view has moved to be in line with the mainstream (regarding climate sensitivity to a doubling of CO2, at least) is easier than admitting that their earlier claims of scientific fraud were unwarranted.


  46. Lukewarmerism, a.k.a. Ignoring Inconvenient Evidence

    Interesting reading over at fuller's.   Self-congratulation on scientists like Annan accepting the lukewarmer position that climate sensitivity is ... about 3C.


    The delusion over there seems real.  They really seem to believe that the consensus position has been 4C or more, and all of the calls for action are based on sensitivity at that level.


    While sensitivity in the "about 3C" range, even if a bit lower as Model E and other results might suggest, has been, of course, the basis for policy arguments that we must take definite action if we want to restrict warming by 2100 to 2C over preindustrial levels.


    The disconnect with reality, history of climate science, history of the political calls for action is just ... stunning.

  47. Lukewarmerism, a.k.a. Ignoring Inconvenient Evidence

    dorlormin,

    That's exactly right. Someone who derives their conclusions from the evidence can't help but arrive at the obvious value:

    There is still uncertainty, sure — for example, the sensitivity is probably temperature-dependent since certain feedbacks only exist within certain temperature ranges (e.g. in terms of albedo, highly-reflective ice can only exist up to a certain temperature; vegetation can only exist up to a certain temperature, etc.) which means the past values may not be exactly the same as the future, but that's still the best information we have, and saying "Well, it was high in the past, but we're now pushing it into a regime unknown for tens of millions of years and we don't know what it will be under those circumstances, so let's assume it's lower!" doesn't seem like good risk management!

    Choosing to ignore that and instead assume a sensitivity a-priori (or using a technique that is fundamentally unable to give you an accurate answer while ignoring those that do) is not scientific, no matter how "scientific" the proponents feel they are because they have grudgingly agreed to accept every other piece of evidence leading up to that last one, which is just one step too far for them. It's as if they think this last obstacle to action is impenetrable, so they're willing to concede everything else, but you get the feeling that if you push too hard on the last one they'll take a step backwards and proclaim "But CO2 is a trace gas anyway! UHI! Sun!". :-)

  48. Lukewarmerism, a.k.a. Ignoring Inconvenient Evidence

    Lukewarmism is a nonesense idea that is designed to artificially polarise the debate into discrete camps. It is a premeditated selection of the minimum defensible sensitivity and creating an argument around that rather than an open process of bringing evidence to the table. 

  49. Lukewarmerism, a.k.a. Ignoring Inconvenient Evidence

    Tom @10 - I entirely agree.  Mosher's move towards the IPCC/consensus has been quite noticeable, and as a result he's become less and less popular amongst the contrarians.  It does seem like he's holding onto this 'lukewarmer' label just to distinguish himself rom the consensus position somehow.

    I also very much agree that if you believe there's a ~50% chance equilibrium sensitivity is 3°C or higher, you should be pushing hard for urgent action on climate change.

    And that dovetails very well with my next post coming up on Wednesday, looking at future climate change in various sensitivity and emissions scenarios.  Stay tuned, that's going to be a good one.

  50. Lukewarmerism, a.k.a. Ignoring Inconvenient Evidence

    " But though he has shifted towards the IPCC position, he does not want to give up that title, so he has expanded the range of "lukewamer" positions to the right. "


    And consider this:


    "Everything we believe is well within the consensus and we think that you can change the consensus from inside the tent "


    If one's opinion lies within the consensus, the need for changing the consensus is driven by ... what, exactly?


    Tom Fuller has also in the past said he thinks sensitivity is about 2.5, i.e. dead-on with NASA GISS Model E's 2.4-2.7 range.  He's made a big deal of James Annan's work to diminish the high tail of uncertainty as though this is somehow counter to the mainstream view (Annan thinks sensitivity lies within 2.5-3C, though he agrees that higher values can't be entirely ruled out).


    I think that lukewarmerism is just obfsucation - claiming a difference where non exists in order to appear to accept the science in order to support their political position that nothing need be done (or not much needs to be done).


    I think it's just an effort to paint the mainstream view as being that sensitivity is > 3C and likely considerably higher, that calls for action are based on that view, and then "reasonably" extrapolating that accepting a lower value (say 2.5-3) means no immediate action need be taken ...


Prev  968  969  970  971  972  973  974  975  976  977  978  979  980  981  982  983  Next


The Consensus Project Website

THE ESCALATOR

(free to republish)


© Copyright 2024 John Cook
Home | Translations | About Us | Privacy | Contact Us