


 Arguments


Recent Comments
Prev 969 970 971 972 973 974 975 976 977 978 979 980 981 982 983 984 Next
Comments 48801 to 48850:
-
Tom Curtis at 07:46 AM on 12 February 2013Humidity is falling
Jeff313 @7, thankyou for admiting that your formula was merely sloganeering, not analysis. Once, however, you admit that the effect depends on the values, unless you analyse the actual values and the effect they have, which you have not done, you are unable to say anything regarding the net effect. This is particularly the case given that increases water vapour provides both a positive (the WV feedback) and negative (the lapse rate feedback) feedbacks. If WV is increased at medium altitudes, but decreased at high altitudes, that can have the effect of neutralizing the lapse rate feedback, while strengthening the water vapour feedback. Ergo, your slogan is not valid even as a "general statement".
-
Tom Curtis at 07:16 AM on 12 February 2013Lukewarmerism, a.k.a. Ignoring Inconvenient Evidence
dana @9, I think that has more to do with the fact that Mosher has been shifting towards the IPCC position over time. I doubt many of his "fellow" lukewarmers would still recognize him as one. But though he has shifted towards the IPCC position, he does not want to give up that title, so he has expanded the range of "lukewamer" positions to the right. Indeed, he has expanded it so far that his estimate of the probability of a climate sensitivity between 3 and 4.5 C is likely greater than the IPCCs. His estimate of for greater than 4.5 C is, however, much lower.
In fact, I think his high estimate for 3-4.5 C is the real story here. The disaterous future consequent on greenhouse emissions that is currently predicted assumes a climate sensitivity of 3 C per doubling of CO2. Mosher things there is nearly a 50/50 chance it is worse than that. Why, then, is he not demanding urgent action to mitigate climate change?
Andy Skuce - Mosher's comment.
-
Tom Curtis at 06:52 AM on 12 February 2013Temp record is unreliable
Kevin @266, first, the chart I showed @263 is not of adjustment of individual temperature datums, but of adjustment to station trends. That is not a matter of adjustments down early and up late, but of differing adjustment for each station that just happen to have a mean value slightly above zero, even though nearly half make negative adjustments to the trend.
Second, it is not a 10% adjustment, but an 8.9% adjsutment in a record with an 11% error margin. Further, it was not an adjustment in the temperature at all, but an adjustment in an index of temperature which you have done nothing to show makes that index less accurate. For all you know, and most probably, it has made it more accurate.
-
dana1981 at 06:52 AM on 12 February 2013Lukewarmerism, a.k.a. Ignoring Inconvenient Evidence
Pierre-Normand @8 - right you are, thanks. Figure caption updated accordingly.
Tom @7 - I still think that's a pretty minimal difference between the IPCC and Mosher positions.
-
Pierre-Normand at 06:41 AM on 12 February 2013Lukewarmerism, a.k.a. Ignoring Inconvenient Evidence
Although it's been released in Jan 2013, the University of Colorado mean sea level data seems only to extend until late 2012. The last data point is for 2012.8590 (That is 859/1000 of the year, or something like the 313th day of 2012).
-
scaddenp at 06:39 AM on 12 February 2013Temp record is unreliable
Kevin, I am giving you reasons why a disparity would suddenly appear. A change in TOBS, move from city to airport, change of thermometer, and change of screen will all create a discontinuity in the record that the algorithm will pick up, and they will all result in temperatures taken after the change being lower than the ones before, so adjustments will increase trend.
-
Tom Curtis at 06:37 AM on 12 February 2013Lukewarmerism, a.k.a. Ignoring Inconvenient Evidence
shoyemore @1, it is interesting to compare the IPCC AR4 with Mosher's definition:
"Analysis of models together with constraints from observations suggest that the equilibrium climate sensitivity is likely to be in the range 2°C to 4.5°C, with a best estimate value of about 3°C. It is very unlikely to be less than 1.5°C. Values substantially higher than 4.5°C cannot be excluded, but agreement with observations is not as good for those values. Probability density functions derived from different information and approaches generally tend to have a long tail towards high values exceeding 4.5°C. Analysis of climate and forcing evolution over previous centuries and model ensemble studies do not rule out climate sensitivity being as high as 6°C or more. "
(Original emphasis)
In the contrained language of the IPCC, that means that thre is a less than 10% chance that the Climate Sensitivity is less than 1.5 C per doubling of CO2. There is a 66% chance it lies between 2 and 4.5 C per doubling, and that the probability does not fall of as quickly above 4.5 C as it does below 2 C.
The IPCC did not publish a PDF for its own assessment, but the right skew of probabilities means that a climate sensitivity between 3 and 4.5 C is more probable, on their assessment than a probabiltiy between 2 and 3 C.. That is, although 3 C is the modal value, the median and mean values probably lie between 3 and 4.5 C.
Because Mosher has not used the same demarcations, and because his assignment of probabilities is inconsistent, with a total probability greater than 1.025, direct comparison is difficult. It is clear that somebody accepting IPCC values would preffer the upper half of the bet between the climate sensitivity being between 2 and 3 C, or 3 and 4.5 C, As the probability of greater than 4.5 C is greater than the probability less than 2 C, and hence greater than the probability of between 1 and 2 C, they would also take the upper half of Mosher's proffered bet. Hence I disagree with both Dikran and Dana that Mosher's opinion that the IPCC just about fall within the opinion of luke-warmer.
Having said that, I finde Mosher's definition of "lukewarmer" strange. It is strange both because most self avowed lukewarmers I have known have been quite clear that:
1) The probable CS is around 1.5 C per doubling (very close to Mosher's lower limit); and
2) The climate sensitivity is sufficiently low that no major action need be taken to mitigate climate change.
Indeed, "lukewarmer" seems to be a badge for saying, "I'm not so foolish as to deny well established physics, but let's do nothing to protect the future". I should note that both Lindzen and Monckton who purport to believe the most probable cliimate sensitivity is 0.5 C per doubling also claim to be "lukewarmers".
-
Andy Skuce at 06:32 AM on 12 February 2013Lukewarmerism, a.k.a. Ignoring Inconvenient Evidence
shoyemore:
Do you have a link for that?
Just like M Jourdain in the play le Bourgeois Gentilhomme who was surprised to hear he had been speaking prose all his life and never knew it, so it is that I am now shocked to discover that I have been a lukewarmer all along, at least by Steve Mosher's definition.
The 50% of Lukewarmers who would vote for a most likely climate sensitivity between 1 and 3 is a broad church encompassing contrarian extremists like Ridley, as well as the IPCC consensus. There's a factor of three over that particular range—a lot of uncertainty by any but Judith Curry's standards—and it implies a huge difference in climate outcomes from mild to very serious.
I think that what truly unites Lukewarmers is not any internal consistency of scientific opinion, but rather their desire not to be seen as so stupid to deny basic science and, at the same time, not being able to admit that the dirty hippies were right all along.
-
pmauca at 05:49 AM on 12 February 2013Announcing the Skeptical Science Glossary
Great idea, but lots of irratating popups in firefox!
-
dana1981 at 05:47 AM on 12 February 2013Lukewarmerism, a.k.a. Ignoring Inconvenient Evidence
In fact, rather than "lukewarmer", I'd characterize Mosher's position as "pretty darn warmer".
-
dana1981 at 05:45 AM on 12 February 2013Lukewarmerism, a.k.a. Ignoring Inconvenient Evidence
Agreed with Dikran @2 - Mosher's definition of "lukewarmer" is pretty much where the IPCC already is, and close to where I am too. Basically he says lukewarmers think the most likely equilibrium climate sensitivity value is maybe a smidge lower than the IPCC does. That's an inconsequential distinction, and incompatible with the positions of Ridley and Michaels.
HH @3 - yes, let's just hope that Ridley doesn't exert any significant influence over UK climate or energy policy from his new position.
-
A Change in the Weather at 05:45 AM on 12 February 2013An Updated Look at What Keystone XL and Alberta Tar Sands Mean for the Climate
The oil from the tar sands, like any oil found anywhere, will not "replace" any other oil. It will be additive. It's a circular dynamic. The supply/demand curve determines the price, and any oil that can come on at that price will come on. As long as there's expansion of fossil-fueled infrastructure in the world, demand will be there.
This is exactly what's happening with natural gas. Notionally, it should replace coal for electric generation in the US. And it is. But the displaced coal is being exported to China.
We can't solve the carbon accumulation problem by adding more carbon. Once we enter the detailed discussion of the relative merits of carbon-emitting projects, we are lost. We have implicitly accepted the carbon emissions. We're at the point of choosing the moment to start reversing this modality.
I agree the deniers are a danger. They will be incensed. Violence at some point is not hard to imagine. But violence is also the endpoint of continuing down our current path, as the atmosphere becomes more unstable and agriculture fails.Obama would be wise to avoid mentioning KXL until he has an entire strategy: no KXL, but yes to this (e.g., a Manhattan Project for renewables deployment). But that needs to happen very soon.
-
Hyperactive Hydrologist at 05:29 AM on 12 February 2013Lukewarmerism, a.k.a. Ignoring Inconvenient Evidence
Ridley has recently been elected to the House of Lords and he is also on the GWPF’s Academic Advisory Council.
-
SteveFunk at 05:28 AM on 12 February 2013Announcing the Skeptical Science Glossary
Here's a minor glitch: The definition of source does not fit the context, i.e. sources of information.
-
Dikran Marsupial at 04:47 AM on 12 February 2013Lukewarmerism, a.k.a. Ignoring Inconvenient Evidence
@shoyemore Seems to me the IPCC fall just about within that definition of "lukewarmer"!
-
shoyemore at 04:42 AM on 12 February 2013Lukewarmerism, a.k.a. Ignoring Inconvenient Evidence
Steve Mosher recently defined "Lukewarmer" on WUWT as (reformatted for clarity)
... back in 2007 or 2008 we did a poll on Climate audit asking the question
How much of the warming we see today is due to GHG?
There was a distinct group of us that said ‘some, but not all ” heck even Willis said 30%We called ourselves Lukewarmers.
Over the years a few of us have worked to define what we mean by Lukewarmer and what defines the position.
1. Acceptance of radiative physics.
2. Acceptance of a lower bound to sensitivity. basically the no feedback estimate is 1.2C per doubling. We think that the true sensitivity will be above 1.
3. over/under line. The over under line is 3C. That is, if offered a bet that the climate sensitivity is either ‘between 1 and 3 or over 3, we take the under bet.ballpark:
less than 1. 2 5%
1.2 to 3. 50%
3 to 4.5 45%
4.5+ 5%So if you believe that GHG can warm the planet and not cool it, and you think that the mean estimate of the IPCC of 3.2 is more likely high than low, then you are a lukewarmer. But you have to drop the crazy refusals over radiative physics.
Note:
- Lukewarmers dont have to attack the surface record, its probably correct to within .2C
- We also dont have to slam models, or invent kook theories about the sun.
- Everything we believe is well within the consensus and we think that you can change the consensus from inside the tent rather than attacking everything and everyone.
- Focus on sensitivity, work to refine that. You see there is a debate in climate science, its a debate about sensitivity.
- When folks start putting their effort into that ( instead of frittering away time on tangents then you will see changes.
I find most ofthat innocuous, which suggest that "Lukewarmerism" is more of an emotional position with regard to scientific consensus than a fundamental scientific difference. Ridley and Michaels are definitely not "Lukewarmers" like Mosher.
-
Composer99 at 01:39 AM on 12 February 2013Temp record is unreliable
The algorithm was put in to pick up disparaties, not a change in when temp was measured. So this argument does not apply.
Really? I'd say there'd be a disparity, almost by definition, between temperature readings a weather station makes at one time of day and those it makes at another.
With regards to the remainder of your comment #266, the bottom line is that you have articulated suspicions (yours and others') that something is wrong with GISTemp following adjustments made in 2008.
However, and this is the critical part, you have not provided, either directly in the comments or by link to another site, any actual criticism of the adjustments. What you have instead provided is an extended argument from personal incredulity and allegations of bias.
If you can furnish any sort of methodological critique of GISTemp's processes, I am sure that the knowledgeable commenters here would be quite happy to discuss them. Until then, however, it seems to me that you are wasting your time - I rather doubt you will convince those skeptical of your claims as long as you limit your arguments to the above.
-
Dikran Marsupial at 01:13 AM on 12 February 2013Humidity is falling
Jeff313 wrote "I would add to this argument that even NASA has estimated that some of the warming over the last century is due to increased solar activity."
You do know that the IPCC AR4 WG1 scientific basis report explicitly states the much the same thing? However, that is for the warming of the first half of the 20th century, thus it doesn't support your hypothesis as since then humidity has been rising, whilst solar forcing has been steady or declining slightly.
-
Kevin8233 at 00:35 AM on 12 February 2013Temp record is unreliable
I think the expectation that adjustments should be even is also misplaced. If you want to compare temperature measurements mad today with measurement taken in the morning, against same station but temperature done in afternoon, then you have to move past temperature down. Its a change of practise
The algorithm was put in to pick up disparaties, not a change in when temp was measured. So this argument does not apply.
In fact, if you look at the SkS trend Calculator you will see that the trend for Gistemp is 0.064 C per decade +/- 0.007 C per decade (11%). So his point is that the temperture record is not as accurate as advertized because a change smaller than the advertized accuracy has been made
That is not what I was saying. For the century, there was a 10% increase in the rate of temp increase, solely due to these adjustments.
Tom Curtis,
I didn't state that all the temp adjustments were positive, I stated that all of them made the temp increase rate change in a positive fashion. Lower the early temps, increase the latter temps. When you look at the chart I gave, that is exactly what happened.
-
Philippe Chantreau at 00:11 AM on 12 February 2013Humidity is falling
The debate? What debate? Your post is full of confusion and it is hard to figure exactly what you're trying to say. Solar activity is monitored by satellites. CO2 release does not increase the water vapor content of the atmosphere, increased temperature does that, regardless of the forcing. Temperatures have continued to increase as solar activity has decreased.
Another fact: scentists do their work and normally do not pay attention to the noise coming from contrarians who have clearly no clue. Unfortunately, in some case, that noise becomes such a distraction that they do have to spend time addressing nonsense.
-
Jeff313 at 23:15 PM on 11 February 2013Humidity is falling
Tom curtis
My concept that "+CO2 - H2O equals no change in greenhouse gases" is a general concept. The quantities is the debate. It is in now way bad algebra If CO2 reduces the amount of another green house gas, the effects are minimized. This is the same equation (with a negative value) that would be used to say that warming is amplified by increased H2O. No one would argue that the algebra is bad in that case just because someone did not give the exact quanities of the H20 increase. My only point was to make clear the importance of a full understaning to the processes in play.
I would add to this argument that even NASA has estimated that some of the warming over the last century is due to increased solar activity. I my option, direct warmth added to the sun would of course create an increase in humidity. So it is no suprise or proof (in and of itself) that increased humidity prove theories that CO2 released into the atmosphere increases H2O. I only question this because in Chemistry 101 in phase diagrams there are 2 factors that would effect the evaporation of water, heat and pressure. I have only heard the heat being considered in this process. Increased pressure would decrease the phase shift. Quantities are again the debate.
-
Jeff313 at 22:48 PM on 11 February 2013Humidity is falling
Doesn't changing algorithms that give you what you want to see raise a red flag for anyone? Perhaps they are better algorithms, but the number of times "
(-intimations of fraud, impropriety and malfeasance snipped-)".
I understand the reasons for you assuming that fraud is primary thing implied when I mentioned a "red flag", as it is often brought up in this argument. However, making clear I am now not talking about anything that could be considered a personal attack, we can not burry our heads in the sand as to human nature and human frailities that is true to all (including myself). What I am now talking about is mistakes based on a biases that might spring from anything, even frustration arguing points with "contarians" such as myself. As such I would think that scientists would have to keep a earnest watch for such things. And when there is a pattern that changes to algorithms seems to always help your points, it should raise a red flag. Again, not to accuse anyone of anything that I would not be given to myself and it is only made to help other understand secpticism and perhaps a need to double check and, yes question, the accuracy of some work.
I hope this general topic is not off limits for this board, but to be safe, even though I think it is a valid point that both sides should admit to for honest conversation, I will not mention this topic again.
Moderator Response:[DB] Quite frankly, lacking specific examples in your concerns about "red flags", any discussion by you of uncertainties in your understandings clearly highlights that very point: you lack command and comprehension of what you are trying to discuss.
Given that, the appropriate next step would be to isolate those areas where you lack understanding and first study more, and to then ask questions when you get stuck. Starting with the assumption, as you do, that since you do not understand something that therefore a likely possibility is that mistakes were made upon the part of the scientists and researchers in this area. This is a fallacy known as the Dunning-Kruger Effect and may also reflect cognitive dissonance and cognitive bias on your part.
-
Tristan at 21:56 PM on 11 February 201316 years - Update and Frequently Asked Questions
I did the skeptic blogs for about a year. It's rough on the spirit. I imagine it'd be much worse if climate science was your vocation, not merely an interest, as it is in my case.
-
bill4344 at 20:58 PM on 11 February 2013Announcing the Skeptical Science Glossary
Shiny, and very handy for laypeople (like myself) but may need a bit more filling-in to be a truly comprehensive guide for the uninitiated -
'MBH98' was not found in the dictionary of terms(!)
-
Kevin C at 20:31 PM on 11 February 201316 years - Update and Frequently Asked Questions
I enjoyed the bathysphere comment!
(Spending too much time on the front lines of this debate is hard on the nerves and the sense of humour. I can't handle it at all, which is why I try to do research to fill the gaps. Tom's an ace, but I'm guessing he missed your earlier comments and so didn't have the context I did.)
-
chriskoz at 20:05 PM on 11 February 20132013 SkS Weekly Digest #6
AU env minister Tony Burke approves huge gas and coal plans news just came out. "This is a black day for the environment in NSW", a statement I tend to agree with. Apparently, those projects will increase AU CO2 footprint by 8% which will no doubt push AU back to the first place in per capita emissions. Note that Tony Burke represents the federal Labor govs, so those who introduced CTax a year ago and who are supposed to care. Apparently, still, they cannot resist the presure of coal/fracking industry...
-
ChrisJJ at 20:04 PM on 11 February 2013The Great Disconnect: the human disease of which climate change is but one symptom
This is a great article. It has been criticised by some commenters for not being scientific enough. Well, OK, but it does highlight some of the reasons why it's difficult to explain scientific concepts to ordinary, everyday people.
There is a general malaise in society today, and this article points very clearly to the reason for it.
I think I might summarise these ideas on my own blog and link to this article. More people need to read it and give it serious thought.
Thanks for publishing it here.
-
Tristan at 19:52 PM on 11 February 201316 years - Update and Frequently Asked Questions
Without a winking smiley or other blatant display of humor, it is impossible to create a parody of fundamentalism that someone won't mistake for the real thing.I thought the bathysphere comment would be enough, but apparently not. -
chriskoz at 19:23 PM on 11 February 2013Announcing the Skeptical Science Glossary
Term lookup dropdown does not seem to be very useful. What is is supposed to be? An autocomplete? If so, it misses some terms. E.g. a dictionary term "AR4" is missing. Even if I type it and invoke it with "Define" button, and then try to look for it again in the list (in case the list is supposed to be updated with my browser chache) it's still not there. Also the list is not scrollable. My browser: FF 18.0.2
Don't get me wrong: awesome work guys. Just this little semi-baked list list bugs me, as
I don't understand its purpose and how it works. -
Tom Curtis at 19:05 PM on 11 February 201316 years - Update and Frequently Asked Questions
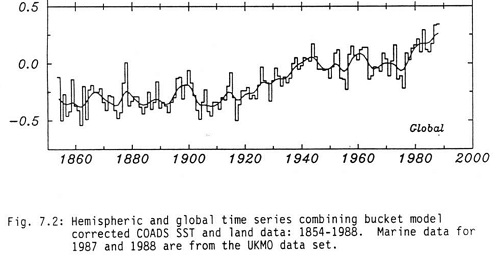
Tristan @15, it is difficult to imagine how you could think that a ship, entering new water at 4 knots or higher could warm that water significantly before it was measured after being collected from in a bucket thrown from the bow. Regardless, buckets show a cool bias, particularly canvass buckets, with evaporation cooling the water in the bucket prior to measurement. It is true that direct instrumental measurements in engine intakes show a warm bias of about 0.1 C, but great effort has gone into measuring that (and bucket) bias, and correcting for it.
That, apparently means noting for you. In fact, your comment looks like nothing more, to me, than a mere assertion that you don't like the facts, with a tissue of excuse as to why you choose to ignore them.
-
Dikran Marsupial at 19:01 PM on 11 February 201316 years - Update and Frequently Asked Questions
Habilus you do know, don't you, that "no statistically significant warming for 16 years" does not mean that there has been no warming for 16 years?
It just means (loosely speaking) that we can't rule out the possibility that it hasn't warmed during the last 16 years. If you read the BBC interview, you will find that Prof. Jones clearly understands this, and is perfectly happy to say that the (cherry picked) trend wasn't significant, because he understands why that isn't actually all that surprising (the time span is short, so the power of the test is fairly low).
-
Tom Curtis at 18:57 PM on 11 February 201316 years - Update and Frequently Asked Questions
I have been trying to follow up on Habilus' (@8) claim that the Met Office asserted that the globe had coolled by 0.5 C degrees between 1940 and 1970. I have been unable to track down any such claim. What I have found is the global land temperature record, as determined Mitchell, 1961:

(Source)
That shows just less than a 0.3 C degree fall between the 1940s and the 1960s; but is a land only record and so covers only 30 percent of the globe.
The earliest attempt at a true global, land-ocean temperature record I can find is Farmer 1989, which shows a decline of just over 0.1 C:
Indeed, the only early record showing a 0.5 C decline over that interval is from figure 7.6 (a) of the IPCC FAR, WG1, Chapter 7 (1990). That, however, shows only Northern Hemisphere, land only temperatures.
Giving the Habilus the benefit of the doubt, and assume his distant memories, unbacked by physical evidence, are correct; and that for a brief period the met office showed a greater decline in temperature from 1940 to 1970 than the scientific evidence supported before, or after. But even with this improbable assumption, Habilus can give us no reason why this brief revision showed the naked truth, which later revisions have corrupted.
-
Kevin C at 17:46 PM on 11 February 201316 years - Update and Frequently Asked Questions
I have one focussed interest in the sociology of science denial (DK alert - no formal sociology education), which is whether it is possible to identify scientific skepticism from science denial by the form of the arguments alone without even examining the content. I think it often is. In ortherwords, is there a 'fingerprint' we can use to identify science denial? Habilus' comment is a good case study.
First, we have to understand the difference between scientific skepticism and science denial:
- Scientific skepticism is knowledge seeking - it raises arguments with the aim of testing and/or correcting hypotheses in order to improve their correspondence to reality.
- Science denial is knowledge avoiding - it seeks to reassure the speaker and convince hearers that a hypothesis may be rejected in order to defend the speaker's worldview from inconvenient evidence.
Now, the point of the video is that 'warming' and the 'human contribution to warming' are two different things, and that a change in one is not necessarily evidence for a change in the other.
Habilus' response is to reassert a change in the rate of warming, which the video doesn't dispute. (S/he also relies on appeals to authority rather than data, thus showing a predisposition to social rather than evidence based reasoning, and falls for the null hypothesis fallacy). I think this demonstrates my point.
This raises an interesting possibility: Whenever someone makes an argument which has the fingerprints of science denial, don't engage with the argument - by doing so you are validating their position. Point out the structure of their argument.
-
jyyh at 15:51 PM on 11 February 2013Announcing the Skeptical Science Glossary
SSW (Sudden Stratospheric Warming) seems to even have a wikipedia article http://en.wikipedia.org/wiki/Sudden_stratospheric_warming
then there are other interactions (Stratosphere-Troposphere Exchanges aka) STE (an early summary article on the subject: http://www.ems.psu.edu/~brune/m465/strattropdynholton.pdf)
-
Lanfear at 15:25 PM on 11 February 2013Announcing the Skeptical Science Glossary
I would suggest putting the 'close all' at the top of the list. As it is now (FF18.0.1 Win7), if I have more than a screenful (my resolution is 1920x1200) of those definitions open, then I'm forced to close them individually until the 'close all' becomes visible again.
I also concur with llewelly that there should be a brief delay before popping the definition up.
-
jyyh at 14:32 PM on 11 February 2013Announcing the Skeptical Science Glossary
SSW (Sudden Stratospheric Warming) but as this is also south of southwest it might pose difficulties. ONI (forgot this was Oceanic Nino Index, but there are more Indexes describing aspcets of ENSO, such as MEI, SOI, so I'd leave it to readers to do the 10 second googling ( ONI + climate ) to find some of the acronyms out.
-
jyyh at 14:26 PM on 11 February 2013Announcing the Skeptical Science Glossary
Great feature, I might add. :-). AABW, ONI, IOD, SSW. (testing)
-
jyyh at 14:20 PM on 11 February 2013Announcing the Skeptical Science Glossary
Just learned that PIOMAS = Pan-arctic Ice-Ocean Modeling and Assimilation System, i.e. the model that assimilates the sparse ice thickness data from north of the 45°N latitude (to fully include Hudson Bay, and northern parts of the Black Sea that may also freeze, I guess) and creates a physically consistent (not necessarily fully accurate) dataset of artcic sea ice thickness data. partially gridded dataset available f.e. here. http://dosbat.blogspot.fi/2013/02/piomas-volume-thickness-breakdowns.html , there is also a fully gridded set of data somewhere.
As this is a hot topic at Neven's I suggest including the Acronym.
-
Rob Honeycutt at 13:13 PM on 11 February 201316 years - Update and Frequently Asked Questions
You know, I just remembered something another climate change denier pointed out a few months ago. I don't think I could find it again, but it was a newspaper story from the 1970's that showed "Met Office data" from mid-century. The diagram, indeed showed a ~0.5C drop in temps during that time period. But the graph was obviously not directly plotted from Met data but was a graphical representation done by someone at the newspaper (as far as I could tell).
What I believe was going on with that graph was, the artist misinterpreted -0.05C (which is what the data now shows) for -0.5C.
-
Tristan at 13:04 PM on 11 February 201316 years - Update and Frequently Asked Questions
The bucket data shows a spurious warming trend due to the ships heating the water arund them. The only data I accept is from bathyspheres.
-
JasonB at 12:55 PM on 11 February 201316 years - Update and Frequently Asked Questions
Even ignoring the basic confusion and accidental mixing of fake skeptic memes, there's something even more fundamentally wrong with Habilus' comment.
Apparently science is not allowed to progress.
Even if, for the sake of argument, he was actually correct about what the Met office was saying back in the 70s, what he's basically objecting to is the Met office doing additional work that allows a more accurate figure to be determined.
Let's just take one issue, for example — the sea surface temperature measurements. After WWII, there was a sudden increase in the number of temperature measurements being recorded by British ships, using buckets dropped over the sides of ships, which leads to a cooler temperature reading than what would be measured by engine intakes, the dominant method before then. This leads to a sudden and artificial drop in SSTs, causing a pronounced dip in global temperature reconstructions of that period.
HadCRUT4 now tries to correct for that effect, and the result is that the dip is a lot less pronounced than it was before.
According to Habilus, advancing the science to make the historical temperatures more accurate is simply to "conveniently" iron out a dip that for unnamed reasons was "inconvenient" in the first place. Apparently.
I suppose disco was the pinnacle of music as well.
-
llewelly at 12:20 PM on 11 February 20132013 SkS Weekly Digest #6
Please require the cursor to hover over the term for a longer period of time before popping up the definition.
As it is, when I scroll through a comment section looking for a comment, every time a term passes under my cursor, a definition pops up, however fast I am scrolling. This results in a lot of pop ups, which obscure what I'm trying to read. (It's a great idea, but I am already quite familiar with most of the definitions.)
(I see this behavior with FF 18.02 on debian gnu/linux 6.0.6 and OS X 10.7.5) -
Bob Loblaw at 12:01 PM on 11 February 201316 years - Update and Frequently Asked Questions
What was Phil Jones up to "back in the seventies"? Not sure. The first major paper of his looking at the temperature record that I'm aware is the 1982 paper that looked at northern hemisphere record:
Variations in Surface Air Temperatures: Part 1. Northern Hemisphere, 1881–1980
I've linked the abstract, and the pdf link for the full paper on that page is not paywalled.
Note that to maximize the "drop" in that record, you have to pick 1940 as the start year, just as fake skeptics keep picking 1998 these days. Spikes in the record - the gift that keeps on giving...
Methinks that Habilus is mixing up a whole bunch of fake skeptic memes:
- They predicted an ice age in the 1970s
- UK Met Office is bad (aka Climategate and the CRU hack)
Just what were you paying attention to in the '70s, Habilus?
-
Tom Curtis at 11:40 AM on 11 February 201316 years - Update and Frequently Asked Questions
... but presto magico, he still gets to have an opinion - and to think it is worth something.
-
Rob Honeycutt at 11:14 AM on 11 February 201316 years - Update and Frequently Asked Questions
Habilus... Please note that James Hansen works for NASA's Goddard Institute of Space Studies (GISS) not the Met Office.
It seems you're confused on quite a number of points.
-
Rob Honeycutt at 11:11 AM on 11 February 201316 years - Update and Frequently Asked Questions
Habilus... You're going to have to provide a reference to the statement that Met office claimed -0.5C from 1940-1970, otherwise your statement has no credibility.
And it was not Hansen that made the statement about statistically significant warming, it was Phil Jones of the CRU. And he stated that there was warming of 0.12C/decade but the time frame that was in question fell just short of statistically significant. The transcript from the interview can be viewed here.
-
Habilus at 10:55 AM on 11 February 201316 years - Update and Frequently Asked Questions
My apologies, Dr. Hansen claimed no warming for 10 years, not 16.
-
Habilus at 10:45 AM on 11 February 201316 years - Update and Frequently Asked Questions
For those of us who were alive and paying attention back in the seventies, the Met office claimed a -0.5C drop in temperatures from ~1940 to 1970. I see they've conviently ironed that out.
Besides, it was the progenitor of this very data, James Hansen, who claimed "no statistically signifigant warming" for the last 16 years. But presto magico, now we have warming again.
-
MattJ at 10:38 AM on 11 February 20132013 SkS Weekly News Roundup #6
Is there a mistake in the wording of the headline/article? I cannot for the life of me understand how cutting allowed carbon emissions even more is supposed to encourage electric utilities to comply. If anything, it would give them incentives to defeat all legal proposals to make them pay for the externalities of their industry -- something they have already shown themselves very good at doing.
-
SoundOff at 08:32 AM on 11 February 2013Announcing the Skeptical Science Glossary
Great feature. If you could spellcheck and proofread the glossary definitions they’d be even greater.
The glossary says under AR4: “Th 2nd report - Second Assessement Report (or SAR) released in 1966.”
Moderator Response: [Sph] Fixed.Thanks.
Prev 969 970 971 972 973 974 975 976 977 978 979 980 981 982 983 984 Next


