


 Arguments


Recent Comments
Prev 986 987 988 989 990 991 992 993 994 995 996 997 998 999 1000 1001 Next
Comments 49651 to 49700:
-
Tom Curtis at 11:31 AM on 19 January 2013Water vapor is the most powerful greenhouse gas
AlanSE @137: 1) Greenhouse effect: The explanation of the greenhouse effect at sierrapotomac.org is of poor quality, and will only confuse you if you are trying to understand it correctly. In particular, it describes the greenhouse effect as causing a greater absorption of heat. In fact, an increase in atmospheric CO2 would result in a greater increase in heat only while the Earth was not a radiative equilibrium. Once the Earth reached radiative equilibrium, there would be no further net gain in heat, but the greenhouse effect would still be enhanced relative to the condition with less CO2. It also says,"The heating of the earth due to the radiant heat of the sun is called the greenhouse effect", which is egregiously wrong. The radiant energy received from the Sun at the Earth's current albedo is 239 W/m^2. In the absence of a Greenhouse effect, the temperature of the Earth's surface would rise till it emitted 239 W/m^2, ie, approximately 255 degrees Kelvin (-18 C). A low IR emissivity would raise the temperature slightly; while a less than even temperature distribution across the surface would lower it. In practice, the second is the stronger effect so that the mean global surface temperature would be less than 255 K. As it happens, the Earth's global mean surface temperature is approximately 288 K (15 C). The higher temperature results in a much higher outward IR flux at the surface than the energy received from the Sun, and indeed, much higher than the outward flux at the top of the atmosphere. The difference between the outward flux at the surface and that at the top of the atmosphere is the atmospheric greenhouse effect. Trenberth et al (2010) give that difference as 156 W/m^2 (see diagram below), while Schmidt et al (2010) gives it as 155 W/m^2. It is very important that the IR radiation at the TOA is less than that at the surface only because greenhouse gases absorb outgoing IR radiation; and because those gases are cooler than the surface, so that when they emit IR radiation it has a reduced flux. It is also important to recognize that the TOA flux can only be smaller because energy absorbed by the atmosphere is also transferred to the surface. Without the energy transfer to the surface both the reduced flux at TOA, and the flux at the surface greater than solar radiation absorbed would violate conservation of energy. As it happens, the energy equations do balance (see diagram above). The energy transfer from atmosphere to surface is in the form of back radiation, but could be in another form and you would still have a greenhouse effect.
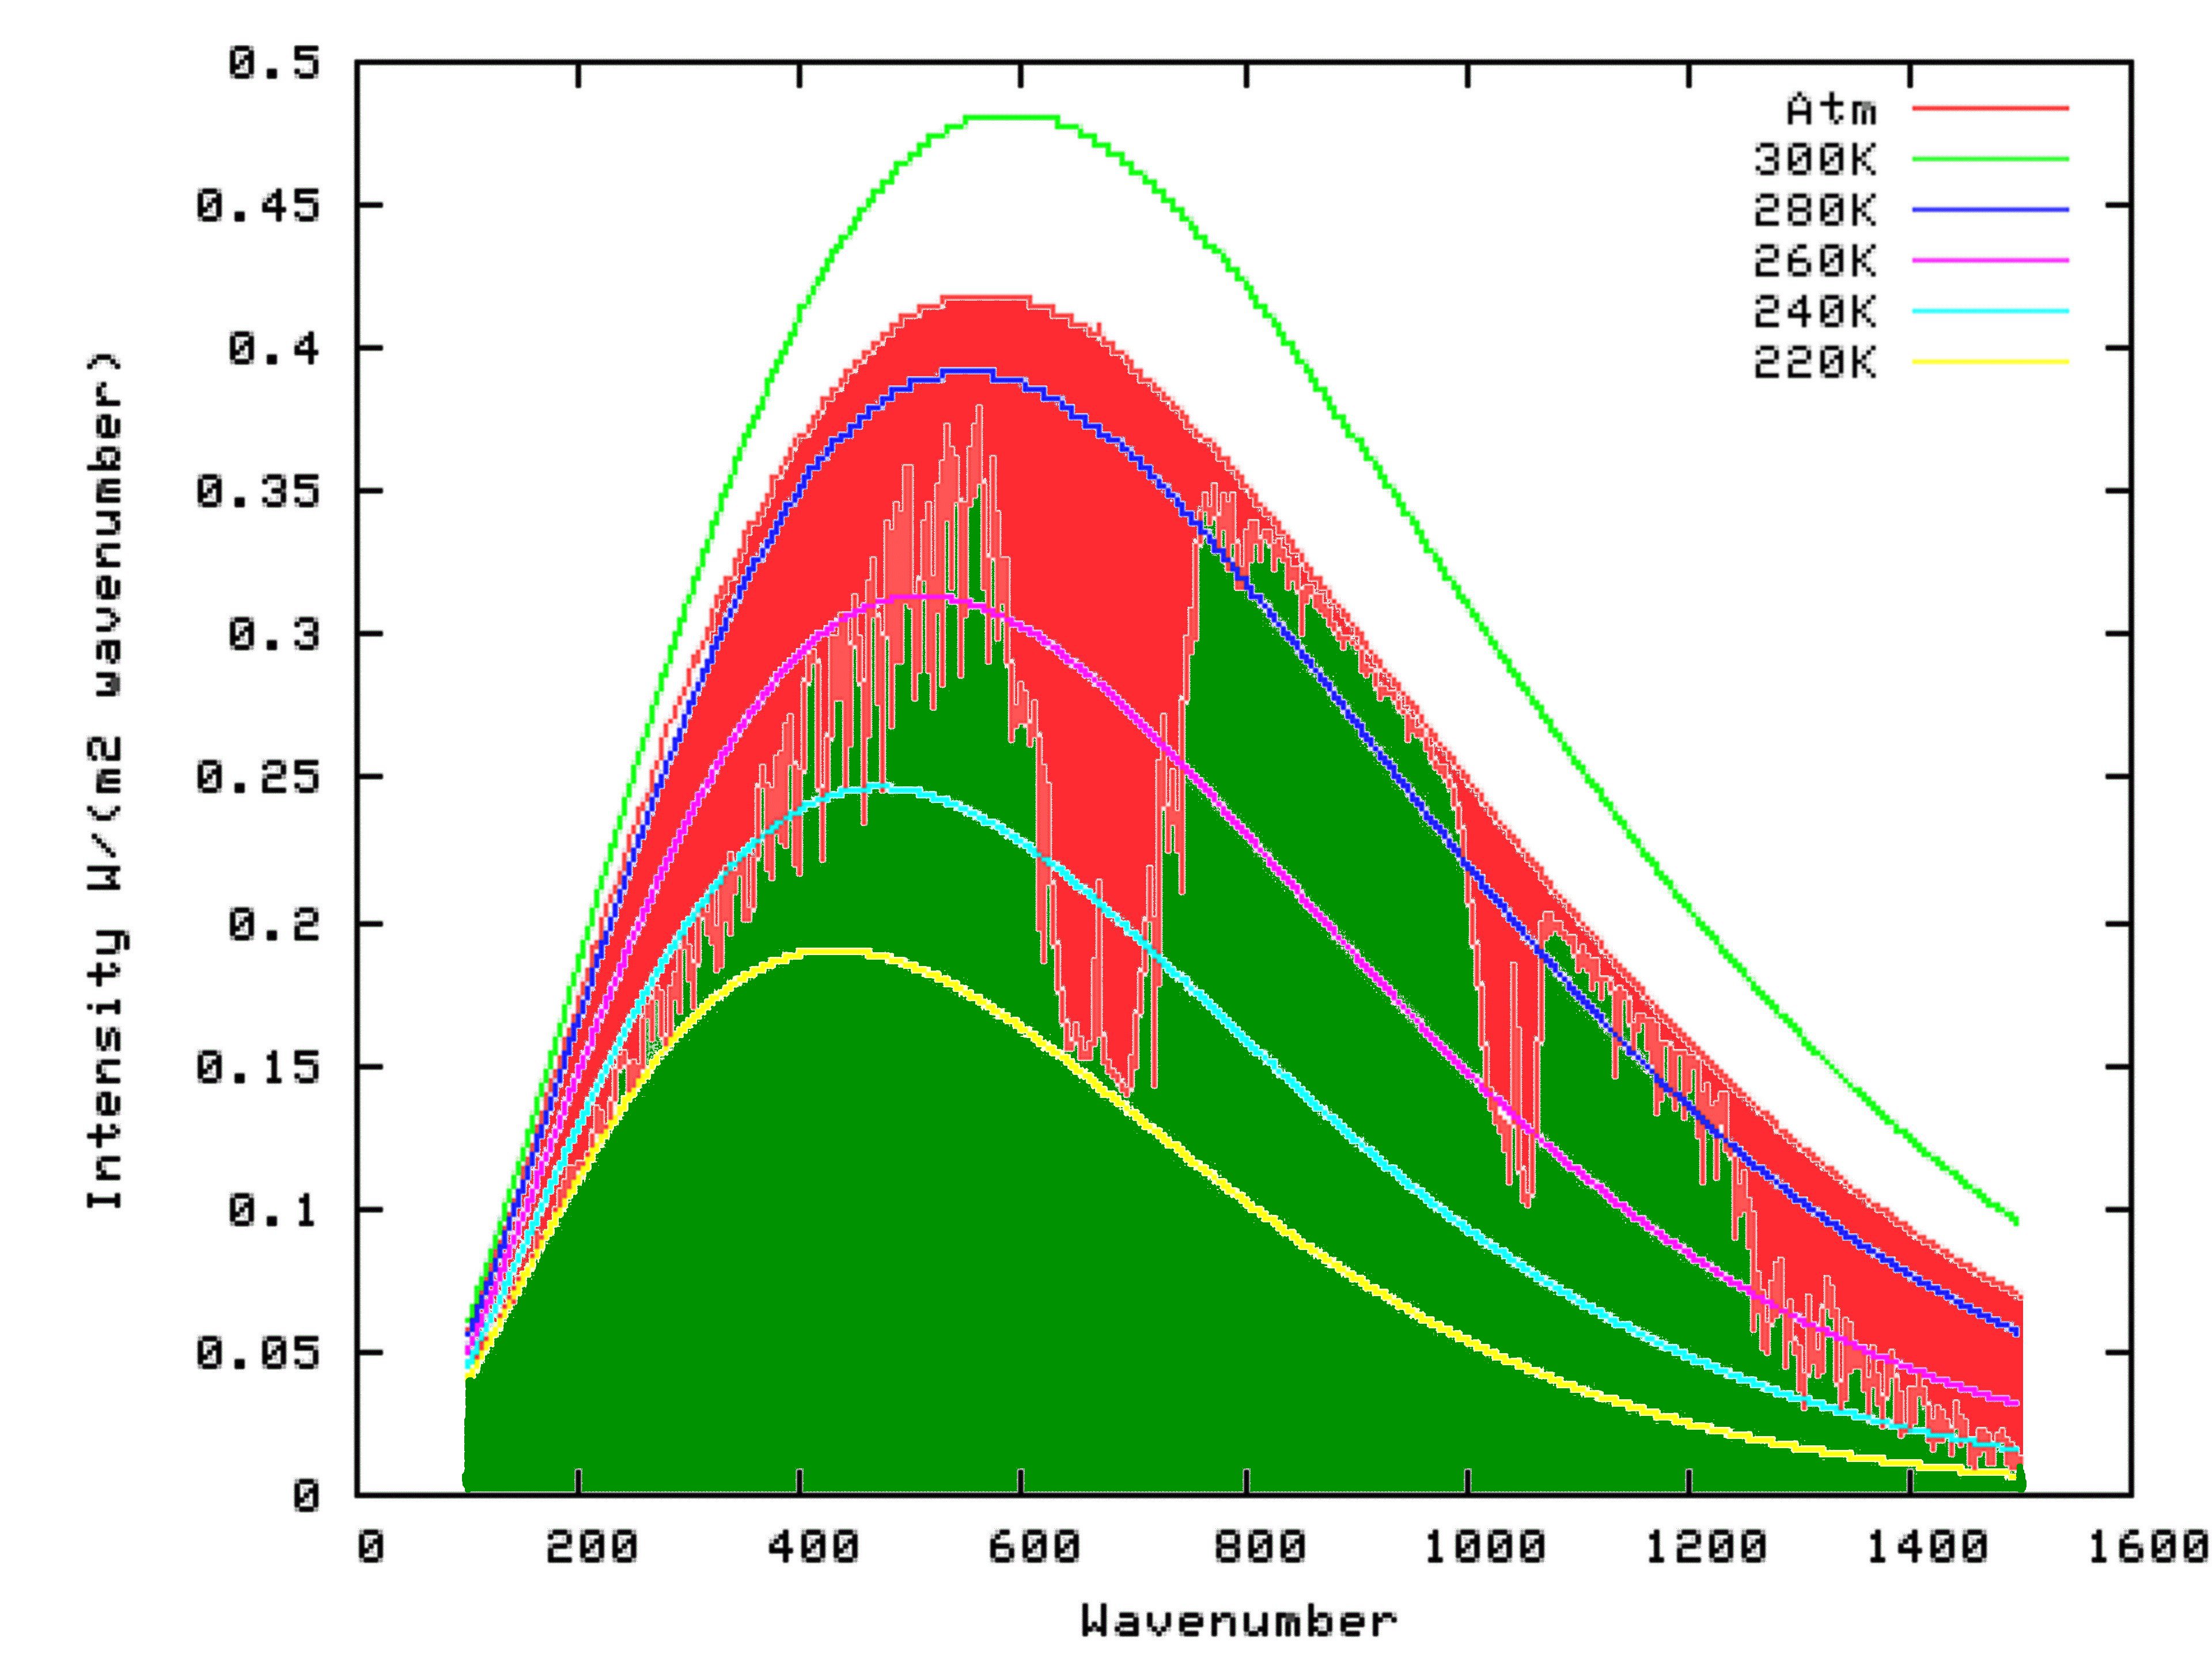
2) Atmospheric Window: You appear to be confused by the "atmospheric window". "Atmospheric windows" are frequencies within the electromagnetic spectrum in which there is almost no atmospheric absorption, so that radiation in the window can go directly from the surface to space (or vise versa). As can be seen in the modtran image below, there is an IR atmospheric window between wavenumbers 800 cm^-1 and 1000 cm^-1, and another smaller window around 1100 cm^-1. As it happens, about 40 W/m^2 escapes from the surface to space through these "atmospheric windows", but they should not be confused with the total radiation to space (236 W/m^2, most of which comes from the atmosphere) or with the atmospheric greenhouse effect.
It is very important that the IR radiation at the TOA is less than that at the surface only because greenhouse gases absorb outgoing IR radiation; and because those gases are cooler than the surface, so that when they emit IR radiation it has a reduced flux. It is also important to recognize that the TOA flux can only be smaller because energy absorbed by the atmosphere is also transferred to the surface. Without the energy transfer to the surface both the reduced flux at TOA, and the flux at the surface greater than solar radiation absorbed would violate conservation of energy. As it happens, the energy equations do balance (see diagram above). The energy transfer from atmosphere to surface is in the form of back radiation, but could be in another form and you would still have a greenhouse effect.
2) Atmospheric Window: You appear to be confused by the "atmospheric window". "Atmospheric windows" are frequencies within the electromagnetic spectrum in which there is almost no atmospheric absorption, so that radiation in the window can go directly from the surface to space (or vise versa). As can be seen in the modtran image below, there is an IR atmospheric window between wavenumbers 800 cm^-1 and 1000 cm^-1, and another smaller window around 1100 cm^-1. As it happens, about 40 W/m^2 escapes from the surface to space through these "atmospheric windows", but they should not be confused with the total radiation to space (236 W/m^2, most of which comes from the atmosphere) or with the atmospheric greenhouse effect.
 As noted in section one, the atmospheric greenhouse effect is the difference between the upward IR radiation from the surface and the upward IR radiation to space from the Top of the Atmosphere. Doubling CO2 concentration creates a radiative forcing of 3.7 W/m^2, ie, it reduces the IR radiation to space by 3.7 W/m^2. The reduced upward flux at the TOA creates an energy imbalance which warms the Earth until the imbalance ceases to exist. Ignoring all feed backs, that requires a warming of approx 1.1 C at the surface to accomplish; or in other words an increase in the upwards IR flux at the surface by about 6 W/m^2. Because equilibrium is reached (ignoring feedbacks), the upward IR flux at the TOA will have returned to 239 W/m^2, so a radiative forcing of 3.7 W/m^2 will have caused a total change in the net atmospheric greenhouse effect of 6 W/m^2. In practice, the net change will be approximately two to three times that amount, with much of the increase attributable to the water vapour feed back.
This may seem confusing, but only if you mistake radiative forcing, ie, the net change in TOA radiative flux before temperature adjustments with the net atmospheric greenhouse effect, ie, the difference between surface and TOA upward IR flux. Unfortunately, that is a mistake I made in my previous post @134. I apologize for any confusion I have caused as a result.
3) Increased CO2: Increasing CO2 in the atmosphere widens the large valley in outgoing radiation between 600 and 700 cm^-1 (see modtran graph above). To maintain equilibrium, the total area of the graph, which represents the total upward flux, must remain constant. Because the area is reduced near 600 and 700 cm^-1, it must be increased elsewhere, including in the atmospheric windows. As the upward flux in the atmospheric windows comes from the surface, this means the surface temperature must increase. Consequently your assumption that most of the warming would occur in the atmosphere (ignoring feed backs) is mistaken.
As noted in section one, the atmospheric greenhouse effect is the difference between the upward IR radiation from the surface and the upward IR radiation to space from the Top of the Atmosphere. Doubling CO2 concentration creates a radiative forcing of 3.7 W/m^2, ie, it reduces the IR radiation to space by 3.7 W/m^2. The reduced upward flux at the TOA creates an energy imbalance which warms the Earth until the imbalance ceases to exist. Ignoring all feed backs, that requires a warming of approx 1.1 C at the surface to accomplish; or in other words an increase in the upwards IR flux at the surface by about 6 W/m^2. Because equilibrium is reached (ignoring feedbacks), the upward IR flux at the TOA will have returned to 239 W/m^2, so a radiative forcing of 3.7 W/m^2 will have caused a total change in the net atmospheric greenhouse effect of 6 W/m^2. In practice, the net change will be approximately two to three times that amount, with much of the increase attributable to the water vapour feed back.
This may seem confusing, but only if you mistake radiative forcing, ie, the net change in TOA radiative flux before temperature adjustments with the net atmospheric greenhouse effect, ie, the difference between surface and TOA upward IR flux. Unfortunately, that is a mistake I made in my previous post @134. I apologize for any confusion I have caused as a result.
3) Increased CO2: Increasing CO2 in the atmosphere widens the large valley in outgoing radiation between 600 and 700 cm^-1 (see modtran graph above). To maintain equilibrium, the total area of the graph, which represents the total upward flux, must remain constant. Because the area is reduced near 600 and 700 cm^-1, it must be increased elsewhere, including in the atmospheric windows. As the upward flux in the atmospheric windows comes from the surface, this means the surface temperature must increase. Consequently your assumption that most of the warming would occur in the atmosphere (ignoring feed backs) is mistaken.
-
ChrisJJ at 10:16 AM on 19 January 2013Skeptical Science and social media - Ask not what SkS can do for you, but what you can do for SkS
Yes, I agree with pbjamm. I realise you can't do everything at once, but Google+ is quite large now, 500 million users to Facebook's 1000 million. G+ is still growing fast, FB is showing signs of struggling. At the very least set up an account before someone else takes the name. Do that now, today, right away. Come back and develop it later but secure the name now. -
John Russell at 09:32 AM on 19 January 2013Skeptical Science and social media - Ask not what SkS can do for you, but what you can do for SkS
I was very sceptical of Twitter for several years, believing it was just used for inane chat. Then I spoke to someone who explained their use of it. I was intrigued; and not too long ago I signed up. I then discovered that in fact Twitter is whatever you want it to be. My approach is to focus, choose a range of complementary subjects to tweet about and don't be tempted to stray into areas where one group of your followers will be put off by what another group is discussing. As an extreme example; don't tweet about climate change and about your love of drag racing; or your belief in creationism and your support for abortion. You get the drift. Next; only follow people that discuss things you are really interested in and who are consistent (see para above). Following other people just because they've followed you is tempting but ultimately just clogs your in-box. Last; keep the standard of your tweets as high as you can. By which I mean original, interesting, informative and occasionally funny. You'll be rewarded with a good band of followers: quality not quantity. Hey, I've just 193 as I write, but they include 24 scientists; 31 journalists; 15 climate scientists; oh, and 3 people who are, let's say 'in denial' (one can't have everything). So jump on in if you've not tried already. The main benefit is that if something happens that's important to your interest areas, you'll hear about it within minutes of the news breaking. Who knows, you might be instrumental in making the news. If you have an original thought or stumble across some interesting info and tweet it (like I just did about this SkS post!), there's a lot of pleasure in seeing a top journalist or climate scientist re-tweeting it within seconds. So please follow me @JohnRussell40 -
JoeT at 08:49 AM on 19 January 2013Ridley, Murdoch, and Lomborg Attempt to Greenwash Global Warming
As a follow-up to my post above, I did a cursory search for papers by Myneni to see if he ever wrote anything suggesting that carbon fertilization is responsible for the greening of the planet as suggested by the Ridley article. I was unsuccessful in finding anything by Myneni, but I did find the following in a paper in which Nemani is a co-author regarding the western Amazon basin: "CO2 fertilization effects were evenly distributed over the course of an entire year, but NDVI did not show such an overall increase. Our results do not exclude the possibility that potential gains in productivity resulting from CO2 fertilization effects were not likely distributed to leaf production; however, we suggest that changes in climate rather than CO2 fertilization effects could explain the increasing trend in NDVI. Specifically, a positive trend in shortwave radiation and negative trend in cloud cover most strongly explain the corresponding increase in NDVI, as our simulations showed that these factors drove a simulated increase in NPP for the same months (from August to December) in which the increases in NDVI have been observed." -
pbjamm at 08:28 AM on 19 January 2013Skeptical Science and social media - Ask not what SkS can do for you, but what you can do for SkS
Don't forget G+! -
smerby at 07:42 AM on 19 January 2013Resolving Confusion Over the Met Office Statement and Continued Global Warming
Thanks for the insight, Smerby -
John Hartz at 07:28 AM on 19 January 2013Ridley, Murdoch, and Lomborg Attempt to Greenwash Global Warming
Ruppert Murdoch’s transformation from a climate hawk to a climate skeptic Is nicely covered in: Has Rupert Murdoch turned into a climate change sceptic? by Ian Burrell, the Independent, Jan 11, 2013 Like Dana’s excellent OP, this article was precipitated by Murdoch’s recent tweet about Ridley’s op-ed. -
AlanSE at 05:50 AM on 19 January 2013Water vapor is the most powerful greenhouse gas
Thanks for your replies @KR, @Tom Curtis, @Bob Loblaw. I'm much further in my understanding. Here is my understanding: all the number we've talked about are TOA values. The graph I linked to (albeit outdated) gives the change in TOA from pre-industrial to future concentrations. This would be the change in the heat flux through the atmospheric window. We'll say that number is 7 W/m^2 for a change to 1000 ppm. Then the currently discussed 32 W/m^2 is the figure for radiative forcing from all CO2. Actually, it's a little more complicated since the absorption overlaps with other gases, and without the cross-correlation the paper gives 29 W/m^2. My understanding is that if you removed CO2 from the atmosphere entirely you would increase the flow through the infrared window by the 29 number. This now makes sense to me because the differential power of adding CO2 is much much greater at lower concentrations. The entire infrared window seems to be 40 W/m^2. So if industrial emissions decreases this by 7 W/m^2, we're left with 32 W/m^2. Now I have to revise my picture of the change in temperature to compensate. I previously considered an increase in surface temperature as compensating for the additional radiative forcing. Now it seems that most of this would come from a higher temperature of the atmosphere. If you look at this reference: http://www.sierrapotomac.org/W_Needham/TheGreenhouseEffect.htm You can see that longwave radiation from the atmosphere into space is 235 W/m^2, whereas the longwave directly from the surface is only that paltry 40. So as we increase CO2 the former number will increase much more. I'm still holding the assumption that the surface and atmosphere will increase in temperature by similar amounts from AGW. It's just that the additional radiation that compensate for it will mostly come from the atmosphere. Is there anything wrong with this picture? Of course, I haven't gotten into anything about feedback effects. -
JoeT at 04:56 AM on 19 January 2013Ridley, Murdoch, and Lomborg Attempt to Greenwash Global Warming
Excellent article with a lot of good references to follow up on. I'm also looking forward to the follow-up article on carbon fertilization. I finally read the Ridley article about which I have a question. He says: Dr. Myneni reckons that it is now possible to distinguish between these two effects in the satellite data, and he concludes that 50% is due to "relaxation of climate constraints," i.e., warming or rainfall, and roughly 50% is due to carbon dioxide fertilization itself. I noticed that '50% is due to carbon dioxide fertilization' is not a direct quote from Myneni. I was wondering if anyone followed up to see whether Myneni actually said this? I find it hard to believe that any scientist would make such a blanket statement without a large number of caveats. And if by chance Myneni did say this, what in the world is the method by which he came to this conclusion? Is it published or just a wild guess? What's the error bar on that 50%? Also, was anyone able to find the "online lecture last July by Ranga Myneni of Boston University, confirms that the greening of the Earth has now been going on for 30 years"? I came up short. -
Bob Loblaw at 03:50 AM on 19 January 2013Resolving Confusion Over the Met Office Statement and Continued Global Warming
smerby: To parallel Dikran's answer, the tautological answer to "should it not have a little significance?" is to test the significance - which in statistical terms means doing statistical tests, not using the eyecrometer. ...but let's step back a bit and think about what a trend line is telling us. What does it really mean to "fit a linear trend"? To begin, go even further back in the thought process, and say "what is happening to the data in this period? 1) our first step in an analysis might be to say "what is the mean (average) temperature in this time period?" We can get a number, but we know that not all values will match the mean. So the next step is usually to calculate the variance or standard deviation, which involves looking at each temperature and how it compares to the mean (then square the differences, sum for all T, etc.). These are the residuals - how much each temperature is different from the mean. Note that the value of X (time, in this case) is not used. 2) the next step is the linear regression. Basically, a linear regression is based on the idea that the mean value of Y (temperature) changes with X (time), and that the change is linear with time. So a linear trend line is basically just a "moving average". Just as the simple average leaves residuals, so does a line fit to the data. The significance of the line fit depends on how well is reduces the size of the residuals. This reduction shows up as the r^2 value in a regression result. The actual significance test requires seeing whether this reduction is likely to happen by chance, due to random variation in the data. Note that a linear regression does not require any physical reasoning as to why the trend might be linear - it's just a common first step. There is the "correlation isn't causation" effect to account for. At this point, X and Y are just numbers that don't mean anything (or, rather, could mean a lot of things). 3) let's go one step further. Let's create a different description of how the mean temperature varies with time (or how Y depends on X). Instead of a simple linear relationship, we can make T change over time using any combination of factors - the only catch being that we have to be able to specify those factors at each time, too. Let's assume we can do that - so we end up calculating T over time. Once again, we can compare those calculated values to the actual temperatures (calculated "moving averages", just as we did when we performed our linear trend calculations, or as we did when we just used the simple mean. Once again, we'll end up with residuals (differences between actual observations and our calculated values), and we can see if the residuals are smaller. We can also do significance testing on that reduction. One advantage of approach 3) over 2) is that we can start to make our "moving average" depend on known physics, instead of a simplistic linear fit. We can add different bits of "known physics" and see how much they improve the fit (reduce the residuals). This makes an end run around the "correlation isn't causation" issue, because we are already working with factors that we are fairly sure have at least some cause-effect relationship. We may not know how much the effect is, though, and that is why doing the calculation and comparing to the data is important. How difficult is approach 3)? Harder than doing a linear fit, but not necessarily by much. If approach 3) involves a full-scale 3-d general circulation model, then it's a lot of work. ...but we have an example of a much simpler application of approach 3) in Kevin C's comments and graphs present here - especially in #118. Ask yourself: does the simple, naive linear fit do a good job of following all the bumps and wiggles in the temperature data based on the implicit assumption that something linear is happening (but we don't know what - just that we think it might be linear)? Or does Kevin's 2-box model that incorporates some known physics in a fairly simple way do better? ...and if Kevin's model (yes, it's a model, but so is a linear regression) is doing better, then what does his fit to the data tell you about the "significance" of the temperatures over the past 10-15 years? More importantly, what do you think it tells you about the role of CO2? -
John Russell at 02:52 AM on 19 January 2013Ocean Heat Came Back to Haunt Australia
As someone not in the first flush of youth, I can remember phrases like "the same amount of energy as 3 Hiroshima bombs" being used throughout my life; ie back to the 50s and 60s. Thus I would suggest that the unit of the 'Hiroshima Bomb' has been around since the late 40s. I can remember Apollo rocket launches being described in 'HB's. I found this reference from the UK Parliament's Hansard dated 1990 (just under the words 'Column 332'). It relates to the fire on the Piper Alpha gas platform; "the release of energy must have approached the scale of the Hiroshima bomb". -
Rob Honeycutt at 02:27 AM on 19 January 201316 ^ more years of global warming
Funny how so few of them are willing to come here and discuss it. Go figure. -
Kevin C at 02:18 AM on 19 January 2013Ridley, Murdoch, and Lomborg Attempt to Greenwash Global Warming
Terranova: You are certainly thinking along the right lines. There is a long literature on the relationship between El Nino and/or temperature and CO2 uptake, e.g. Barcastow 1976. The rate of CO2 change in the atmosphere lags the temperature change, showing that temperature or El Nino are driving the effect. This has fooled some skeptics who haven't read this literature (e.g. Humlum) into thinking that temperature is causing CO2 emission, when in fact the emissions have been more steady and the rate of uptake has varied. -
dana1981 at 02:17 AM on 19 January 2013Ridley, Murdoch, and Lomborg Attempt to Greenwash Global Warming
Terranova - yes, that's correlation, not causation. As noted in the post, Zhao and Running made a convincing case that the causation has more to do with increasing drought. -
Dikran Marsupial at 02:00 AM on 19 January 2013Resolving Confusion Over the Met Office Statement and Continued Global Warming
@smerby wrote "The global surface surface temperature trend of the last 10 years is insignificant when compared to the long term record. Should it not have a little significance when compared to a 30 year trend or a climate cycle, it is 1/3 of that period, just a question." I'm afraid this question makes very little sense, largely because your usage of "significance" is unspecified, and at variance with the usual statistical meaning. Perhaps if you are uncomfortable with statistics, it would be better if you avoided terms with statistical meanings, such as "significant"? -
Kevin C at 01:57 AM on 19 January 2013Resolving Confusion Over the Met Office Statement and Continued Global Warming
These images may help. The first I've shown before, and is the 2-box+ENSO model fit of forcings to temperatures. Here is the same thing, but with the ENSO contribution subtracted out from both the temperature series and model.
 And here it is again, this time with ENSO, volcanoes and solar subtracted out.
 A few comments on the features.
- The spike right at the beginning is an artifact of the calculation and is meaningless.
- There is a slight predicted slowdown in warming around the early 90's, related to a slowdown in methane emissions (which have recently picked up again), but also to the regulation of CFCs following Copenhagen. It is probably too small to detect in the temperature data.
- The largest remaining features are spikes around the second world war. The 1942-45 spike and following dip are at least in part due to the fact that GISTEMP does not yet include corrections for the change in sea surface temperature measurement methods after 1945. The pre-1940 spike is unexplained.
-
smerby at 00:24 AM on 19 January 2013Resolving Confusion Over the Met Office Statement and Continued Global Warming
Hi all, thanks again for the feedback. Although it may seem otherwise, I really am learning here. I do have a lot of questions and I appreciate all the help. The global surface surface temperature trend of the last 10 years is insignificant when compared to the long term record. Should it not have a little significance when compared to a 30 year trend or a climate cycle, it is 1/3 of that period, just a question. Based on some of your feedback, the global surface temperature record has varied against the back drop of continuous AGW, especially from the middle of last century when production of GHG emissions has accelerated. The multi decadal cooling and warming of the Pacific ocean has also lined up well with these temperature variations, in addition to trends in La Ninas and El Ninos. The slight cooling from the 1880s into the early 1900 hundreds was from the after effects of Krakatoa and a couple of impressive La Ninas. The warming from 1910 through the early 1940s was from an increase in GHG, low solar and low volcanism. In addition, there was a warm phase of the Pacific and increasing El Nino and decreasing La Ninas. The leveling off in the 50s, 60s, into the mid 70s, was from increased aerosol emission along with cooler Pacific and a decrease in El Ninos and an increase in La Ninas. The warming from the late 1970s through the 1990s was from a decrease in aerosol emissions and an increase of GHG. In addition the Pacific was in a warm phase with an increase El Ninos and a decrease in La Ninas. The leveling off of the past 10 years was from low solar and a cooler Pacific with an Increase in La Ninas and a decrease in El Ninos.Moderator Response: TC: Final sentence corrected by request. -
Terranova at 22:36 PM on 18 January 2013Ridley, Murdoch, and Lomborg Attempt to Greenwash Global Warming
I wondered if there might be a connection between temperature and plant growth (greening). So, I went to woodfortrees.org and generated the below graph. I am not skilled enough with graphics to do an overlay, but this looks close enough to make one wonder if there is a link. But, then we would get into the correlation/causation dialogue.Image from www.woodfortrees.org
 Moderator Response: [RH] Can I ask you to please insert into your links this bit of html: width="500" If you do this it will keep your images from breaking the page formatting.
 -
Tom Curtis at 21:22 PM on 18 January 2013Ridley, Murdoch, and Lomborg Attempt to Greenwash Global Warming
jhoyland @26, the Houghton figures are for direct human effects on the biosphere alone. Those include deforestation, reforestation, and agricultural practices. They do not include indirect effects such as CO2 fertilization, increased growth due to increased sunshine, or water etc. Consequently there is no contradiction between Houghton, which shows the net direct human impact on the biosphere is a carbon source, and the O2 data which shows that despite that, net natural and indirect human factors draws down more CO2 from the atmosphere than direct human impacts cause in emissions. -
jhoyland at 18:39 PM on 18 January 2013Ridley, Murdoch, and Lomborg Attempt to Greenwash Global Warming
Tom @24. I'm a bit confused - you say the biosphere is a net sink but reading the graphs in Houghton article it looks to me like the flux is positive (carbon to the atmosphere). Am I missing something? -
macoles at 17:04 PM on 18 January 2013Accumulated Cyclone Energy Questions and Answers
Thanks Rob and Mike. The chart in your 02 Nov 2012 article link shows a huge difference between low intensity high IKE cyclone Sandy, and high intensity low IKE cyclone Charley. Really shows the limitations of ACE as a proxy for destructive storm seasons. -
Doug Hutcheson at 16:53 PM on 18 January 201316 ^ more years of global warming
Wow! The denier zombie hordes have kept me busy linking to this post at other venues, so much so that I have now saved it in my bookmarks. Thanks for providing such a good resource. -
Mikemcc at 16:39 PM on 18 January 2013Accumulated Cyclone Energy Questions and Answers
There's a fairly clear article in the Washington Post related to IKE Article 02 Nov 2012 -
smerby at 16:23 PM on 18 January 2013Resolving Confusion Over the Met Office Statement and Continued Global Warming
Thanks all for the feedback Smerby -
mshea at 16:15 PM on 18 January 2013Debunking Climate Myths from Politicians
Surely acting Opposition Leader Warren Truss gets a mention for these two.... ''Indeed I guess there'll be more CO2 emissions from these fires than there will be from coal-fired power stations for decades,'' IT'S ''utterly simplistic'' to suggest there's a link between climate change and Australia's heatwave and bushfire crisis, acting Opposition Leader Warren Truss says. AAP January 09, 2013 -
Rob Honeycutt at 13:01 PM on 18 January 2013Accumulated Cyclone Energy Questions and Answers
Yes. It's called IKE. Integrated Kinetic Energy. With IKE they actually measure wind speeds in different quadrants and at different distances from the eye. -
macoles at 12:38 PM on 18 January 2013Accumulated Cyclone Energy Questions and Answers
Is there an alternative metric to ACE that accounts for both size and intensity? While a cyclone's size may be somewhat reflected by its duration (and therefore give higher ACE values than smaller ones of the same intensity), its energy content is just as much a square of its diameter as its velocity. It seams to me the media reported sizes of cyclones is getting bigger. http://en.wikipedia.org/wiki/Accumulated_cyclone_energy -
littlerobbergirl at 10:08 AM on 18 January 2013Ridley, Murdoch, and Lomborg Attempt to Greenwash Global Warming
Did I miss the bit were we found out how much of this greening is actually due to CO2? Rather than changes in land use eg tree planting in uk, Sahel, abandoned farmland in Russia (looking very green there - I hear chernobyl is really beautiful now) etc? And what about mycorrhiza? Increases in fungal networks through temp rises (until it gets too hot) surely lead to faster growth of their plants? And temp itself in cold places, longer growing season very evident here in uk. How do we unpick these? -
Tom Curtis at 08:48 AM on 18 January 2013Ridley, Murdoch, and Lomborg Attempt to Greenwash Global Warming
jhoyland @22, the total carbon flux from the biosphere due to the direct activities of humans was estimated by Houghton 2005 (revised) as follows:"The estimated global total net flux of carbon from changes in land use increased from 500.6 Tg C (1 teragram = 1012 gram) in 1850 to a maximum of 1712.5 Tg C (or 1.7 Pg C, where 1 petagram = 1015 gram) in 1991, then declined to 1409.9 Tg C (1.4 Pg C) in 2000, and rose slightly to 1467.3 Tg C (or 1.46 Pg C) in 2005. The global net flux during the period 1850-2000 was 148.6 Pg C, about 55% of which was from the tropics. During the period 1990-2005, the greatest regional flux was from South and Central America (11.3 Pg C). The global total flux averaged 1.5 Pg C yr-1 during the 1980s and 1.56 Pg C yr-1 during the 1990s (but generally declining during that latter decade), dominated by fluxes from tropical deforestation. The global total flux averaged 1.47 Pg C yr-1 during the period from 2000-2005."
To put that into perspective, one Petagram (Pg = 10^15 grammes) is one billion metric ton, and the equivalent of 0.47 ppmv. As it happens, annual emissions from LUC do not drop below the (smoothed) annual atmospheric increase until the 1950s. In recent decades, however, studies in the difference between oxygen depletion and CO2 accumulation have shown that the biosphere is a net sink of carbon (See diagram below). That means total CO2 absorption be regrowth of forests in North America and the old world combined with increased agricultural activity, increased water supply and the CO2 fertilization effect have generated more biomass than deforestation in third world nations has depleted.
-
bath_ed at 08:06 AM on 18 January 2013Ridley, Murdoch, and Lomborg Attempt to Greenwash Global Warming
prestrud @ 15 - I agree, greening is not necessary a good thing as far as nature is concerned. At the risk of straying into the philosophical, we are not so much concerned with the optimum conditions for life in the most general sense as with the conditions that specific life forms have evolved to live in. For example, a desert is a much harsher environment for life in general than a rainforest, but "green" a desert to rainforest conditions and most of its unique plants and animals would surely perish. Would that be a good thing? I am reminded of many of the rarest plants of the British Isles that grow on nutrient-poor grasslands: apply artificial fertilisers and instead of flourishing, the rare wildflowers are rapidly out-competed by common, vigorous-growing plants usually thought of as weeds such as coarse grasses, nettles and thistles. -
Tom Curtis at 07:53 AM on 18 January 2013Ocean Heat Came Back to Haunt Australia
meher engineer @15, even supercell thunderstorms only dissipate about 17 Terrawatts, or about 0.25 Hiroshima bombs per second. Almost none of that energy escapes the Earth, so they do not represent a loss of energy at the surface, only an increase in entropy. -
Kevin C at 07:28 AM on 18 January 201316 ^ more years of global warming
Eon: I'll try and address a couple of questions - firstly whether we can attribute what is left after removing the solar, volcanic and El Nino effects, and secondly whether the method is applicable over other time periods. I've made a lot of use of the 2-box+ENSO model recently, based on Rypdal 2012 (see reference in the advanced rebuttal). My aim is to make this calculation available online, but it's not ready yet. However, the results are relevant. This trivial model empirically fits temperatures to forcing with no physics except causality and a parsimony requirement - and as such is largely independent of the traditional physics based models. (You can also write it in 20-30 lines of code.) Here is what you get if you fit the GISS forcings to the temperature data:
The forcings of course include the volcanic and solar effects, and the El Nino term has been added in as well. The explanatory power for the 130 year record is very good indeed, and the El Nino term, which is critical for the impact on the short term trend, takes on an almost identical value. The model also shows the slowdown in recent warming, for the same reason - the El Nino trend is masking recent warming.
Unfortunately the forcing data is annual and only runs to 2010, so I couldn't use this approach for the video, but it certainly looks as though the longer term data supports a similar conclusion to that of the video. Integrating the two calculations is one of my longer term aims, and will I believe produce a more robust result.
But we can draw some conclusions. The fact that the forcings + El Nino explain the temperature record so well means that the temperature record does not provide an intrinsic reason for introducing other factors.
Could such factors exist? Let's invent such a factor - we'll call it 'climate elves' - and introduce it into the model. In order to be plausible the climate elves would have to operate in such a way that the model still reproduces 20th century temperatures. That eliminates a lot of potential elves (e.g. solar), but not all of them. For example, once the model is online you will be able to see that you can obtain a similar fit with lower sensitivity by reducing the aerosol term. We also can't rule out a long term ocean oscillation.
However, this calculation does not exist in isolation. For example the physical models, the glacial cycles, and climate on deep time all have things to say on this question. Suppose we introduce aerosol elves to reduce the aerosol effect and so climate sensivity, then we have to first reconcile this with the physical models. More seriously it becomes harder to explain the glacial cycle or indeed other paleoclimate features. If we reduce sensitivity too much then we can't even explain the observed volcanic cooling events.
Therefore while I expect climate elves exist (most likely in the form of an error in the aerosol term which could go in either direction, and maybe a long term ocean oscillation), the impact is unlikely to be very large. (And even a climate sensitivity of 2C(x2 CO2) rather than the consensus 3C doesn't buy us very long.)
Thus, given that the consensus estimates of climate sensitivity are based on a wide range of different sources of information, and both the simple and physical models explain the 130 year record with similar sensitivities, there is significant evidence basis to support current estimates of anthropogenic forcing. The scale of the natural and anthropogenic forcings are linked through the temperature record and the response function, and thus I think the statement in the video that 'what is left is the human contribution' is a fair assessment of the current state of knowledge.
-
Glenn Tamblyn at 07:09 AM on 18 January 2013Ocean Heat Came Back to Haunt Australia
JC @10 The use of the HB reference in the Science guide came about as a result of a suggestion I made to you John. However I certainly can't claim primary source, others have used the idea as well and actually coined the term Hiro as a unit of measure. I think Ben Sandiford may have used it (the Hiro) sometime ago. It's one of those ideas that probably originated many times indepenently. People looking for a way to express a number that makes other peoples eyes glaze over otherwise. And just asking themselves a question - 'How big is an Atom Bomb' - will lead to this. -
jhoyland at 07:05 AM on 18 January 2013Ridley, Murdoch, and Lomborg Attempt to Greenwash Global Warming
A plant is eventually eaten by an animal where its carbon is metabolized to carbon dioxide or else it dies and rots producing methane and organic compounds which get moved into the next generation of plants. Presumably the only thing that really matters then for climate change is if the total global biomass changes since its only while the carbon is locked in living matter that it is out of the atmosphere. I can't imagine a hectare of grass contains more carbon than a hectare of rainforest and given the scale of deforestation and desertification over the same period we've been burning our way through our fossil fuels I would have thought that that huge biomass loss would far outstrip any changes in food crop yields. What is the research on total global biomass as relates to climate change? -
dana1981 at 05:13 AM on 18 January 2013Ridley, Murdoch, and Lomborg Attempt to Greenwash Global Warming
ajki @13 - thanks. I think the 'greening' myth has been around for a while, probably since the Nemani (2003) NPP research. prestrud @15 - good point, greening isn't necessarily beneficial, depending on where it happens. Arctic greening will change that ecosystem, but will also add to overall global greening. As the post notes, it's just not nearly as simple as Ridley/Murdoch/Lomborg are trying to make it. -
Flakmeister at 05:00 AM on 18 January 20132012 Shatters the US Temperature Record. Fox, Watts, and Spencer Respond by Denying Reality
Re: 29 I hear ya.... I do tip my cap, SKS does an excellent and even handed job of moderation and it is a tough job... -
shoyemore at 03:49 AM on 18 January 2013Ridley, Murdoch, and Lomborg Attempt to Greenwash Global Warming
Cugel #9, You are right. The most dangerous words ever spoken are "This time it's different". From a dot.com boom refugee. :) -
Flakmeister at 03:11 AM on 18 January 20132012 Shatters the US Temperature Record. Fox, Watts, and Spencer Respond by Denying Reality
Re: Moderator response in 27: You do realize that noting the obvious edit is funnier and perhaps more effective at conveying the gist of the joke in the acronym than the original acronym... I do concur that WUWT is now unreadable (even for laughs) as it has descended to being a glorified echo-chamber... With this latest nonsense Tony Willard may have finally jumped the shark... One can only hope..Moderator Response: [RH] Rock and a hard place, I guess. -
vrooomie at 02:50 AM on 18 January 2013Ridley, Murdoch, and Lomborg Attempt to Greenwash Global Warming
A quote, from The New Phytologist, addresses this: "Results for predictions of the effects of elevated [CO2] on primary production are more mixed, but are generally less than a 20% increase in NPP based on the β-factor approach. The results from FACE sites suggest that a single β is not feasible, at least for global predictive purposes, given differences among ecosystems types and differences in plant responses to elevated [CO2] in combination with other environmental parameters such as water and N availability." Google the title below, to find the article: many, *many* other FACE experiments support this finding. Functional responses of plants to elevated atmospheric CO2 - do photosynthetic and productivity data from FACE experiments support early predictions? -
vrooomie at 02:38 AM on 18 January 2013Ridley, Murdoch, and Lomborg Attempt to Greenwash Global Warming
Alexandre@17, you are correct: Lomborg is as tricky and slippery as denialati (lukewarmistas??) come. Howard Friel's book, "The Lomborg Deception," deftly, if not simply, takes apart Lomborg's suppostions better than any other source I've found. -
Alexandre at 00:30 AM on 18 January 2013Ridley, Murdoch, and Lomborg Attempt to Greenwash Global Warming
Lomborg is a more refined denier. He even denies that he denied anything. He does not say "global warming is a hoax". He says science is often right, progressing, but you know, CO2 is plant food, and sea level stopped rising, and poor countries rely on fossil fuels to develop themselves, and so on. An articulate obstructionist and public misinformer, this one. If you pay enough attention, you can spot the usual bottomline: whatever you do, don't touch the market of fossil fuels. -
Glenn Tamblyn at 00:19 AM on 18 January 2013Ridley, Murdoch, and Lomborg Attempt to Greenwash Global Warming
LRG @7 " can I live on pure sugar?". Yep,no problem. How long were you planning on living? That's a bit harder. Moving on to C3 vs C4. Research programs to try and transpose the C4 gene complex into C3 plants is one of those Big Ideas out there. Big because it isn't about transferring a single gene. Rather an intricate complex of gene's neededto produce the entire architecture of C4. Not a small under-taking. RADICALLY not a small under-taking. But a huge pay-off if it can be done. Similarly efforts to transfer the capacity for Nitrogen Fixation into other plants. A Doddle surely. Just all the genes needed to provide/support a complete life-support system for a symbiotic organism. No Problemo So both really hard. But the pay-off is massive. -
meher engineer at 23:20 PM on 17 January 2013Ocean Heat Came Back to Haunt Australia
Bill@13 wrote "it's a great way to capture people's attention". True. To begin capturing it you could refer to a much more familiar natural beast, the thunderstorm: its average energy content equals that of 50 Hiroshima bombs! The assertion appears in an old (1952) issue of Popular Mechanics, where it is attributed to Dr. Roscoe Brabham,a Univ of Chicago meteorologist. Click Ref.3 in the Wikipedia article on Thunderstorms to get to the issue. The Wiki article is useful in other ways: it lists the average weight of the moisture that the making of a thunderstorm lifts up (500,000 tonnes),and their average diameters ( 24 kms.).Their tops, of course, can touch the tropopause. -
CBDunkerson at 23:03 PM on 17 January 2013CO2 limits will harm the economy
Mal Adapted wrote: "However, the socialized external costs of fossil fuel use we're currently paying don't include things like the death of coral reefs from ocean acidification, the imminent extinction of the polar bear and the costs of weather disasters 50 years from now. These costs will be incurred even if all carbon emission ceases today. It's doubtful that a carbon tax could internalize them." And if we don't get carbon emissions under control then the costs of those future impacts will be even greater. Ergo, a carbon tax paid today to avoid those greater future impacts would indeed internalize some of the future cost. "It's about the costs that have been external to total gross global product until recently, but are now being socialized: groundwater overuse in the Great Plains; overfishing of all seafood stocks; growth of urban areas forcing agriculture onto less productive soils; the list goes on and on." The list goes on and on... and has nothing to do with global warming. You appear to be saying that solving every problem in the world would require vast political and economic changes... and therefor solving global warming would require vast political and economic changes. It is a non sequitur. Global warming can be solved without "radically reordering our economic and political systems". Read the article above for confirmation. -
cRR Kampen at 20:20 PM on 17 January 20132012 Shatters the US Temperature Record. Fox, Watts, and Spencer Respond by Denying Reality
Anthony Watts is no meteorologist. Doesn't even know what a polar low is. -
Dikran Marsupial at 18:28 PM on 17 January 201316 ^ more years of global warming
eon I would have thought it obvious that the answer is "yes, you would expect to see a broadly flat trend plus some noise", as that is directly implied by the statement that there is little evidence to suggest that the "unknown unknowns" have a significant effect. However, one can't say that would apply to ALL time periods and it also leaves open the definition of "plus some noise". Do you agree that the video clearly demonstrates that the apparent hiatus in global mean surface temperatures is adequately explained by volcanic and solar forcing and ENSO, and that once these factors have been accounted for there is little evidence for a reduction in the rate of warming due to the enhanced greenhouse effect. Yes or no? -
citizenschallenge at 18:26 PM on 17 January 2013Ocean Heat Came Back to Haunt Australia
Nice job Rob! You folks really know how to explain the science. Perhaps that's why you're coming under such venomous attacks of late. In any event, I want to thank you for that generous sharing policy - My little blog is just my hobby, it's got to take backseat to all life's other demands. So I tell you, it's really nice to be able to reproduce a beautiful piece of journalism/science/education {whatever you want to call it} with graphics :-) and all, to support some point I'm trying to make. For instance this article makes for a perfect final 'chapter' to my most recent collection. Thank you all ! Peter Link to Peter's "chapter"Moderator Response: [PW] Hot-linked article -
prestrud8125 at 17:58 PM on 17 January 2013Ridley, Murdoch, and Lomborg Attempt to Greenwash Global Warming
Why do you consider increased plant growth to be a positive outcome of global warming? That is a value judgement. Increased plant growth changes ecosystems. For example: According to the latest published results from the satellite based NDVI (Normalized Difference Vegetation Index) instrument, the biomass of the tundra has increased by 20% over the last 30 years. If this continues, large parts of the tundra and alpine ecosystems, including their biodiversity as we know them today, will disappear in a few decades. -
bill4344 at 16:19 PM on 17 January 2013Ocean Heat Came Back to Haunt Australia
Daniel - Gareth thinks not. It would be interesting to determine the origins of this one, as it's certainly a great way to capture people's attention. -
JasonB at 15:59 PM on 17 January 2013Ridley, Murdoch, and Lomborg Attempt to Greenwash Global Warming
Clyde: Response posted on a more appropriate thread.
Prev 986 987 988 989 990 991 992 993 994 995 996 997 998 999 1000 1001 Next


