New Research Finds that Most Monthly Heat Records Today are Due to Global Warming
Posted on 30 January 2013 by dana1981
A new paper published in Climatic Change by Coumou, Robinson, and Rahmstorf (CRR13) examines the increased frequency of record-breaking monthly temperature records over the past 130 years, finding that these records are now five times more likely to occur due to global warming, with much more to come.
"...worldwide, the number of local record-breaking monthly temperature extremes is now on average five times larger than expected in a climate with no long-term warming. This implies that on average there is an 80% chance that a new monthly heat record is due to climatic change ... Under a medium global warming scenario, by the 2040s we predict the number of monthly heat records globally to be more than 12 times as high as in a climate with no long-term warming."
Figure 1: Observed record ratio (the increase in the number of heat records compared to those expected in a world without global warming) for monthly heat records as it changes over time (thin red line is annual data, thick red line smoothed with half-width 5 years). This is compared with predictions from a simple stochastic model based only on the global mean temperature evolution (blue line with uncertainty band directly comparable to the smoothed red curve)
Data and Methods
CRR13 considers the formula for the probability of a record-breaking extreme in a Gaussian (bell curve) time series with a linear long-term warming trend, compared to the much more simplified version of the same formula when there is no warming trend. The paper then examines the ratio of those two equations - the increased frequency of record-breaking extreme heat events in a warming world.
The study uses global surface temperature data provided by the NASA Goddard Institute for Space Studies (GISS) for 1880–2010, in 2° by 2° grids across the globe, excluding polar regions above 70° latitude due to the sparse temperature station coverage there They examine the temperature data for each calendar month of the year.
Results
CRR13 finds that the number of observed heat records is much larger than one would have expected in a climate with no long term warming, and many monthly heat records have been broken over the past decade.
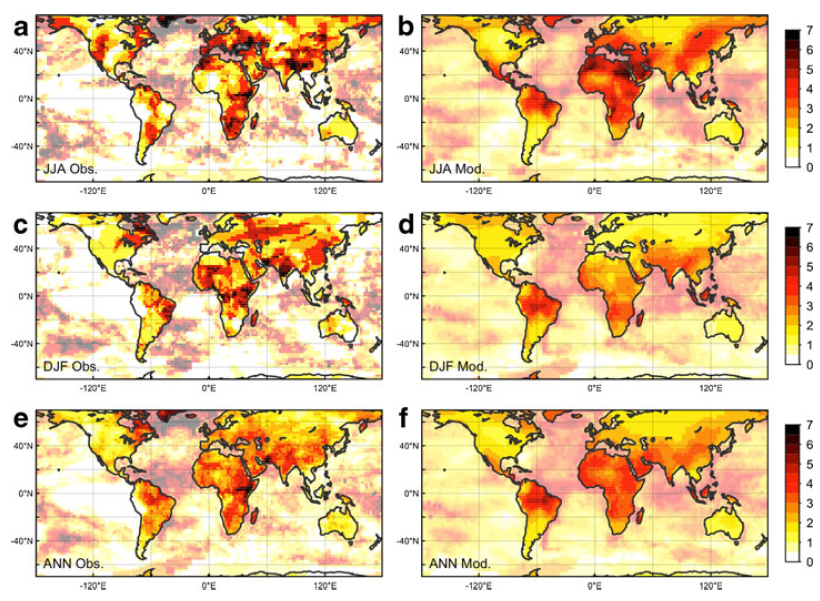
In Figure 2 below, the increase in observed monthly heat records in the past decade over the most recent 40-year period of data (left column) are compared to the modeled results (right column) for northern hemisphere summer (top row), winter (middle row), and the whole year (bottom row).
Figure 2: Global maps of the observed record ratio (the increase in the number of heat records compared to those expected in a world without global warming) as observed (left panels) and estimated by the model (right panels) using the 1971–2010 dataset. a and b show boreal summer results (June-July-August), c and d austral summer results (December-January-February) and e and f results for all months.
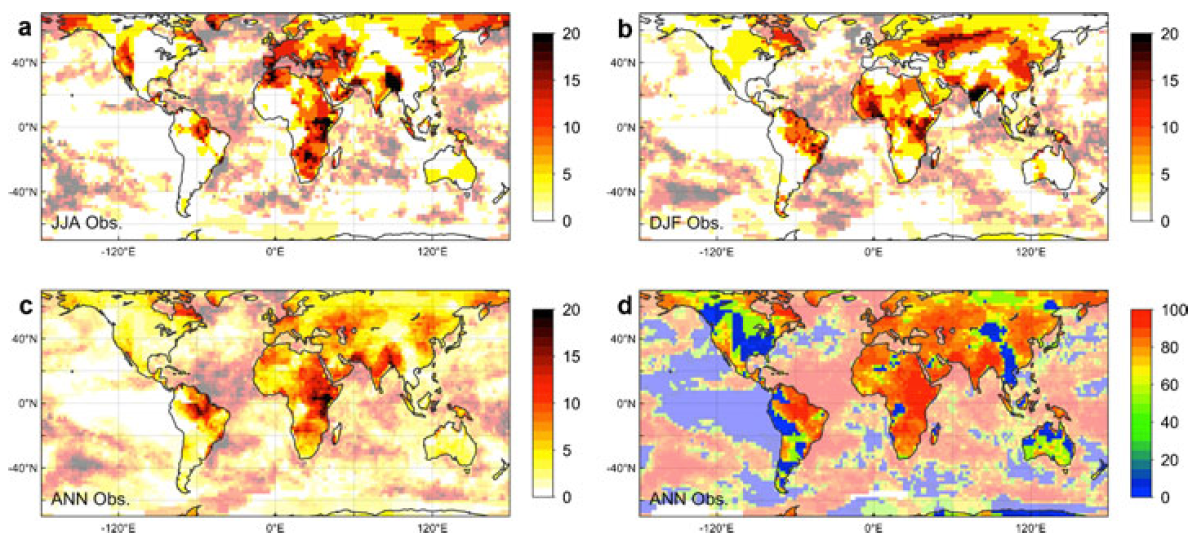
Figure 3 looks at the increase in heat records over the past decade as compared to the full 131-year dataset. The similarity between Figures 2 and 3 shows that over the past decade, the monthly records in the past decade as compared to the past 40 years are usually also records as compared to the past 131 years.
The bottom right panel (d) also shows the probability that a monthly heat record in a given location is due to global warming, with blue indicating 0% probability and red indicating 100%.
Figure 3: Global maps of the observed record ratio over the past decade (the increase in the number of heat records compared to those expected in a world without global warming) over the 1880–2010 dataset, for a boreal summers (June-July-August), b austral summers (December-January-February) and c all months. d Risk map showing the probability that a record-breaking event in the last decade is due to climatic change.
In Figure 1 above, CRR13 extends the model forward assuming global warming based on a moderate emissions scenario, Representative Concentrations Pathway (RCP) 4.5, in which human greenhouse gas emissions peak around the year 2040, ultimately causing a radiative forcing (global energy imbalance) of 4.5 Watts per square meter in 2100 (a doubling of atmospheric CO2 would cause a forcing of about 3.7 Watts per square meter). This scenario would ultimately lead to about 3.6°C global surface warming above pre-industrial levels, which is a very dangerous and possibly catastrophic amount of global warming, but certainly not a worst case scenario. It essentially represents a scenario where we take too-slow and gradual action to reduce human greenhouse gas emissions, and at the moment seems fairly realistic.
In this scenario, CRR13 finds that by 2040, monthly heat records will have become approximately 12 times more likely to occur than in a non-warming world,
"...approximately 80% of the recent monthly heat records would not have occurred without human influence on climate. Under a medium future global warming scenario this share will increase to more than 90% by 2040."
As lead author Coumou noted, this is even worse than it sounds, because breaking a heat record in 2040 will require much higher temperatures than breaking a record today.
"Now this doesn’t mean there will be 12 times more hot summers in Europe than today – it actually is worse. To count as new records, they actually have to beat heat records set in the 2020s and 2030s, which will already be hotter than anything we have experienced to date. And this is just the global average – in some continental regions, the increase in new records will be even greater."
The results of this research are consistent with those of Hansen et al. (2012), which found that global warming is shifting the temperature distribution to make extreme heat waves more likely to occur, similar to the findings of several other studies such as Donat and Alexander (2012) and Meehl et al. (2009).
Source: NASA/Goddard Space Flight Center GISS and Scientific Visualization Studio
Hot Times Ahead
To sum up the results of this study,
- Record-breaking monthly temperature records are already occurring five times more often than they would in the absence of human-caused global warming.
- There is an 80% chance that any monthly heat record today is due to human-caused global warming.
- Unless we take steps to significantly reduce human greenhouse gas emissions and global warming, by 2040 the frequency of monthly heat records will become 12 times the rate in a non-warming world, and we will be able to blame more than 90% of heat records on global warming.
This would of course be bad news. For example, as shown by Hawkins et al. (2012), crops tend not to respond well to extreme heat, so these findings could pose a significant problem for global food production, as well as increasing heat fatalities, requiring costly adaptive measures to prepare people for more frequent extreme heat waves. In January of 2013, Australia has been trying to cope with this sort of extreme heat, which has resulted in devastating wildfires and other nasty consequences.
CRR13 presents a reality which we should try very hard to reverse, and a possible future we need to do our best to avoid.


 Arguments


 0
0  0
0


Comments