Climate Science Glossary

Term Lookup

Enter a term in the search box to find its definition.

Settings

Use the controls in the far right panel to increase or decrease the number of terms automatically displayed (or to completely turn that feature off).

Term Lookup

Settings


All IPCC definitions taken from Climate Change 2007: The Physical Science Basis. Working Group I Contribution to the Fourth Assessment Report of the Intergovernmental Panel on Climate Change, Annex I, Glossary, pp. 941-954. Cambridge University Press.

Home Arguments Software Resources Comments The Consensus Project Translations About Support

Bluesky Facebook LinkedIn Mastodon MeWe

Twitter YouTube RSS Posts RSS Comments Email Subscribe


Climate's changed before
It's the sun
It's not bad
There is no consensus
It's cooling
Models are unreliable
Temp record is unreliable
Animals and plants can adapt
It hasn't warmed since 1998
Antarctica is gaining ice
View All Arguments...


Username
Password
New? Register here
Forgot your password?

Latest Posts

Archives

Ocean Heat Came Back to Haunt Australia

Posted on 15 January 2013 by Rob Painting

Over the last 50 years an enormous amount of energy, equivalent to two Hiroshima bombs per second, has gone into heating the global oceans. Because of their much greater mass, the oceans have a thermal capacity roughly one thousand times greater than the atmosphere. This means that despite this huge increase in accumulated energy, the change in upper ocean temperature is small compared to that of global surface air temperatures.

Upper ocean heat buried beneath the surface layers doesn't necessarily remain in the ocean though. For instance, the largest year-to-year fluctuation in global temperature generally occurs in response to the Pacific Ocean phenomenon called the El Niño-Southern Oscillation (ENSO). Variation in ocean circulation and surface winds typically expose warmer-than-average sea surface water to the atmosphere during El Niño, and cooler-than-average sea surface water during La Niña episodes (check out this brilliant animation to understand the fundamental process). The resultant ocean-to-atmosphere heat exchange has a major influence on global surface temperature in any given year, and this works to obscure the long-term surface global warming trend when viewed at short intervals

Due to the huge difference in heat capacities between the ocean and atmosphere, what may in fact be a small amount of ocean heat transforms into a major bout of atmospheric warming when this heat is transferred from the ocean to atmosphere. A poignant example is the record-breaking heat wave which has recently enveloped all of Australia.

A heat wave requires a number of 'weather fluctuation stars to align', so-to-speak, but the role of the ocean in this heat wave is demonstrated in the animation below - where a pulse of oceanic heat rapidly accumulates in the surface Indian Ocean around Western Australia and propagates eastward.
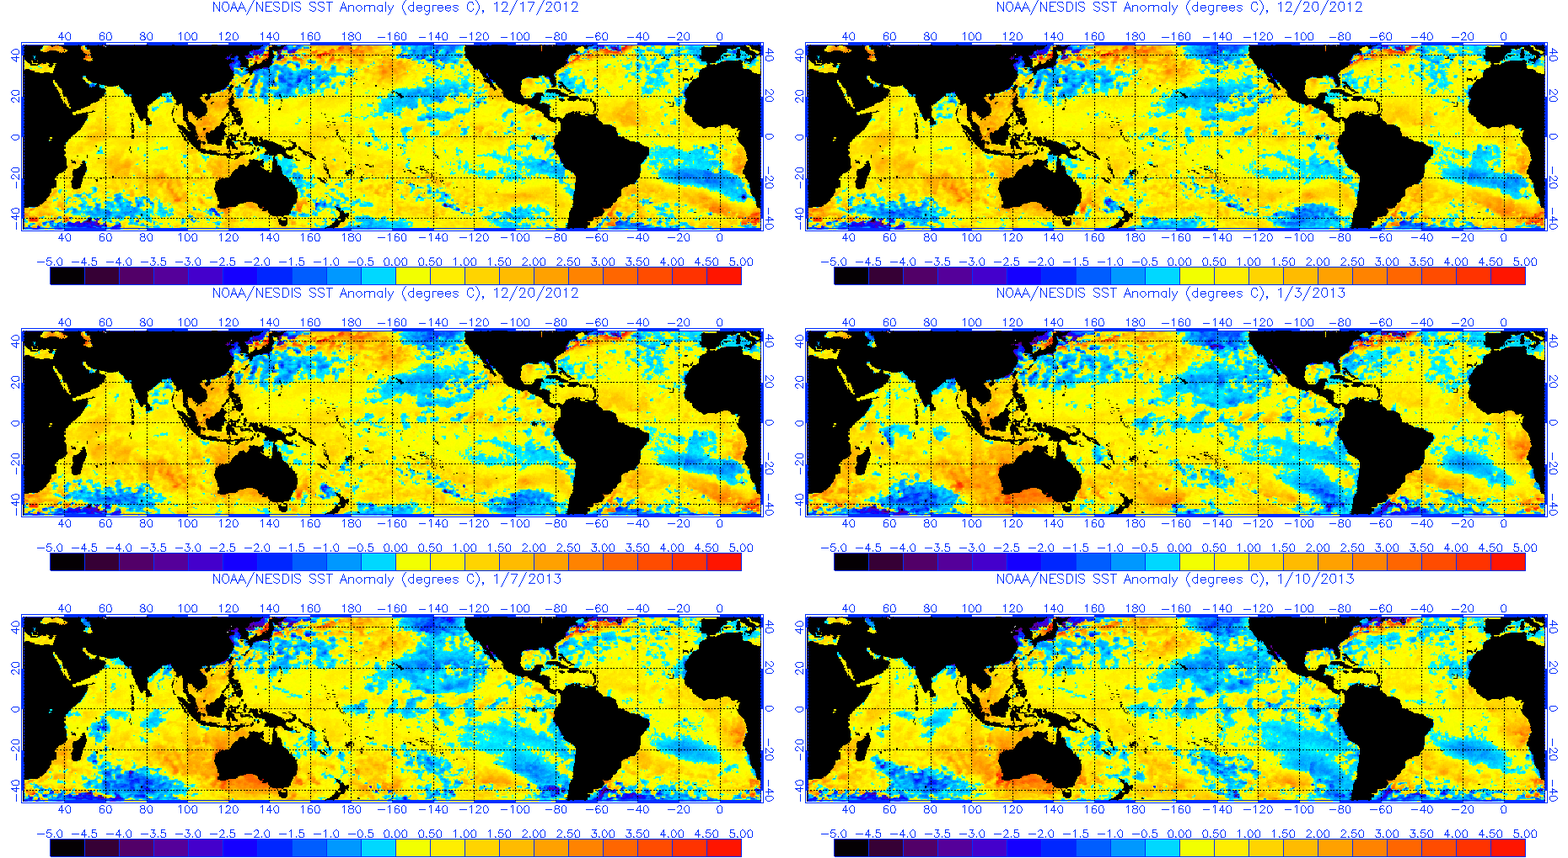
Figure 1 - Global sea surface temperature anomalies (departures from the average) for the period 17th December 2012 to 10th January 2013. The maps are from the US-based National Oceanic and Atmospheric Administration (NOAA). The temperature bar is in °C and the anomalies are relative to the long-term average at each location for that time of year.

The marine heat wave which contributed to this record-breaking Australian heat wave, may (hopefully) have been of short enough duration to prevent a mass mortality of marine life in the oceans around Australia, unlike a long-ish marine heat wave off Western Australia in early 2011, but that remains to be seen. Regardless, the vast accumulation of heat in the ocean going on right now may be "out of sight, out of mind" for many, but the extra heat being added to the upper levels of the ocean will have consequences for humanity, as this Australian heat wave amply demonstrates.

Like the giant European, Russian, and United States heat waves before this, the Australian heat wave will slowly fade in the collective memory of the public consciousness, but it may not be too long before another rears its head to inflict suffering. We have seen a historic increase in record-breaking temperatures globally (Hansen [2012]) and, due to the well-understood physically-based scientific foundation (weather fluctuations operating within a warmer background climate state), we have to expect more frequent and more intense heat waves in the future (although their proximate causes are likely to differ).

On our current trajectory, these extreme record-breaking summer temperatures are set to effectively become the norm by around mid 21st century (Anderson [2011]). If this occurs it will present a formidable challenge, not only to human society in the form of wildfires and such, but to human agriculture and the many natural ecosystems that afford us our current lifestyles and feed 7 billion people. It might prove useful for our global society to act in order to prevent this scenario from becoming reality, something not even attempted thus far. Our children and grandchildren might think it was very useful of us.


Relevant SkS posts on this topic include: Extreme Events Increase With Global Warming, Ocean Heat Poised To Come Back And Haunt Us?, Hansen's New Climate Dice - Hot, Loaded, and Misunderstood, An American Heatwave: The United States Glimpses its Hot Future, Quantifying Extreme Heat Events, Extreme heat becoming more likely under climate change, and Monckton Myth #9: Monckton vs Monckton on heat waves.       

0 0

Printable Version  |  Link to this page

Comments

Comments 1 to 18:

  1. I've read 2 HB/S, and 4 HB/S, on here....should we standardize the amount?
    0 0
  2. vroomie - it's 2 HB's over the 50-year period, rising to about 4 in the last 16 years. We're referencing different time periods, and the value has increased moving forward in time.
    0 0
  3. Thank you, Rob, for the clarification. I'd missed that memo, somewheres!
    0 0
  4. Just out of interest, is the HB/s comparison an sks invention? First heard it from John Cooke speech and found it a good way to give a large number some context.
    0 0
  5. I lived in Australia for over 30 years and it's a hot country in January! (perihelion was in early Jan). With regards to 'records': http://joannenova.com.au/2013/01/australia-was-hot-and-is-hot-so-what-this-is-not-an-unusual-heat-wave/ Thoughts?
    0 0
  6. colinkirk, here's but one response to the so-called "facts" that Jo Nova spews.
    0 0
  7. @4,i first heard Earth's Energy Imbalance being compared to exploding Hiroshima bombs at such and such a rate in a video of Jim Hansen's TED talk (Feb 29, 2012). Less than halfway through the talk, he refers to ARGO float measurements of the Current Ocean Heat content, which amounts to 0.6 W/sq.meter when spread out over the Earth's surface, and equates that to the energy released by exploding 400,000 Hiroshima bombs a day. The video of the talk is available here.
    0 0
    Moderator Response: [PW] Hot-linked URL
  8. Colinkirk - this heat wave was a record-breaker. See this except from the Australian Bureau of Meteorology hyper-linked in the post: "On Monday the average maximum daily temperature record for Australia was broken at 40.33°C. The previous record, 40.17°C on 21 December 1972, was held for 40 years. The daily average maximum temperature yesterday (8 January 2013) is a close third at 40.11°C. The number of consecutive days where the national average maximum daily temperature exceeded 39°C has also been broken this week—seven (7) days (between 2–8 January 2013), almost doubling the previous record of four (4) consecutive days in 1973," said Mr Plummer. And yes, we're sure most readers appreciate it is summer in the Southern Hemisphere. The point that you are failing to understand is that these heat waves will become more frequent and more severe in the future ( See the hyper-linked SkS posts at the bottom of the post). By mid-century these kind of temperatures are likely to be the norm, with heat waves taking place over and above that. With the Earth's committed warming due its energy imbalance, we've got 3 or more decades of warming to come even if we were magically able to stop burning fossil fuels. Australia is a hot, dry, country. Making it much hotter and much drier will bring with it extraordinarily severe consequences. Good luck adapting to that. Your fellow Australians are going to need it.
    0 0
  9. Jake - not sure. John Cook has used the comparison before, but whether it originated elsewhere - I don't know.
    0 0
  10. Jake, I'm not sure where the Hiro comparison originated. I heard someone (not Hansen) express the energy imbalance in terms of Hiros per second so I checked those figures then used it in the Scientific Guide to Global Warming Skepticism but that was back in 2009 - I don't recall who originated the idea.
    0 0
  11. Memory says Gareth from Hot-Topic. 'Course, memory lies like a rug somedays.
    0 0
  12. Can anybody explain if the recent high temperatures of the Indian Ocean were linked to the La Nina in the Pacific? Did the warmer Pacific water flow east to the Indian Ocean?
    0 0
  13. Daniel - Gareth thinks not. It would be interesting to determine the origins of this one, as it's certainly a great way to capture people's attention.
    0 0
  14. Nice job Rob! You folks really know how to explain the science. Perhaps that's why you're coming under such venomous attacks of late. In any event, I want to thank you for that generous sharing policy - My little blog is just my hobby, it's got to take backseat to all life's other demands. So I tell you, it's really nice to be able to reproduce a beautiful piece of journalism/science/education {whatever you want to call it} with graphics :-) and all, to support some point I'm trying to make. For instance this article makes for a perfect final 'chapter' to my most recent collection. Thank you all ! Peter Link to Peter's "chapter"
    0 0
    Moderator Response: [PW] Hot-linked article
  15. Bill@13 wrote "it's a great way to capture people's attention". True. To begin capturing it you could refer to a much more familiar natural beast, the thunderstorm: its average energy content equals that of 50 Hiroshima bombs! The assertion appears in an old (1952) issue of Popular Mechanics, where it is attributed to Dr. Roscoe Brabham,a Univ of Chicago meteorologist. Click Ref.3 in the Wikipedia article on Thunderstorms to get to the issue. The Wiki article is useful in other ways: it lists the average weight of the moisture that the making of a thunderstorm lifts up (500,000 tonnes),and their average diameters ( 24 kms.).Their tops, of course, can touch the tropopause.
    0 0
  16. JC @10 The use of the HB reference in the Science guide came about as a result of a suggestion I made to you John. However I certainly can't claim primary source, others have used the idea as well and actually coined the term Hiro as a unit of measure. I think Ben Sandiford may have used it (the Hiro) sometime ago. It's one of those ideas that probably originated many times indepenently. People looking for a way to express a number that makes other peoples eyes glaze over otherwise. And just asking themselves a question - 'How big is an Atom Bomb' - will lead to this.
    0 0
  17. meher engineer @15, even supercell thunderstorms only dissipate about 17 Terrawatts, or about 0.25 Hiroshima bombs per second. Almost none of that energy escapes the Earth, so they do not represent a loss of energy at the surface, only an increase in entropy.
    0 0
  18. As someone not in the first flush of youth, I can remember phrases like "the same amount of energy as 3 Hiroshima bombs" being used throughout my life; ie back to the 50s and 60s. Thus I would suggest that the unit of the 'Hiroshima Bomb' has been around since the late 40s. I can remember Apollo rocket launches being described in 'HB's. I found this reference from the UK Parliament's Hansard dated 1990 (just under the words 'Column 332'). It relates to the fire on the Piper Alpha gas platform; "the release of energy must have approached the scale of the Hiroshima bomb".
    0 0

You need to be logged in to post a comment. Login via the left margin or if you're new, register here.


The Consensus Project Website

THE ESCALATOR

(free to republish)


© Copyright 2024 John Cook
Home | Translations | About Us | Privacy | Contact Us