Cowtan and Way: Surface temperature data update
Posted on 27 January 2014 by Kevin C
Following the release of temperature data for December 2013, we have updated our temperature series to include another year. From now on we hope to provide monthly updates. In addition we have released the first of a new set of 'version 2' temperature reconstructions.
Version 2 temperature reconstructions
One of the main limitations of Cowtan and Way (in press), which we highlighted in the paper and has been echoed by others, is that the global temperature reconstruction was performed on the blended land-ocean data. The problem with this approach is that surface air temperatures behave differently over land and ocean, primarily due to the thermal inertia and mixing of the oceans. The problem is compounded by the fact that sea surface temperatures are used as a proxy for marine air temperatures due to problems in the measurement of marine air temperatures.
We have therefore started releasing temperature series based on separate reconstruction of the land and ocean data. The first of these 'version 2' temperature series is a long reconstruction covering the period from 1850 to the present, infilled by kriging the HadCRUT4 land and ocean ensembles. (We can't produce a hybrid reconstruction back to 1850 because the satellite data only starts in 1979.)
For the long reconstruction there is no need to rebaseline the data to match the UAH data, and so all the original observations may be used. The separate land/ocean reconstructions also address a small bias due to changing land and ocean coverage which was mitigated by the rebaselining step in our previous work.
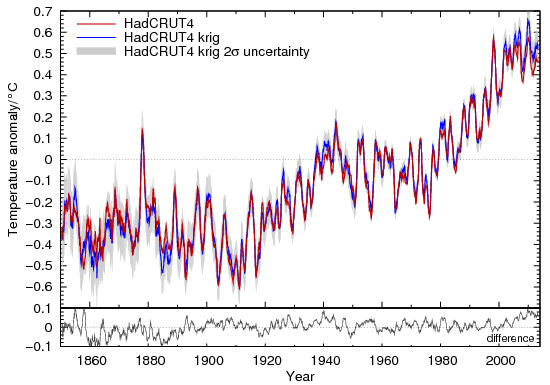
The use of the ensemble data means that we now produce a more comprehensive estimate of the uncertainty in the temperature estimates (following Morice et al 2012). The coverage uncertainty estimate has also been upgraded to capture some of the seasonal cycle in the uncertainty. A comparison of the temperature series to the official HadCRUT4 values is shown in Figure 1.

Figure 1: Comparison of HadCRUT4 to the infilled reconstruction, using a 12 month moving average.
We have also updated the version 1 infilled and hybrid reconstructions to the end of 2013. These will be frozen at that point and replaced by new version 2 hybrid reconstructions.
Results for 2013
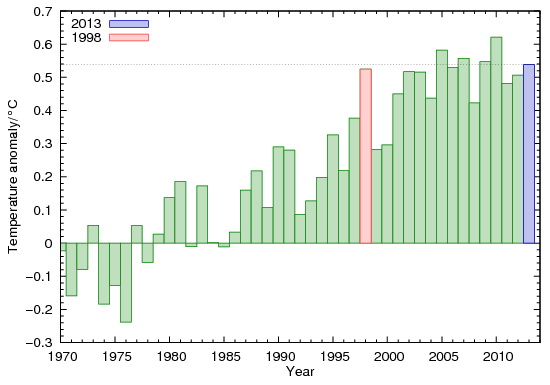
The annual temperature averages for the version 2 infilled data are shown in Figure 2.

Figure 2: Annual temperatures for the version 2 infilled reconstruction
Rankings of the hottest years are as follows:
| Rank | HadCRUT4 | Version 2 infilled | Version 1 hybrid |
| 1 | 2010 | 2010 | 2010 |
| 2 | 2005 | 2005 | 2005 |
| 3 | 1998 | 2007 | 2009 |
| 4 | 2003 | 2009 | 2007 |
| 5 | 2006 | 2013 | 2013 |
| 6 | 2009 | 2006 | 2002 |
| 7 | 2002 | 1998 | 2006 |
| 8 | 2013 | 2002 | 2012 |
| 9 | 2007 | 2003 | 2003 |
| 10 | 2012 | 2012 | 1998 |
2013 is the 5th hottest year according to both the version 2 infilled data and the version 1 hybrid data. This compares to 8th for HadCRUT4, 7th for GISTEMP and 4th for NCDC, although in many cases the years are statistical ties.
The ranking of 2013 in comparison to 1998 is particularly interesting. HadCRUT4, GISTEMP and NCDC all show 2013 as cooler than 1998, which was an exceptional El Niño year. However both of our reconstructions show 2013 to be warmer than 1998, despite 2013 being El Niño neutral.
A caveat is required for the version 2 infilled reconstruction: This purpose of this temperature reconstruction is to provide realistic temperature estimates for the whole of the 20th century, and so the ice mask does not capture the recent decline in Arctic sea ice. Low ice cover will affect results since 2007. This will be addressed in future updates.
Future
We plan to release six new satellite era reconstructions over the next few weeks. We have a further update planned for February which will address the question of why our trends are greater than those for GISTEMP over recent years.
Data and documentation are available from the project website.


 Arguments


This is great stuff. As the uncertainty bands around the temperature anomaly series shrink, that may help make it easier to precisely identify the factors contributing to short term variations.
It seems like this is changing from a one time re-analysis of the anomaly data (ala the 'BEST' project) into a new ongoing data set. Are there likely to be additional papers published documenting the ongoing analysis and changes or will that information only be documented on the project website?
Ideally we'd write more papers. However, one of the main reasons for writing a paper in the first place was that it was the only way to draw the attention of the community to the problem. So to some extent if we can now communicate sufficiently well to the community through the project website and blogs then writing papers becomes less important.
Of course papers are important for the scientific record, but if the main temperature record providers update their work in response to the issues we raise it'll be recorded in their publications.
Doing a peer-reviewed paper in your spare time in someone else's field is a killer. We've probably got enough material (including unreleased results and work in progress) for at least another 2 papers, but I'm not sure I can face writing them.
While it would be great to have additional papers which might make a 'splash' and help penetrate public consciousness, I can certainly appreciate your reluctance to put in that much extra effort.
Have you heard anything from people working on the other anomaly series as to whether they are considering implementing some of your adjustments? That would certainly also be a major accomplishment as the data from the large institutions will undoubtedly remain the most frequently referenced. That was one thing which bothered me about the 'BEST' project. They pulled in some additional data and introduced new analysis techniques which might be beneficial, but then they didn't continue projecting and none of the other data sets seem to have used anything from their study to improve results.
There is a post by Stefan Rahmstorf just out at RealClimate. He compares Cowtan and Way's temperature series with GISS and NOAA NCDC as well as HadCRUT4. His ranking of the warmest years of C&W's series is based on their Version2 rather than the Hybrid method.
Actually BEST are doing monthly updates, although usually a month or two behind the others. I hadn't been picking them up for the trend calculator until a few weeks ago, which may have given the wrong impression.
Kevin,
In your data, http://www-users.york.ac.uk/~kdc3/papers/coverage2013/had4_krig_v2_0_0.txt, you don't have the headings. I want to play it a bit in R but I need to understand the columns first. I'm guessing the column meaning:
column0 - time
column1 - dT based 1961-90
What are columns 2, 3 & 4? I could have guessed but I'd better ask.
Thanks, Chris.
Temperature files contain 5 columns: date, temperature, total uncertainty (1σ), coverage uncertainty (1σ), ensemble uncertainty (1σ).
(From the series page, but I know from experience that it's easy to miss things like this.)
At last, a longer temperature dataset fot the whole globe produced partly by a European working scientists. Thank you, all involved. Anyway the difference to the GISS data set is small but it's nice to have a European source for the global temperatures. The occasional cable breaks under the Atlantic are not an issue anymore.