


 Arguments


Empirical evidence that humans are causing global warming
What the science says...
| Select a level... |
 Basic
Basic
|
 Intermediate
| |||
|
Direct observations find that CO2 is rising sharply due to human activity. Satellite and surface measurements find less energy is escaping to space at CO2 absorption wavelengths. Ocean and surface temperature measurements find the planet continues to accumulate heat. This gives a line of empirical evidence that human CO2 emissions are causing global warming. |
|||||
Climate Myth...
There's no empirical evidence
"There is no actual evidence that carbon dioxide emissions are causing global warming. Note that computer models are just concatenations of calculations you could do on a hand-held calculator, so they are theoretical and cannot be part of any evidence." (David Evans)
The line of empirical evidence that humans are causing global warming is as follows:
We're raising CO2 levels
Human carbon dioxide emissions are calculated from international energy statistics, tabulating coal, brown coal, peat, and crude oil production by nation and year, going back to 1751. CO2 emissions have increased dramatically over the last century, climbing to the rate of 44.25 billion tonnes of CO2 per year in 2019 (IPCC AR6, WG III Technical Summary 2022).
Atmospheric CO2 levels are measured at hundreds of monitoring stations across the globe. Independent measurements are also conducted by airplanes and satellites. For periods before 1958, CO2 levels are determined from air bubbles trapped in polar ice cores. In pre-industrial times over the last 10,000 years, CO2 was relatively stable at around 275 to 285 parts per million. Over the last 250 years, atmospheric CO2 levels have increased by about 130 parts per million (Figure 1). Currently, the amount of CO2 in the atmosphere is increasing by around 16 gigatonnes every year, while CO2 emissions from fossil fuels and industry today exceeds 35 billion tonnes of CO2 per year (Figure 2).
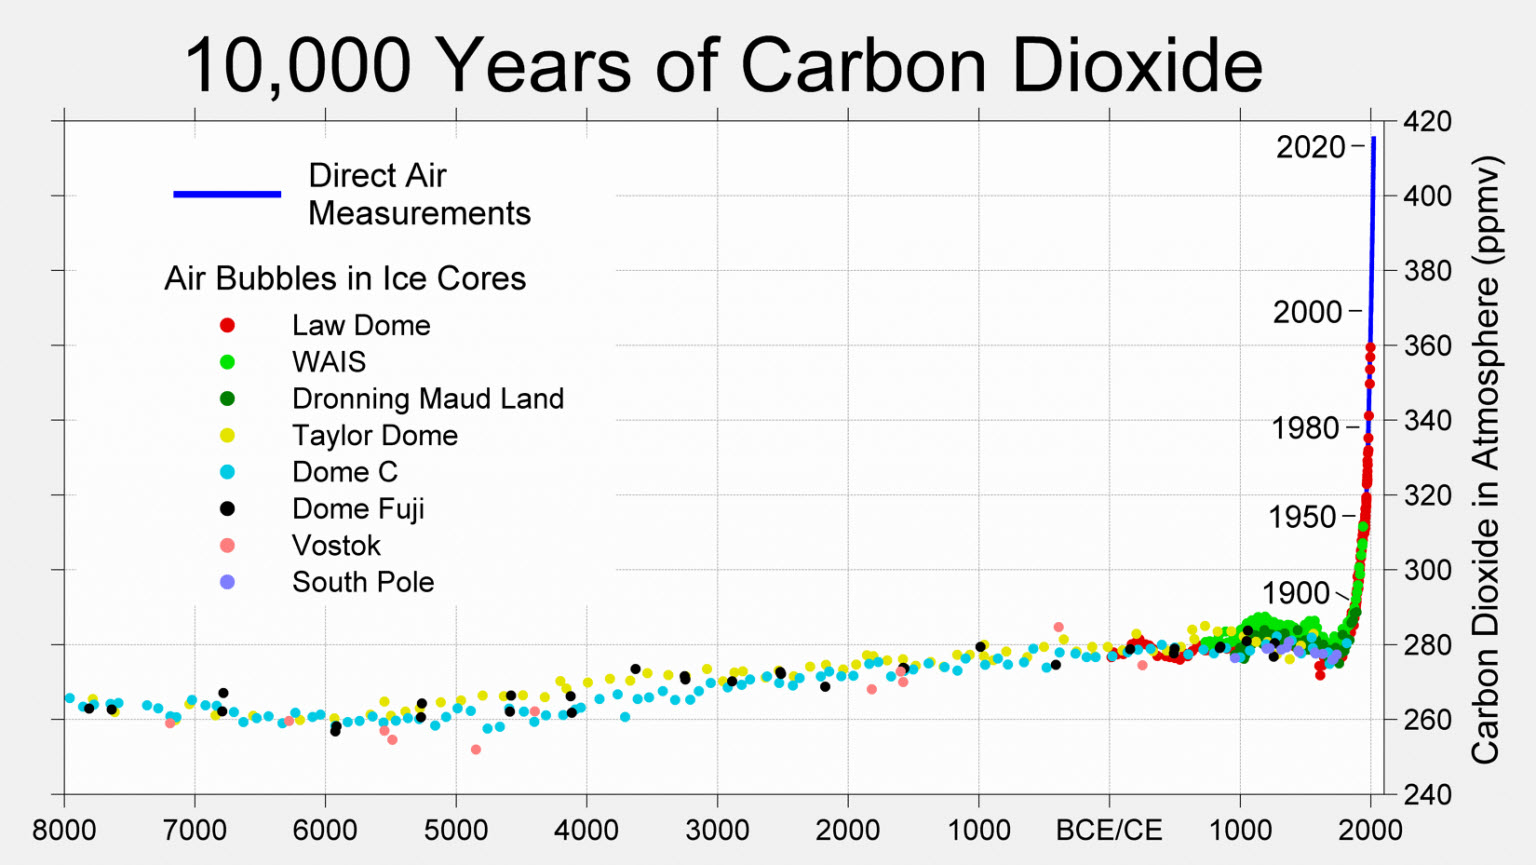
Figure 1: Atmospheric CO2 concentrations over the last 10,000 years from ice cores (dots) and direct air measurements (blue line). This clearly shows a rapid increase over the last few hundred years (source: Berkeley Earth).
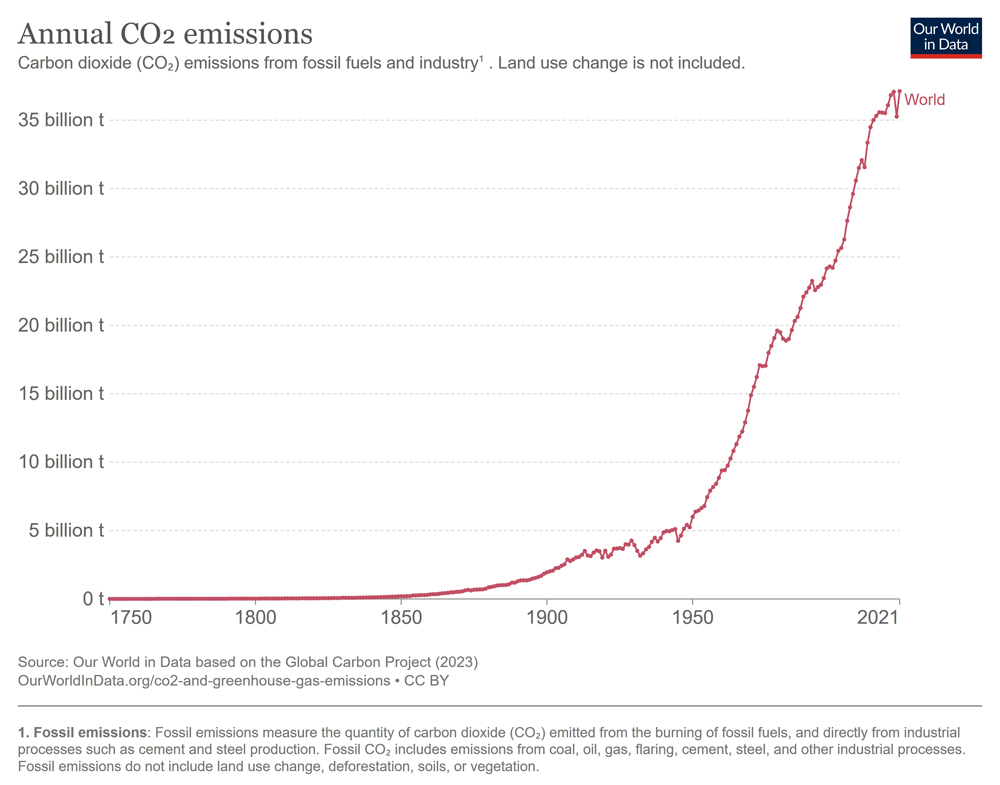
Figure 2: Annual CO2 emissions from fossil fuels and industry. This has increased from virutally nothing in 1750 to more than 35 billion tonnes per year in 2021 (source: Our World in Data).
Humans are emitting more than twice as much CO2 as ends up staying in the atmosphere. Nature is reducing our impact on climate by absorbing more than half of our CO2 emissions. The amount of human CO2 left in the air, called the "airborne fraction", has hovered around 43% since 1958.
CO2 traps heat
According to radiative physics and decades of laboratory measurements, increased CO2 in the atmosphere is expected to absorb more infrared radiation as it escapes back out to space. In 1970, NASA launched the IRIS satellite measuring infrared spectra. In 1996, the Japanese Space Agency launched the IMG satellite which recorded similar observations. Both sets of data were compared to discern any changes in outgoing radiation over the 26 year period (Harries et al. 2001). What they found was a drop in outgoing radiation at the wavelength bands that greenhouse gases such as CO2 and methane (CH4) absorb energy. The change in outgoing radiation was consistent with theoretical expectations. Thus the paper found "direct experimental evidence for a significant increase in the Earth's greenhouse effect". This result has been confirmed by subsequent papers using data from later satellites (Griggs & Harries 2004, Chen et al. 2007).
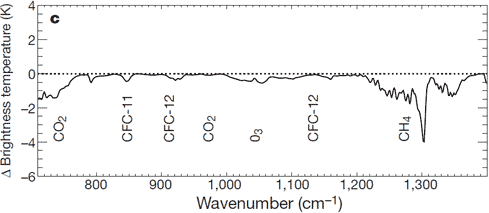
Figure 3: Change in spectrum from 1970 to 1996 due to trace gases. 'Brightness temperature' indicates equivalent blackbody temperature (Harries et al. 2001).
When greenhouse gases absorb infrared radiation, the energy heats the atmosphere which in turn re-radiates infrared radiation in all directions. Some makes its way back to the earth's surface. Hence we expect to find more infrared radiation heading downwards. Surface measurements from 1973 to 2008 find an increasing trend of infrared radiation returning to earth (Wang & Liang 2009). A regional study over the central Alps found that downward infrared radiation is increasing due to the enhanced greenhouse effect (Philipona et al. 2004). Taking this a step further, an analysis of high resolution spectral data allowed scientists to quantitatively attribute the increase in downward radiation to each of several greenhouse gases (Evans 2006). The results lead the authors to conclude that "this experimental data should effectively end the argument by skeptics that no experimental evidence exists for the connection between greenhouse gas increases in the atmosphere and global warming."
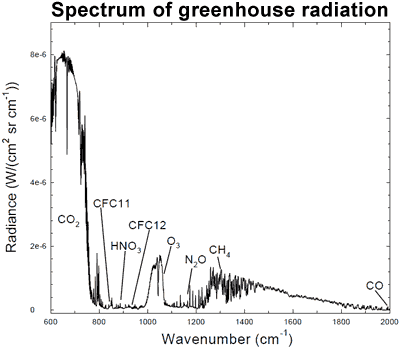
Figure 4: Spectrum of the greenhouse radiation measured at the surface. Greenhouse effect from water vapor is filtered out, showing the contributions of other greenhouse gases (Evans 2006).
The planet is accumulating heat
When there is more energy coming in than escaping back out to space, our climate accumulates heat. The planet's total heat build up can be derived by adding up the heat content from the ocean, atmosphere, land and ice (Murphy et al. 2009, IPCC AR6 WG1, Chapter9). Ocean heat content was determined down to below 2000 metres. Atmospheric heat content was calculated from the surface temperature record and heat capacity of the troposphere. Land and ice heat content (eg - the energy required to melt ice) were also included (Figure 5a). This accumulation of heat also leads to sea level rise, both through thermal expansion of the ocean, melting of land ice, and changes in land water storage (Figure 5b).
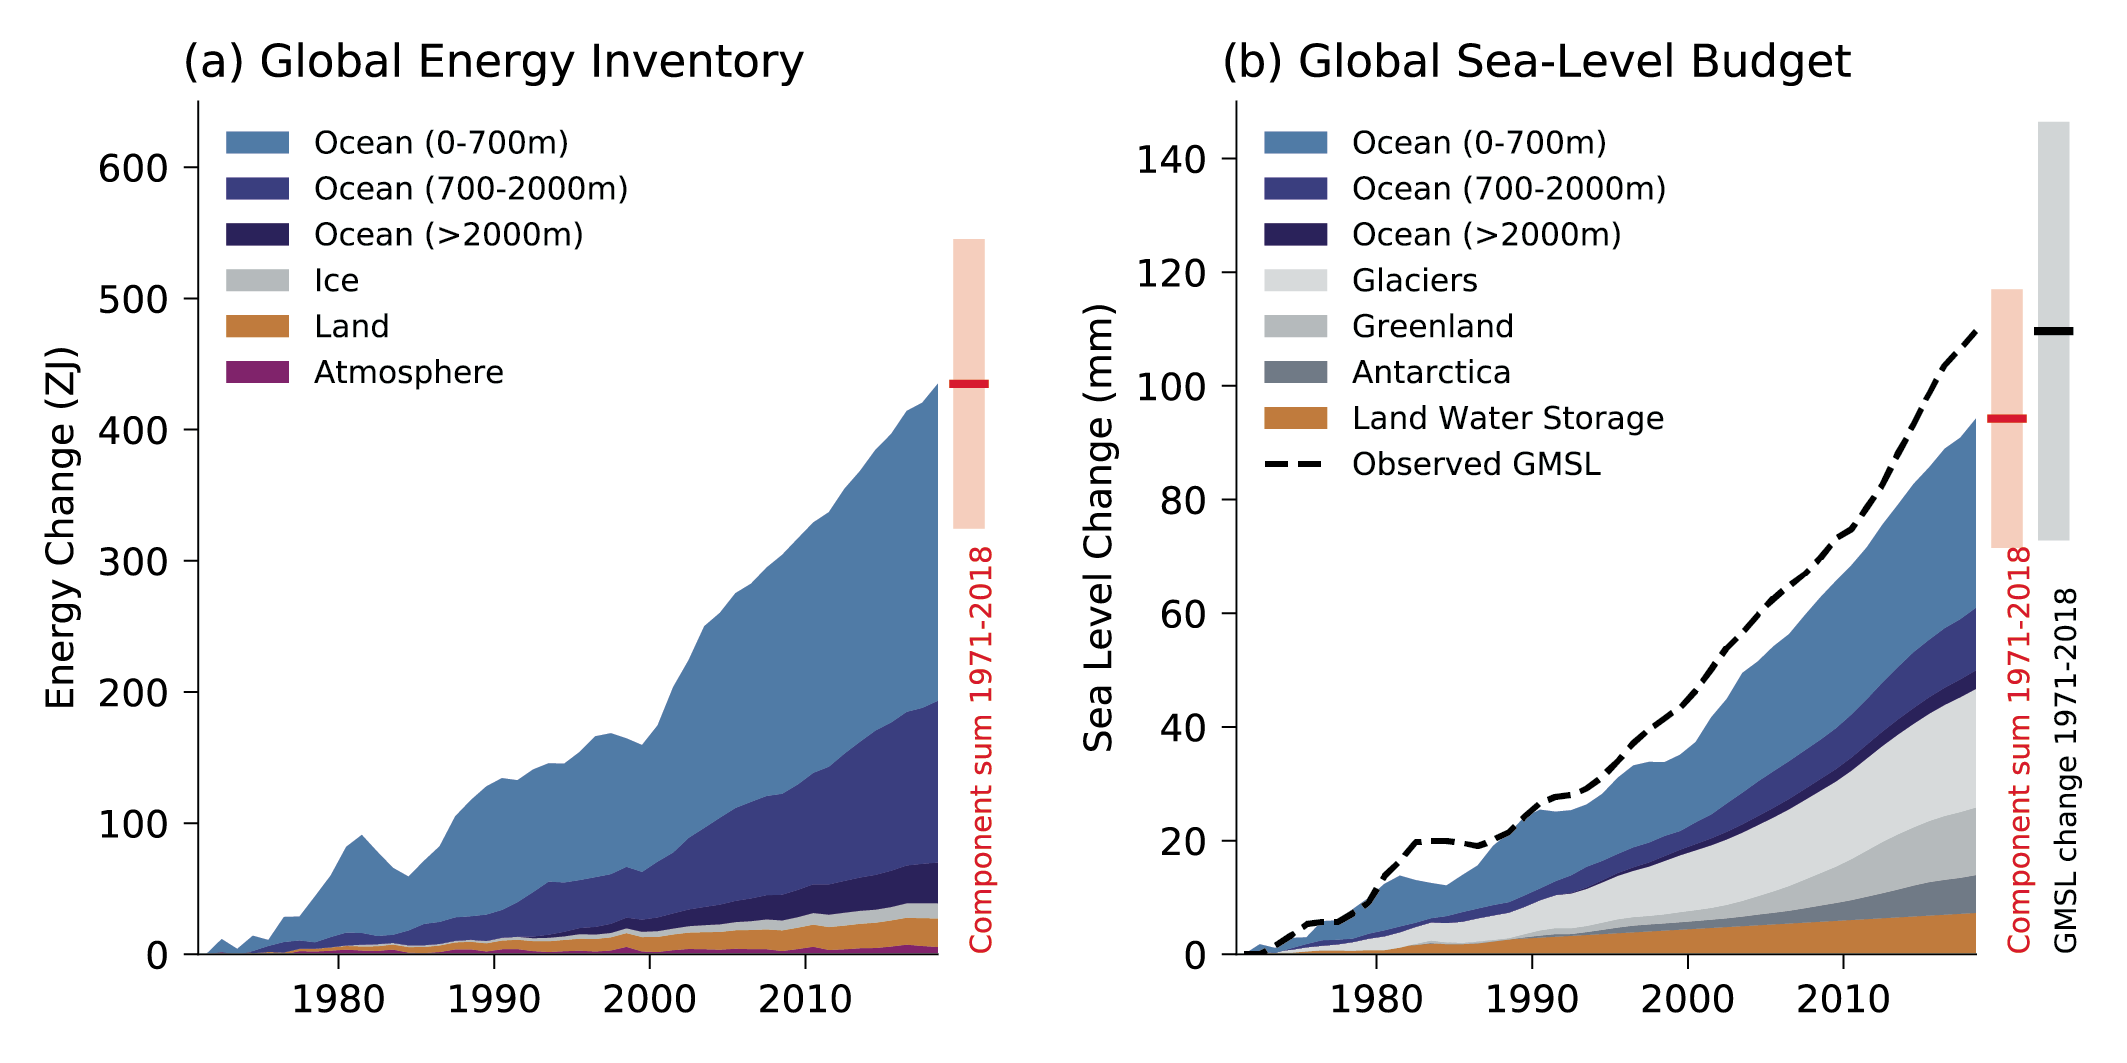
Figure 5:Global energy inventory (a) and global sea-level budget (b) from 1971-2018 (IPCC AR6 WG1 Chapter 9).
From 1971 to 2018, the planet has been accumulating heat at a rate of just over 300,000 gigawatts with the vast majority of the energy going into the oceans. Considering that a typical nuclear power plant has an output of 1 gigawatt, imagine 300,000 nuclear power plants pouring their energy output directly into our oceans. On average, every square metre of the climate system has been accumulating heat at a rate of 0.6 ± 0.11 Wm2, consistent with other determinations of the planet's energy imbalance (Hansen et al. 2005, Trenberth et al. 2009).
So we see a direct line of evidence that we're causing global warming. Human CO2 emissions far outstrip the rise in CO2 levels. The enhanced greenhouse effect is confirmed by satellite and surface measurements. The planet's energy imbalance is confirmed by summations of the planet's total heat content and ocean heat measurements.
For more evidence that humans are causing global warming, check out The human fingerprint in global warming.
Last updated on 16 July 2023 by Ken Rice. View Archives


Sadly, there are many who deny the assertion that CO2 is a greenhouse gas, even despite observations of an enhanced greenhouse effect. Much of the discussion on this website of late have been on that topic alone.
"during the last ten years, there has been no increase"
Statistically, this isn't true, the trend in global temperature has still been increasing. Don't fall into the trap of comparing single points in a noisy signal - that is not the way to determine a long term trend. More importantly, the physical reality is that the planet is still accumulating heat. There is still an energy imbalance. Satellites and ocean heat measurements find more energy is still coming in than going out.
- Surface weather station measurements
- Satellite measurements show that the troposphere is warming
- The stratosphere is cooling as predicted by anthropogenic global warming theory (this cannot be explained by solar variability)
- Temperatures at the ocean surface and at various ocean depths show warming as far down as 1500 meters
- Sea level rise
- Gravitometric measurements of Greenland and Antarctica show net ice loss
- Sea-ice loss in the Arctic is dramatically accelerating
- Acceleration of glaciers in Greenland and Antarctica, particularly within the last few years.
- The rise of the tropopause
- Poleward migration of species
- Increased intensity of hurricanes as expected from rising sea surface temperatures
- Accelerating decline of glaciers throughout the world
- Rise in temperatures at greater depths in the permafrost
- Rapid expansion of thermokarst lakes throughout parts of Siberia, Canada and Alaska
- Changes in ocean circulation as predicted by climate models, for example, with temperatures rising more quickly overland
- Disintegration of permafrost coastlines in the arctic
- Changes in the altitude of the stratosphere
- An energy imbalance - the earth is receiving more energy than it emits (Hansen 2005)
- Poleward movement of the jet streams (Archer 2008, Seidel 2007, Fu 2006)
- Widening of the tropical belt (Seidel 2007, Fu 2006)
Note - as you say, some of the evidence listed above are unique to CO2 warming - the carbon "fingerprint".