


 Arguments


Is warming in the Arctic behind this year's crazy winter weather?
Posted on 31 January 2018 by Guest Author
Jennifer Francis is a Research Professor, Rutgers University. This article was originally published on The Conversation. Read the original article.
Damage from extreme weather events during 2017 racked up the biggest-ever bills for the U.S. Most of these events involved conditions that align intuitively with global warming: heat records, drought, wildfires, coastal flooding, hurricane damage and heavy rainfall.
Paradoxical, though, are possible ties between climate change and the recent spate of frigid weeks in eastern North America. A very new and “hot topic” in climate change research is the notion that rapid warming and wholesale melting of the Arctic may be playing a role in causing persistent cold spells.
It doesn’t take a stretch of the imagination to suppose that losing half the Arctic sea-ice cover in only 30 years might be wreaking havoc with the weather, but exactly how is not yet clear. As a research atmospheric scientist, I study how warming in the Arctic is affecting temperature regions around the world. Can we say changes to the Arctic driven by global warming have had a role in the freakish winter weather North America has experienced?
A ‘dipole’ of abnormal temperatures
Weird and destructive weather was in the news almost constantly during 2017, and 2018 seems to be following the same script. Most U.S. Easterners shivered their way through the end of 2017 into the New Year, while Westerners longed for rain to dampen parched soils and extinguish wildfires. Blizzards have plagued the Eastern Seaboard – notably the “bomb cyclone” storm on Jan. 4, 2018 – while California’s Sierra Nevada stand nearly bare of snow.
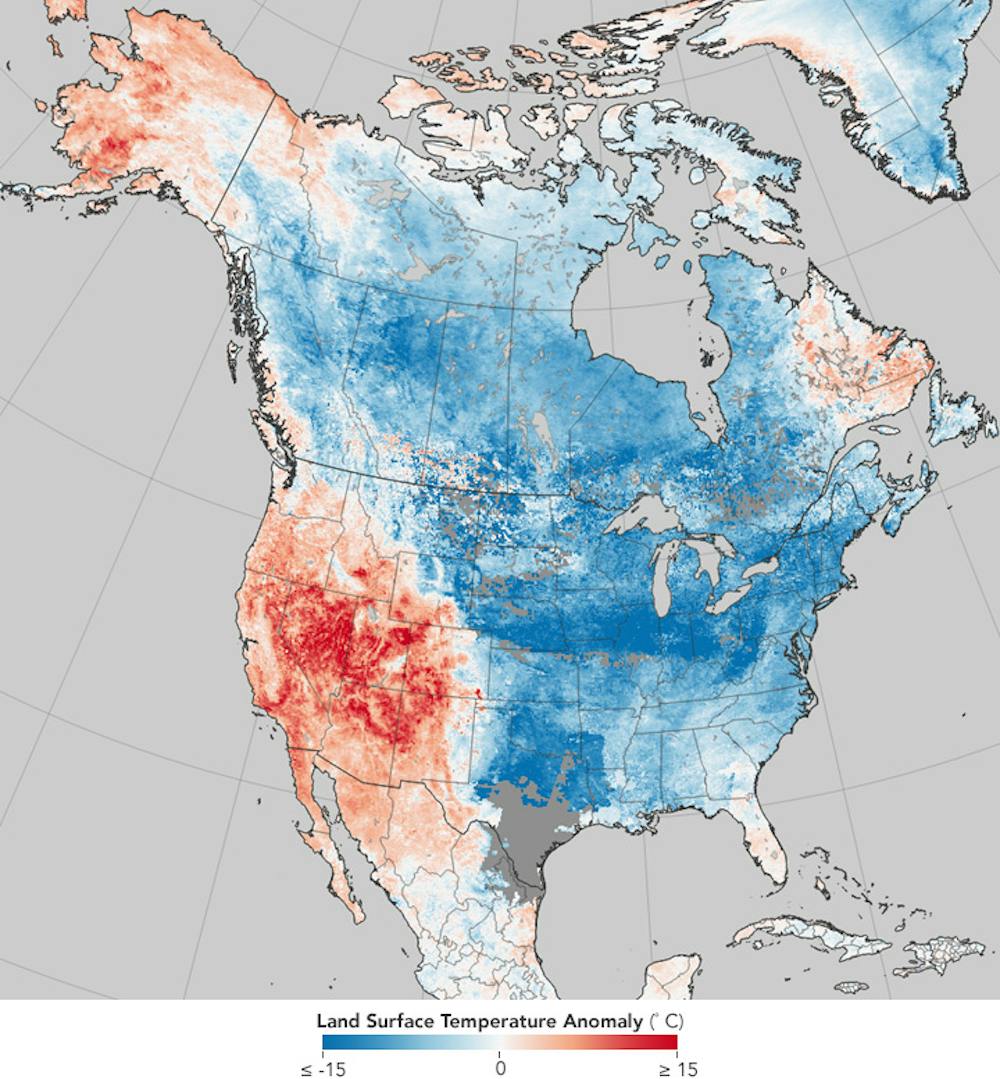 A study in contrasts: Warming near Alaska and the Pacific Ocean are ‘ingredients’ to a weather pattern where cold air from the Arctic plunges deep into North America. NASA Earth Observatory, CC BY
This story is becoming a familiar one, as similar conditions have played out in four of the past five winters. Some politicians in Washington D.C., including President Trump, have used the unusual cold to question global warming. But if they looked at the big picture, they’d see that eastern cold spells are a relative fluke in the Northern Hemisphere as a whole and that most areas are warmer than normal.
A warm, dry western North America occurring in combination with a cold, snowy east is not unusual, but the prevalence and persistence of this pattern in recent years have piqued the interests of climate researchers.
The jet stream – a fast, upper-level river of wind that encircles the Northern Hemisphere – plays a critical role. When the jet stream swoops far north and south in a big wave, extreme conditions can result. During the past few weeks, a big swing northward, forming what’s called a “ridge” of persistent atmospheric pressure, persisted off the West Coast along with a deep southward dip, or a “trough,” over the East.
New terms have been coined to describe these stubborn features: “The North American Winter Temperature Dipole,” the “Ridiculously Resilient Ridge” over the West, and the “Terribly Tenacious Trough” in the East.
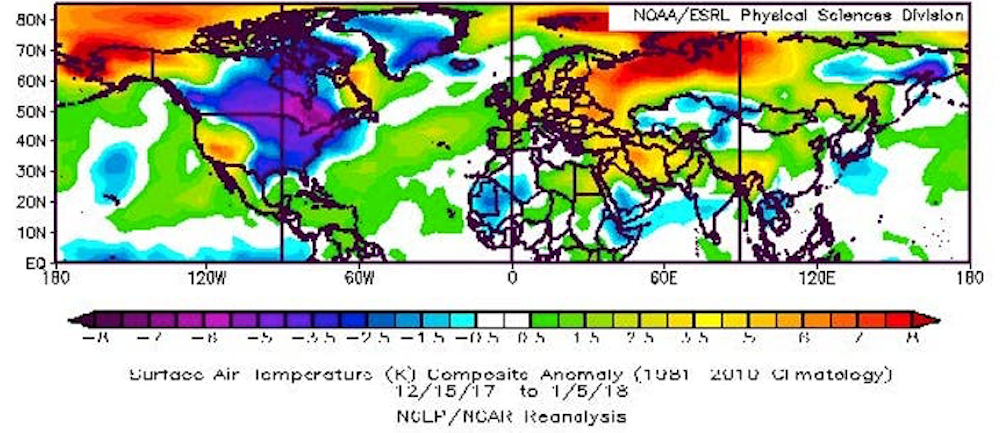 While the eastern U.S. suffered very cold temperatures in the recent cold snap, much of the rest of the Northern Hemisphere saw higher-than-average air temperatures. NOAA, CC BY
Regardless what it’s called, this dipole pattern – abnormally high temperatures over much of the West along with chilly conditions in the East – has dominated North American weather in four of the past five winters. January 2017 was a stark exception, when a strong El Niño flipped the ridge-trough pattern, dumping record-breaking rain and snowpack on California while the east enjoyed a mild month.
Two other important features are conspicuous in the dipole temperature pattern: extremely warm temperatures in the Arctic near Alaska and warm ocean temperatures in the eastern Pacific. Several new studies point to these “ingredients” as key to the recent years with a persistent dipole.
It takes two to tango
What role does warming – specifically the warming ocean and air temperatures in the Arctic – play in this warm-West/cool-East weather pattern? The explanation goes like this.
Pacific Ocean temperatures fluctuate naturally owing to short-lived phenomena such as El Niño/La Niña and longer, decades-length patterns. Scientists have long recognized that those variations affect weather patterns across North America and beyond.
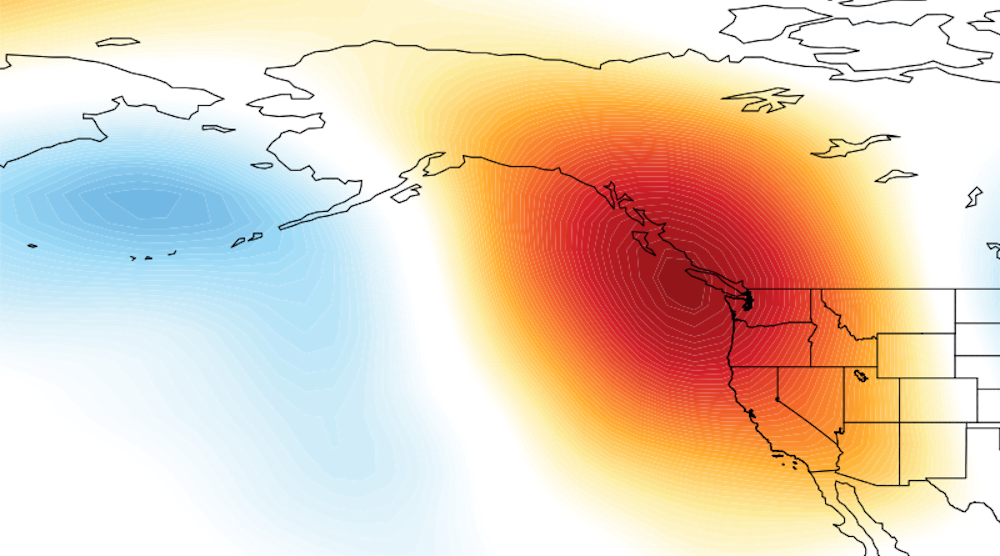
When a persistent area of atmospheric pressure stays in the western U.S., air from the Arctic pours into the U.S, causing a split between the warm and dry West and the cold East. Mesocyclone2014 and David Swain, CC BY-SA
The new twist in this story is that the Arctic has been warming at at least double the pace of the rest of the globe, meaning that the difference in temperature between the Arctic and areas farther south has been shrinking. This matters because the north/south temperature difference is one of the main drivers of the jet stream. The jet stream creates the high- and low-pressure systems that dictate our blue skies and storminess while also steering them. Anything that affects the jet stream will also affect our weather.
When ocean temperatures off the West Coast of North America are warmer than normal, as they have been most of the time since winter 2013, the jet stream tends to form a ridge of high pressure along the West Coast, causing storms to be diverted away from California and leaving much of the West high and dry.
If these warm ocean temperatures occur in combination with abnormally warm conditions near Alaska, the extra heat from the Arctic can intensify the ridge, causing it to reach farther northward, become more persistent, and pump even more heat into the region near Alaska. And in recent years, Alaska has experienced periods of record warm temperatures, owing in part to reduced sea ice.
My colleagues and I have called this combination of natural and climate change-related effects “It Takes Two to Tango,” a concept that may help explain the Ridiculously Resilient Ridge observed frequently since 2013. Several new studies support this human-caused boost of a natural pattern, though controversy still exists regarding the mechanisms linking rapid Arctic warming with weather patterns farther south in the mid-latitudes.
More extreme weather ahead?
In response to the strengthened western ridge of atmospheric pressure, the winds of the jet stream usually also form a deeper, stronger trough downstream. Deep troughs act like an open refrigerator door, allowing frigid Arctic air to plunge southward, bringing misery to areas ill-prepared to handle it. Snowstorms in Texas, ice storms in Georgia and chilly snowbirds in Florida can all be blamed on the Terribly Tenacious Trough of December 2017 and January 2018.
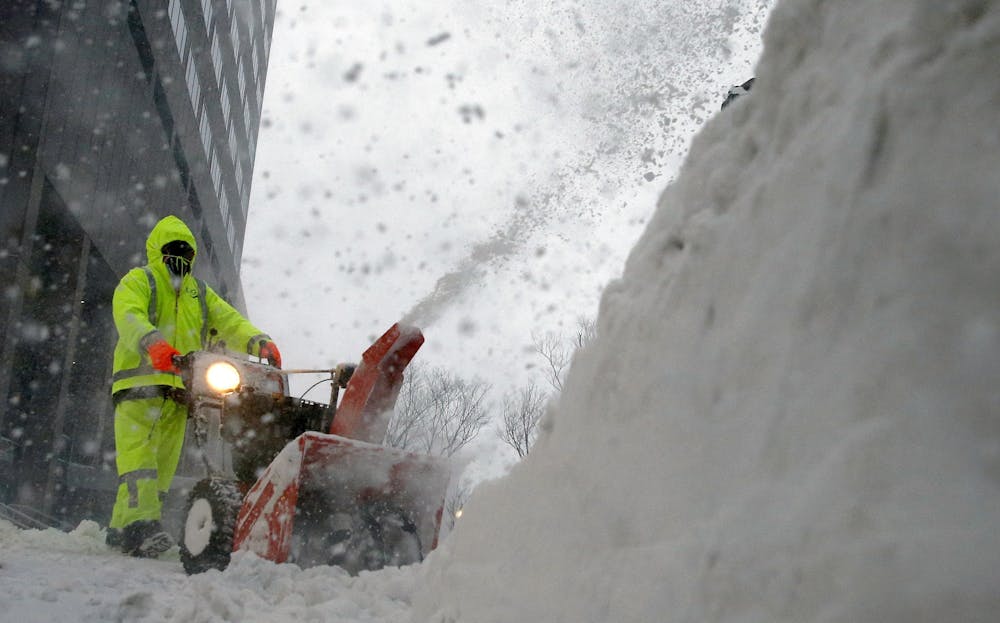 Cold weather from the Arctic combined with warm tropical air fueled a storm that produced well over a foot of snow and spots of flooding in Boston. AP Photo/Michael Dwyer
Adding icing on the cake is the tendency for so-called “nor’easters,” such as the “bomb cyclone” that struck on Jan. 4, to form along the East Coast when the trough’s southwest winds align along the Atlantic Seaboard. The resulting intense contrast in temperature between the cold land and Gulf Stream-warmed ocean provides the fuel for these ferocious storms.
The big question is whether climate change will make dipole patterns – along with their attendant tendencies to produce extreme weather – more common in the future. The answer is yes and no.
It is widely expected that global warming will produce fewer low-temperature records, a tendency already observed. But it may also be true that cold spells will become more persistent as dipole patterns intensify, a tendency that also seems to be occurring.
It’s hard to nail down whether this weather pattern – overall warmer winters in North America but longer cold snaps – will persist. Understanding the mechanisms behind these complex interactions between natural influences and human-caused changes is challenging.
Nevertheless, research is moving forward rapidly as creative new metrics are developed. Our best tools for looking into the future are sophisticated computer programs, but they, too, struggle to simulate these complicated behaviors of the climate system. Given the importance of predicting extreme weather and its impacts on many aspects of our lives, researchers must continue to unravel connections between climate change and weather to help us prepare for the likely ongoing tantrums by Mother Nature.


Increased awareness and better understanding can occur. Some people are willing to change their minds for Good reason.
However, anyone who already believes that global average surface temperature warming by 2 degrees C means the end of cold weather (many claim this) is unlikely to be willing to understand that global warming can produce more frequent cold events that are not quite as cold as, and may be snowier than, the less frequent cold events used to be.
The power of Private Interest in personal benefit can develop some very persistent damaging beliefs (like the belief that the popular and profitable burning of fossil fuels cannot possibly be unsustainable or harmful because, as those Economic Masters of Misunderstanding would declare, "if it was actually harmful or unsustainable it couldn't be popular or profitable").
Quoting the acticle it states that "losing half the arctic sea ice cover in 30 years". Following the reference the original acticle in Review of Geophysics, by WM Meier et states "Over the past few decades, summer areal density has declined over 30%.
So going to the Arctic sea ic website from the university of colorado we get in their oct 2017 bulletin "The linear rate of sea ice decline for September is .....13.2% per decade.
Now the greatest decline is found in the summer, but this auhor seems to have increased his by 10 or 20 % and not mentioned that the winter decline is much less about 15% over 30 years.
Exagerated claims dscredit the site.
could someone please explain this disepancy or is it due to inflation and projection?
It is reasonably likely that this is a transition phase. When the Polar Hadley cell finally reverses for longer and longer periods, we should see climate zones rapidly move northward and all of Northern America warm considerably. Right now, Polar air can make it's way south as the Polar Hadley cell weakens and is no longer confining Arctic air to the Arctic but this should change as the sea is more and more open water. At least there is one positive in all this. As heat is drawn northward, just possibly enough heat will be removed from southern waters to save our coral reefs. Not much of a comfort if the Northern Hemisphere grain belts are destroyed.
Alchemyst @2
"Quoting the acticle it states that "losing half the arctic sea ice cover in 30 years". Following the reference the original acticle in Review of Geophysics, by WM Meier et states "Over the past few decades, summer areal density has declined over 30%.....Exagerated claims dscredit the site. "
Perhaps the writer added the 30% decline in sea ice area to the 40% decline in thickness to say the arctic has lost half the sea ice 'cover' in 30 years. Just a guess on my part.
Alchemyst,
Perhaps the author was referring to the fact that from 1979-1989 the minimum daily extent was 7.0 million Km2 and the minimum in 2012 was only 3.3 million km2. data link (sorry, I couldn't get the graph to link). That is a decrease of more than 50% where I went to school. Sea ice area decreased from about 5.5 million km2 to about 2.3 million km2, also more than 50%.
Monthly minimum volume has decreased from 16.5 thousand km3 to 3.8 thousand km3. (first data link above) Since that is a decrease of more than 75% she was probably not referring to that change.
Alchymst
Idle claims that the sea ice expert who wrote this article was incorrect are easily dismissed with actual data.
To answer your question: "could someone please explain this disepancy [sic] or is it due to inflation and projection?"
The discrepancy is due to the asker being uinformed of the actual data. The linked article was a summary article and did not detail all the sea ice data.
Alchemist@2,
The total ice area evaluation presented by Arctic ROOS shows a minimum ice area for the 1979-2006 data set of 6.0 x 10⁶ km2. The minimum for 2012 was slightly less than 3.0 x 10⁶ km2, which is a loss of 50% of the ice area. The 2016 minimum was about 3.5 x 10⁶ km2 which is not quite 50% below the median of the 1979 to 2006 data set. And 2017 was a little higher. But the trend is not an increase of Arctic sea ice extent.
On a related point about the future of the Arctic Sea Ice, the total mass of Arctc ice is evaluated in this PIOMAS Arctic Sea Ice Volume Reanalysis by the Polar Science Center which shows that the average Arctic ice is getting significantly thinner making significant near future reductions of minimum sea ice extent more likely to occur.
A final point about how much the Arctic extent has been reduced. The reference in the OP could be regarding the reduction from the earlier values in the 1979 to 2006 data set, which may have been higher than the median, and high enough that the 2017 area of sea ice is 50% less than the minimums in the early years of the 1979 - 2006 data set.
[JH] You are addressing Alchemyst. not Alchemist.
Thanks michael sweet (sic) at 7:35, the result is due to using the 2012 result which was exceptional. This is caled cherry picking and does not credit the site. If you are using the 2012 value as representative then there has been an increase in the arctic ice cover over the last 5 years.
The University of Colorado state that the cover loss is 13.2 % liear per decade for the most extreme month. If one takes the 2012 result as a point in calculation then the conclusion is that the ice cover is now increasing!
michael the 2012 result was an outlier and should not be used as a representative of the real slution which is of a steady decline with significant scatter.
Here is the data, just take 19996 and 2012 results in isolation and you can get 50%, but at my shool were were taught that doing that was naughty.
http://nsidc.org/arcticseaicenews/2017/10/
I gave you a reference to probably the best data that of the Universty of Colorado
One Planet Only Forever, taking a mean for 1979 to 2006 and comparing it to the result of 2012. The "mean" year would be 1992 which makes 30 years to 2012. And 2012 had half the cover of the mean.
Yet 2012 was an outlier and so this is very bad statistics. So the declie is less than 50% in 30 years, thank you. Please note that the September data shows the greatest decline for any of the months and as I stated earlier it is 13.7% per decade which gives 41% over 30 years.
The ice cover loss for other months can be as low as 8% in 30 years (please see the April 2017 bulletin).
No 50% without qualification in my opinion is exagerated and alarmist and does not help in the overall discussion.
[PS] This article is a repost from "The Conversation" and we dont have contact with the author. While I agree that overstating the case is not good, Sks is not going to be altering the text of a repost. It might be better if this point is raised over at "The Conversation". The author is only person really able to talk to the point - everyone else is guessing. Whether the change is 30-40-50% is also a little irrelevant to the main point of this article which was to look at the way arctic changes can affect weather further afield.
Alchymist,
You are cherry picking your start year as 1979. That is when satalite records start, but not when scientific records start. This graph from Cryosphere Today
Indicates that the sea ice decline started around 1950. The sea ice declined about 20% between 1950 and 1979. (the averages for the entire summer changed 20%, the minimum generally changes more than the average of the entire summer), Since the decline from 1979 to the average of the 2010's is about 40%, when you add in the decline from 1950 the total decline is substantially greater than 50% since 1950.
Dr. Francis is referring to the decline in sea ice known for the entire record, not for a cherry picked interval that starts long after the decline in sea ice is known to have started.
[JH] You are addressing Alchemyst. not Alchymist.
Alchemyst@8,
Mod [PS] responded to the substance of the issue you raise & I have nothing to add.
However, I'm curious why you "sic" michael sweet's name. My understanding is that "sic" is used to warn about deliberate misspelling, e.g. due to quoting someone else's mistakes or another dialect.
Deliberate misspelling of someone's name is a personal offence, so should never happen and you did not misspell michael's name. So "sic" does not make sense here unless you wanted to use it in a meaning that I don't know.
[JH] Michael Sweet mispelled Alchemyst. Please let the Moderators do the moderating. Thanks.
michael sweet@10,
Eyeballing your graph for the most dramatic period (JAS) of decline, the trend from ~1950 to 2010 would be from a bit less than 12 (11.5)to a bit over 6 (maybe 6.5), so less than 50%, proving Alchymist correct. Maybe you meant the Sept only graph to better illustrate your point. But it's unclear what data fairly represents the point Jennifer was making.
The bottom line is Jennifer may want to be more precise next time even though she does not need to be in such non-scientific article.
Chriskoz,
I saw that the average of JAS was not a 50% decline but I do not have a copy of September only. The decline is more in September than in July or August so the decline in September from 1950-1979 must be greater than 20%. Dr Francis would have the exact data needed.
The data I have presented show that the sea ice started its decline long before 1979 and using only the satalite data grossly underestimates the decline. Since September has declined 40% over the satalite era it is clear that the total September decline is over 50%.
It is not Dr Francis problem if other people do not know the facts she uses in an article for the general public.
Alchemyst@9,
Statistically, the mean of the Arctic Sea Ice extent for the period 1979 - 2006 is not the value in 1992 (or 1993 - the other middle year of the set of data).
And 2012 is cleary just the current record low that is expected to be beaten in the near future. The trend of the Arctic Sea Ice extent is headed that way.
However, all I offered was another way of validating how reasonable the statement you question was. To me it appears reasonable 'as is' in spite of the qualifications you raise.
Alchemyst@9,
Some additional reasons to consider the original statement you question to be reasonable based on my suggested considerations:
Combining those two points it is reasonable to expect that in 2022 the Arctic Sea Ice minimum area will be about 50% of the mean minimum for the period from 1979 to 2006 (2016 and 2017 were pretty close to that lower value).
I hope that helps you change your mind.
One Planet Only Forever and Michael Sweet
Moderator I took you up on your suggestion
It would appear that the 30 years was a typo and it should have read 40.