


 Arguments


What is the net effect of EVs on climate change?
What the science says...
Electric vehicles have lower lifecycle emissions than traditional gasoline-powered cars because they are between 2.5 to 5.8 times more efficient, and are essential to reducing greenhouse gas (GHG) emissions.
Climate Myth...
Electric vehicles have a net harmful effect on climate change
"Contrary to vociferous assertions, EVs are no friends of the environment." (Forbes)
EVs are essential to reducing greenhouse gas (GHG) emissions and the use of fossil fuels that cause those emissions1 (also Singh et al. 2023). The Environmental Protection Agency has found that EVs typically have lower lifecycle emissions than traditional gasoline-powered cars, even when taking into account the emissions released when manufacturing EVs and generating power to charge them.2 The Intergovernmental Panel on Climate Change has further explained that “[t]he extent to which EV deployment can decrease emissions by replacing internal combustion engine-based vehicles depends on the generation mix of the electric grid although, even with current grids, EVs reduce emissions in almost all cases.”3 The key reason why EVs reduce emissions in almost all cases is that they are inherently more efficient than conventional gasoline-powered vehicles: EVs convert over 77% of electrical energy to power at the wheels, whereas conventional vehicles only convert roughly 12%–30% of the energy in gasoline to power at the wheels.4
Assuming average U.S. grid emissions, the average lifecycle GHGs associated with a gasoline-powered car that gets 30.7 miles per gallon are more than twice as high as those of an EV with a 300-mile range.2 The figure below from the EPA shows that the lifecycle GHGs for the gasoline-powered car under this scenario are between 350 and 400 grams/mile, whereas the lifecycle GHGs for the EV are only slightly above 150 grams/mile.
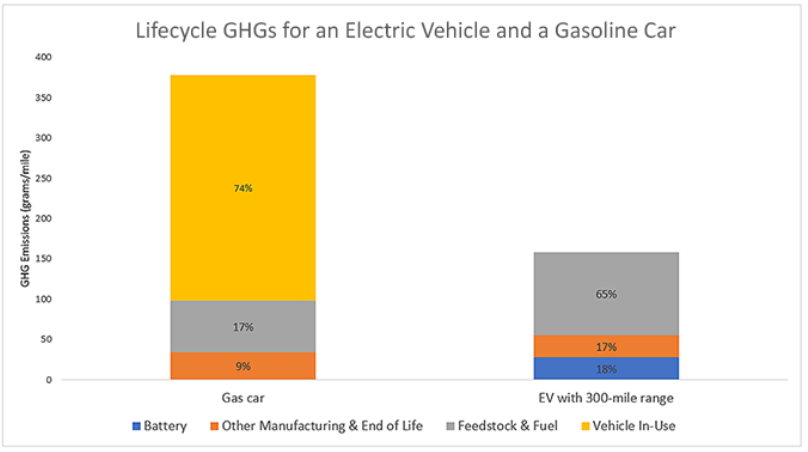
Figure 17: Break down of lifecycle emissions for electric and gasoline cars. This figure is based on the following assumptions: a vehicle lifetime of 173,151 miles for both the EV and gas car; a 30.7 MPG gas car; and U.S. average grid emissions. Source: EPA.
Most importantly, EVs’ lack of tailpipe emissions and heightened efficiency more than offset the emissions required to manufacture EV batteries: these emissions are offset within 1.4-1.5 years for electric sedans, and within 1.6-1.9 years for electric SUVs5 (Woody et al. 2022). These reduced tailpipe emissions not only help to stabilize our climate, but also improve air quality, bringing multiple health benefits including reduced rates of childhood asthma, particularly in urban areas.
The emissions offset by transitioning to EVs vary based on the carbon intensity of the energy grid. A study from Munich’s Universität der Bundeswehr found EVs to have reduced emissions by 72% when powered by Germany’s electric grid, which drew 23% of its electricity from renewable energy in 2021 (Buberger et al. 2022). But the researchers projected that a 100% renewable energy grid would have allowed EVs to reduce emissions by as much as 97% (Buberger et al. 2022, Wolfram et al. 2021). And the U.S. grid is getting cleaner over time, with a 44% reduction in power sector emissions from 2005 to 2023, meaning that EVs are having an increasingly positive impact on U.S. emissions.6 For those drivers in the United States who would like to ensure that they are charging their EVs with the cleanest possible energy, the Environmental Protection Agency’s Energy Star program helps drivers determine which chargers rely on renewable energy sources.7
Footnotes:
[1] Electric Vehicle Benefits and Considerations, Alternative Fuels Data Centre, Office of Energy Efficiency and Renewable Energy, US Department of Energy, (last visited Apr. 1, 2024).
[2] Electric Vehicle Myths, Envt’l Protection Agency (last updated Aug. 28, 2023).
[3] IPCC AR6 WGIII, Climate Change 2022: Mitigation of Climate Change (2022), Chapter 2.8.3.2
[4] All-Electric Vehicles, U.S. Dept. of Energy; see also Eric Larson et al., Net-Zero American: Potential Pathways, Infrastructure, and Impacts: Final Report, Princeton University, 247 (Oct. 29, 2021) at 40.
[5] These figures assume “a business-as-usual scenario which includes policies in place as of June 2020 with no projected policy changes, resulting in a grid that is 50% less carbon intensive in 2035 compared to 2005.”
[6] Power Sector Carbon Index, Scott Institute for Energy Innovation (last visited March 25, 2024).
[7] Charge Your Electric Vehicle Sustainably With Green Power, Energy Star, U.S. Environmental Protection Agency, 2 (last visited March 25, 2024).
[Note June 7, 2025: updated one or more link(s) to archived version(s)]
This rebuttal is based on the report "Rebutting 33 False Claims About Solar, Wind, and Electric Vehicles" written by Matthew Eisenson, Jacob Elkin, Andy Fitch, Matthew Ard, Kaya Sittinger & Samuel Lavine and published by the Sabin Center for Climate Change Law at Columbia Law School in 2024. Skeptical Science sincerely appreciates Sabin Center's generosity in collaborating with us to make this information available as widely as possible.![]()
Last updated on 7 June 2025 by Sabin Center Team. View Archives


Unfortunately, a key phrase was dropped from the source reference footnote [4] which makes the sentence in the green box for “What the Science Says” misleading. The reference says “EVs convert over 77% of the electrical energy from the grid (underline added) to power at the wheels. Conventional gasoline vehicles only convert about 12%–30% of the energy stored in gasoline to power at the wheels.” The source of power for EVs is not included in Eisenson, et al. “Electric vehicles have lower lifecycle emissions than traditional gasoline-powered cars because they are between 2.5 to 5.8 times more efficient.” Larson, et al., Final Report, p. 40, also compares units of electricity to units of gasoline. Furthermore, the articles do not define efficiency, whether it is g CO2/mile, g CO2(eq)/mile, or BTU/mi. Where coal is the power source for the grid, CO2 g/mi is about the same for EV and ICE. Where natural gas is the source, CO2(eq)/mi is close to the same after accounting for methane leakage from production and transport. Most simplified analyses use the source power mix from the regional grid. When the incremental power source to meet added demand for EVs (and other demands such as AI and growth), the situation is much more complex.
I am a strong supporter of EVs and I love my new car. To meet greenhouse gas emission reduction goals, transition to EVs is needed. The electric power grid also needs to reduce fossil fuel generation.
Charlie_Brown @1,
The brave new world of net zero brings with it many transformations which people appear to find difficult to normalise and set out rationally.
Be warned!! This is a subject I can drone-on about for hours. But picking up on a couple of things you address....
Ⅰ Back in the day when I was still a car owner, I was rather vocal with the message on EVs - 'As the electric grid decarbonised, the emissions from an EV will diminish. For a petrol-engined vehicle it will be fixed until the day it is scrapped.'
And back then I was also vocal about the fuel-efficiency of petrol-engined vehicles which were (and are) continuing to spew that darned CO2 into the atmosphere. I reckoned efficiency (mpg) should be increasing far more quickly than was/is the case** yet nobody seemed to care. My last car (20 years ago - I'm now car-free) did 70mpg. Back then I was asking 'Where are the 100mpg cars? The 150mpg cars?" Such efficiencies are not beyond the wit of man***.
And the graphic comparison in the above OP (that seems to address your objections, "seems" because the links to sources cited by the OPs Ref4 are not working for me): the OPs graphic would be transformed by improving mpg. Given the numbers presented in the OPs graphic, the point where an efficient petrol-engined vehicle becomes less carbon-intensive than the compared EV is 85mpg. But importantly, and petrol-heads be warned, that assumes the carbon-intensity of the grid doesn't reduce, an assumption which is not the case. In UK the carbon-intensity of electricity has dropped by 75% since 2010 (136g(C)/KWh to 32g(C)/kWh in 2024).
(**Latest govt number (for 2020) show the UK's average new petrol car with 52.4mpg & diesel 56.1mpg. That was rising on average by a paltry 0.8mpg/yr back during in the 2000s. That annual increasing efficiency doubled 2010-15 but since then the growth of the SUV sees the average efficiency getting worse, hopefully a temperary phenomenon.)
(*** Apparently petrol or diesel car still doesn't do much more than 70mpg. A lot of the lost mpg is because many are aren't so small and today small cars require reinforcing so they don't get flattened by the bigly SUVs & 4x4s swarming around them.)
Ⅱ Your comment also reminds me of an enquiry I made about an EV a little more recently. I was trying to get the CO2/mile numbers (along with a lot more) from Nissan who were presenting their much-advertised & wondrous EV - the Leaf. It was evident they had no idea what I was on about. They could tell me how cheap it was to run (£/mile) but stuff like carbon intensity or energy intensity didn't register as something they understood.
Evidently, they just wanted to sell cars and for them the USP was the wonderful £/mile.
MA Rodger, I am curious what your source is for "In UK the carbon-intensity of electricity has dropped by 75% since 2010 (136g(C)/KWh to 32g(C)/kWh in 2024)". In the 12 month period January 2024 to January 2025, the UK emitted 226 grams of CO2 per kilowatt-hour, averaged on an annual basis, according to app.electricitymaps.com. In 2012, according to this link, the lowest CO2 grams emitted per kilowatt-hour was about 440. Good reductions for UK, for sure. However, Paris climate targets call for electricity grids to emit less than 100 grams of CO2 per kilowatt-hour, averaged on an annual basis.
tder2012 @3,
First point to make is my use of g(C)/kWh which is a lot different to g(CO2)/kWh. To convert the former to the latter you need add the weight of the O2 by multiplying by 3.664. (My working in C rather than CO2 is a climatology thing.)
At that ElectricityMaps webpage, the 226 g(CO2eq)/kWh figure you quote I read as being the carbon intensity for Jan 2025 alone. I read the webpage data showing the individual months of 2024 running Jan-to-Dec 227, 180, 172, 135, 172, 145, 164, 124, 169, 189, 227, 176. I was thinking you shouldn't really average these as the electric use (they average 173) with the summer-use being a lot different from the chilly winter months, but GridWatch graphs UK electric use through 2024 and a back-of-fag-packet adjustment doesn't make that much difference (average 175g(CO2eq)/kWh = 48g(C)/kWh).
My number was taken from a CarbonBrief article which sports this graphic which shows the same as the article says 2024 =124g(CO2)/kWh = 34g(C)/kWh.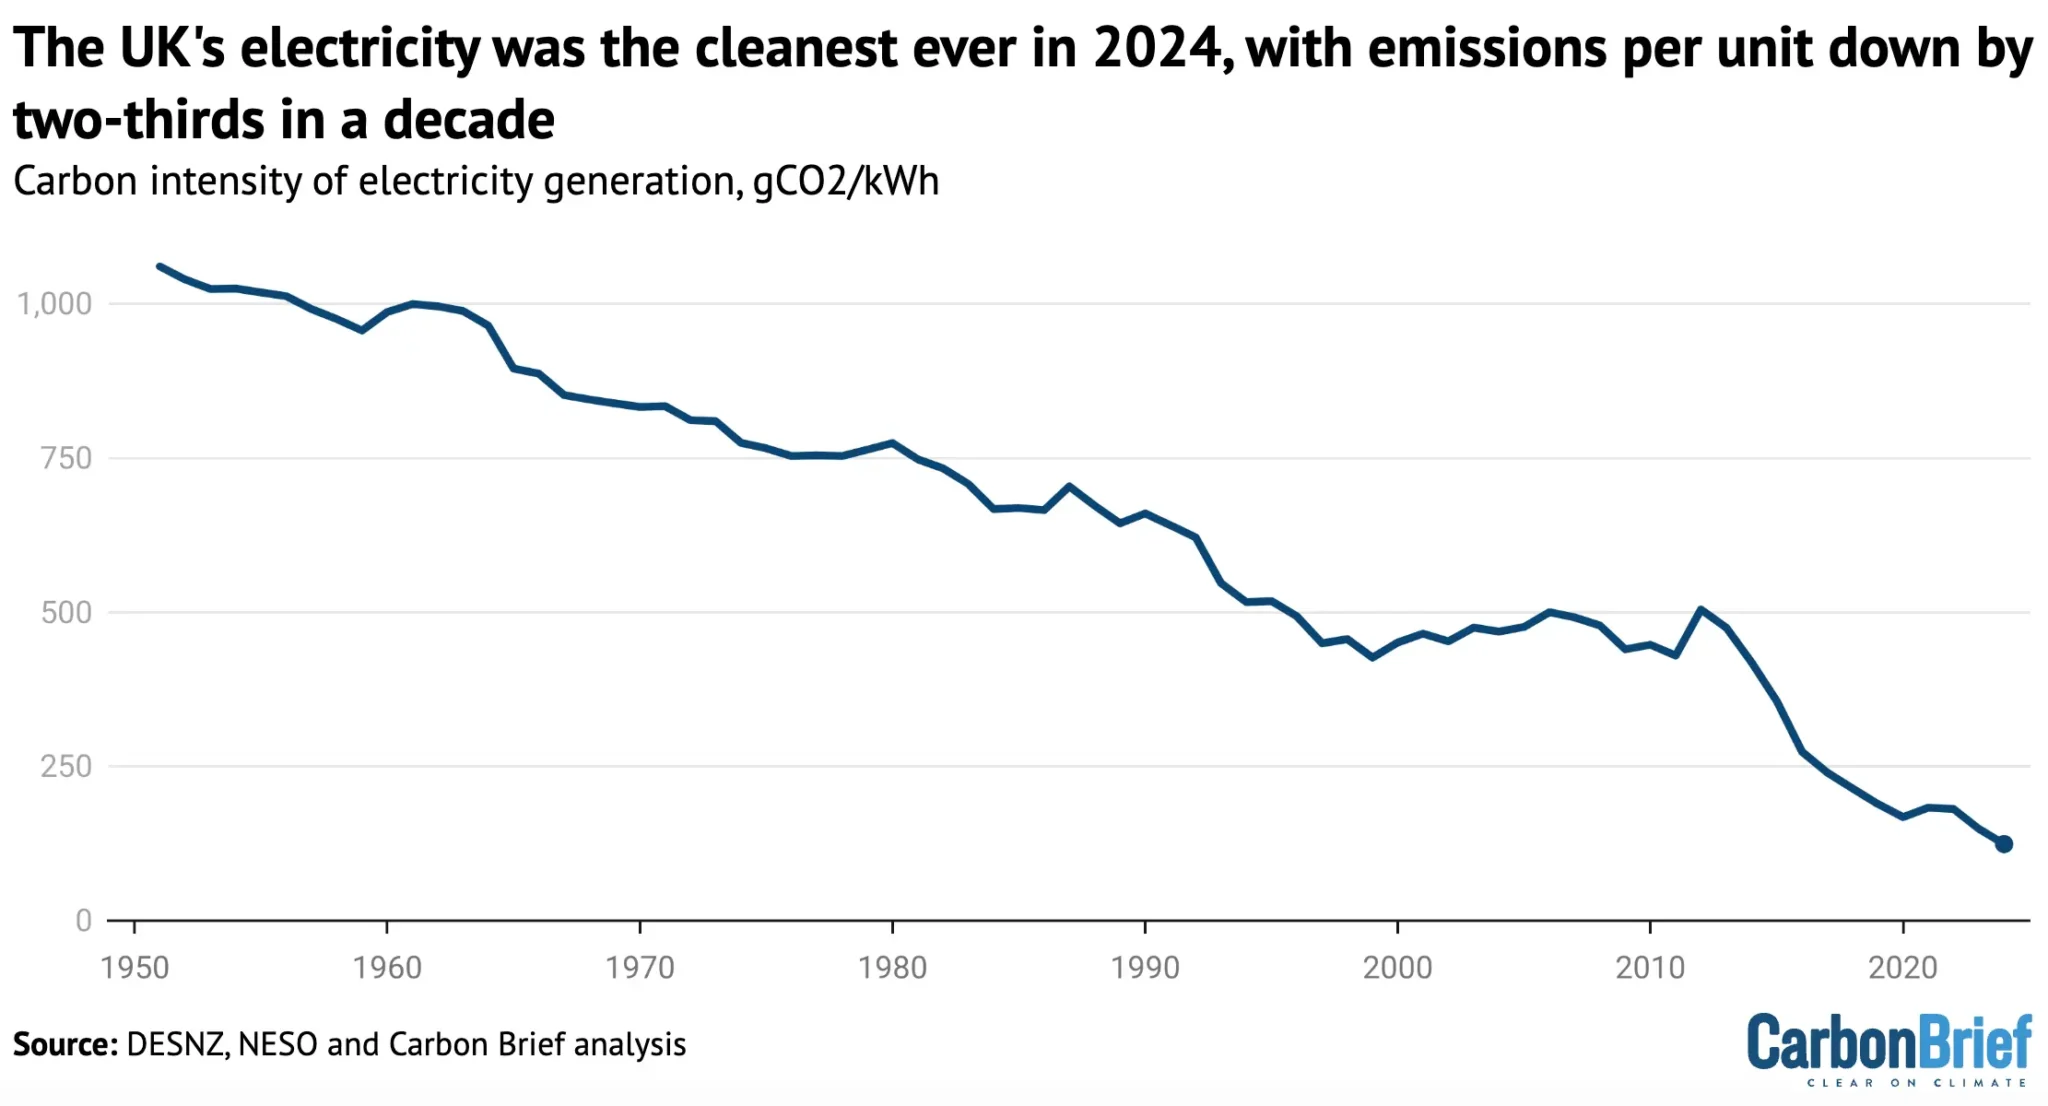
The NESO does a monthly analysis of GB monthly electric stats (Apr25 & links) and there does seem to be a discrepancy between the numbers from NESO and that ElectricityMaps webpage with NESO giving Apr25 at 133g(CO2)/kWh and ElectricityMaps 174g(CO2eq)/kWh.
Why the difference?
Speculating, perhaps the imported electric is seen as zero carbon due to it being emitted abroad. Perhaps something else.
MA Rodger from electricitymap, on the left side at the bottom, you can change from a 72 hour period, to a 90 day period to a 12 month period, etc and then I slid the month over to January 2025, so the 12 month period would be January 2024 to January 2025, this is the worst case scenario, which needs to be dealt with. https://app.electricitymaps.com/zone/GB/12mo/monthly
tder2012 @ 5:
January 2024 to January 2025 is 13 months...
Assuming that the slider in your link selects the entire month chosen - i.e, choosing January 2025 includes all 31 days in January - then January 2025 selects a 12-month period from February 2024 to January 2025.
Selecting December 2024 would cover the 12-month period ending December 31. If I set the slider that way, then the balloon pop-up on the map gives a Great Britain value of 176 CO2eq/kWh. This agrees with the last value MA Rodger reports in his 12 individual months in his second paragraph. The same 176 value is also visible on the upper left of the page, under "Total electricity mix, December 2024".
The page does not appear to be displaying 12-month averages, even though it lets you make that selection. As I move the slider from May 2024 to December 2024, I see the monthly value changing in the upper left display with exactly the numbers MA Rodger reports for those individual months. (I did not sign up for an account to download the CSV file with the data.)
tder2012 @5 & Bob Loblaw @6,
Ah ha!!. That button "on the left side at the bottom" does allow you to see annual values. The 'All Years' option displays the seven annual values 2017-24 (and this 'All Years' option can be pre-set in the URL) with the 2024 value showing as 175g(CO2eq)/kWh. (And being a lucky smarty pants, I see 175 is what I reckoned it being @4.)