


 Arguments


Methane emissions from oil & gas development
Posted on 2 January 2014 by gws
Earlier last year we posted a blog on whether the new natural gas boom, thanks to improved drilling technologies and hydraulic fracturing or “fracking”, was to be considered a boon or bane to Earth’s climate. The boon part comes from the fact that natural gas burns much cleaner and causes roughly a factor of two lower CO2 emissions than the burning of coal. So if the gas were exclusively used in high efficiency gas-fired power plants, or even combined heat and power (CHP) plants to replace coal combustion power plants for electricity production, CO2 emissions reduction would be maximized. The bane part is the fact that mining and use of natural gas does not happen without the inevitable gas leaks, in this case releasing a different, more powerful greenhouse gas: methane.
We concluded that knowledge on leak rates (commonly expressed as a percentage of produced gas), especially for newly developed wells and their infrastructure, was lacking. Some scientific estimates implied rates near or below 2%, while others implied 5% or more. We also pointed out that, regardless of current leak rates from booming oil&gas activities, methane leakage in general is an important issue.
The methane budget
Several recent scientific assessments put current fossil fuel related, “fugitive” methane emissions to the atmosphere at 100 million tons per year, roughly two thirds coming from the oil&gas industry, the remaining third from coal mining. It is useful in this context to realize that humans have roughly tripled the emissions of methane to the atmosphere since the beginning of the industrial revolution. Meaning, nature only provides for one third of atmospheric methane, the other two thirds are from human activities, dominated by domestic ruminants (mostly cows, i.e. the beef you eat) and fossil fuel mining and use. At the same time, nature takes care of all methane removal from the atmosphere, overwhelmingly through its slow atmospheric photo-oxidation. This oxidation is responsible for an atmospheric lifetime of methane of nine years and causes a ripple effect through atmospheric chemistry, such as via producing ozone and carbon monoxide, and via increasing the lifetime of other trace gases, including methane itself.
Inventoring human emissions
Because methane is such a strong greenhouse gas, reducing its emissions has direct benefits for climate stabilization. Methane’s comparatively short atmospheric lifetime would make the effects of emissions reductions measurable in the atmosphere within a decade. Alas, neither the production of beef nor the mining and use of fossil fuels are on the decline. Nevertheless, much ado has been made of EPA’s 2013 US greenhouse gas inventory, in which the agency lowered its estimates of past oil&gas industry related methane emissions to below 2% of produced gas amounts. This change has been misused by “pro-fracking” advocates to again attack the initial Howarth work and argue that methane releases are much lower than presumed, while “anti-fracking” advocates have instead highlighted that methane still contitutes a large fraction of US greenhouse gas emissions.
It is useful, therefore, to remind everyone what an inventory actually is. EPA has been keeping inventories of all regulated air pollutants since the 70ies and of greenhouse gases for approximately two decades. Each is based on knowledge of emission sources, how a source behaves as a function of "activity" or source mechanism (e.g. a combustion versus an evaporation process), external influences on a source, such as temperature, and its potential variation in time and space. This information, usually collected on short time and small space scales, is then extrapolated to longer times and larger scales using metrics such as the number of vehicles and their driving modes, the population density in an area, or the average number of times well sites undergo "liquids unloading". Numerous uncertainties and biases in this inventory development process, from the knowledge of sources to the type and manner of the extrapolation, make the inventory essentially an educated guess, not a reliable number. An example is the emission of carbon monoxide from car traffic, which the EPA has been overestimating for decades [1]. Thus, EPA regularly seeks to validate its pollutant inventory. In the case of methane, EPA’s emissions process knowledge was badly outdated and the agency strongly leaned on detailed information provided by the industry it oversees to update the inventory. No validation activity has yet been undertaken by the agency to verify that its changes (or lack thereof) were justified. So it is a stretch to claim that EPA’s change to the greenhouse gas inventory in itself is evidence of drop of emissions. Such a claim can only be made through independent validation measurements, such as those discussed below.
So are the emissions from the fossil fuel industry in the US increasing due to fracking, or not?
Unfortunately, this question was not answered in 2013, despite a number of new publications shining a light on the question through actual measurements. In August, a publication by CIRES and NOAA researchers [2] showed that methane emissions from a large oil&gas exploration field in Utah may be 6% to 12% (one standard deviation range) of average production rates, far exceeding the less than 1-2% claimed by the industry. In November, another study by NOAA [3] revealed that methane emissions nationwide appear to be significantly underestimated (by the inventory!) with respect to both of the large man-made sources, beef production and fossil fuel mining.
On the other hand, the large University of Texas (UT) study already mentioned in our earlier post published its first research paper [4] showing that industrial gas well operations carried out by several large companies produced highly variable methane emissions depending on what process was studied, where it was studied, and what equipment was used. Overall though, it did not show enhanced fugitive methane emissions over the inventory estimate. The UT study, sponsored by the industry, who selected well sites and times for measurements, did the Herculean task of on-the-ground individual well-site measurements to evaluate the leak rates of step-by-step well development and individual gas handling equipment. Most importantly, it found that measures to mitigate fugitive methane emissions, such as collecting back-flow fracking fluid, separating it from the methane it contains, then flaring said methane, do work in practice. It provided partial inventory validation data. But it was criticized for potentially being biased as it measured what would be expected without showing that these practices are representative or implemented nationwide. Nevertheless, the authors extrapolated nationwide emissions from their data, finding that EPA’s current inventory, which is based on similar data provided by the industry, is compatible with their data.
Apples and Oranges?
It is important to realize that the bottom-up study by UT researchers cannot directly be compared to the top-down studies carried out by NOAA researchers. The former is a single source study typically used by regulatory agencies, such as the EPA, to extrapolate to nationwide estimates. In contrast, the NOAA-led studies integrated over a larger region and do not provide the temporal and spatial resolution the UT-led study provided. Such top-down studies, however, include large numbers of well sites irrespective of their operation and irrespective of well type, in addition to sources not directly related to the oil&gas industry. Thus, they address integrated methane emissions from a region, and are not limited to fracking activities. As a result, critics have speculated that there exist a varying amount of well sites per region that have very high fugitive methane emissions, skewing the distribution of leak rates. If so, only a representative sampling of these sites could potentially reconcile the differences between the UT/industry and NOAA studies.
There are, however, other possible explanations. Methane emissions from co-located non-oil&gas sources could be underestimated, methane could also seep from old and abandoned wells or occur as "natural seepage", and oil well sites are often interspersed with gas well sites causing potential double counting of sources. This is because produced raw oil is separated from its gaseous components, such as methane and ethane, but if those gases are not marketable, for example because there was or is no pipeline infrastructure in place, they were either “vented” (i.e. released to the atmosphere) or, more commonly flared. Texas wasted the equivalent of 1% of its annual gas consumption to flaring in 2011/12.
And (uncontrolled) flaring becomes a source of other pollutants, such as soot and more reactive volatiles that go on to contribute to regional ground-level ozone formation, which has become a major air quality concern. It can therefore be argued that at least some fraction of the air pollution reduced by burning natural gas instead of coal for electricity production [5] is re-introduced locally via flaring unwanted volatiles at well sites. Permit applications for flaring at Texas well sites have increased dramatically since 2008, so was venting the dominant process before that time? Could this be an alternative explanation for the higher than inventoried central Texas 2008 methane emissions outlined by the second NOAA study? What is the role of oil and gas producing versus only gas-producing wells?
The way ahead
These and other questions are currently explored by various researchers. At the AGU Fall Meeting 2013, similar to 2012, several sessions addressed the topic or gas leakage, and we summarize some highlights here.
1. Leak rates are indeed highly variable
The hypothesis that leak rates are even more variable than indicated by the UT study is supported by mobile measurements carried out in the Barnett Shale area (presentations A44A-07, A53H-03, A44F-05). Researchers surveyed 275 well sites, of which 77% were found emitting methane. Among 52 well sites studied in detail, they found emission rates between several liters per minute (lpm) up to several hundred lpm per well site. Even among a group of nearly identical well sites drilled by the same company, a very large range of well-site emissions was observed. Methane in areas of intensive oil&gas development, such as the Barnett shale in Texas, showed a clear fossil fuel carbon isotopic signature (Fig. 1), and closely associated ethane with methane (Fig. 2). It also showed the city of Dallas as a significant methane source.
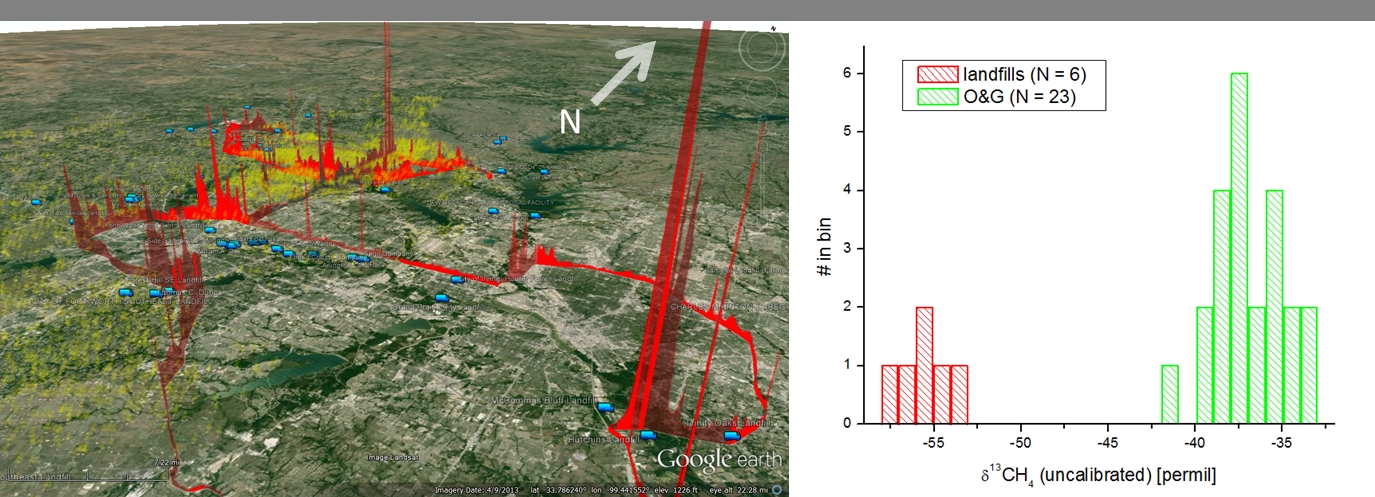
Figure 1 (original text): (left panel) Distribution of oil and gas well pads (yellow) and landfills (blue) in the Dallas / Ft. Worth area. Mobile nocturnal measurements of methane are shown in red, indicating a strong degree of source heterogeneity. (right panel) Histogram of individual isotopic source signatures, showing distinct signatures for landfills (red) and oil and gas sources (green).
2. NOAA investigated more shale areas using the mass balance technique
NOAA researchers presented data from research aircraft flights (similar to Karion et al., 2013 [2]) in the Barnett, Haynesville, Fayetteville, and Marcellus shale areas (abstracts A44A07-06, A44F-05, and A53H-02). Except for the Marcellus shale flight, clear-cut methane plumes were encountered in all regions, and co-emitted ethane was used to distinguish sources (Fig. 2). After analyzing all these data, methane emissions estimates from roughly one third of all new oil&gas development areas will become available.
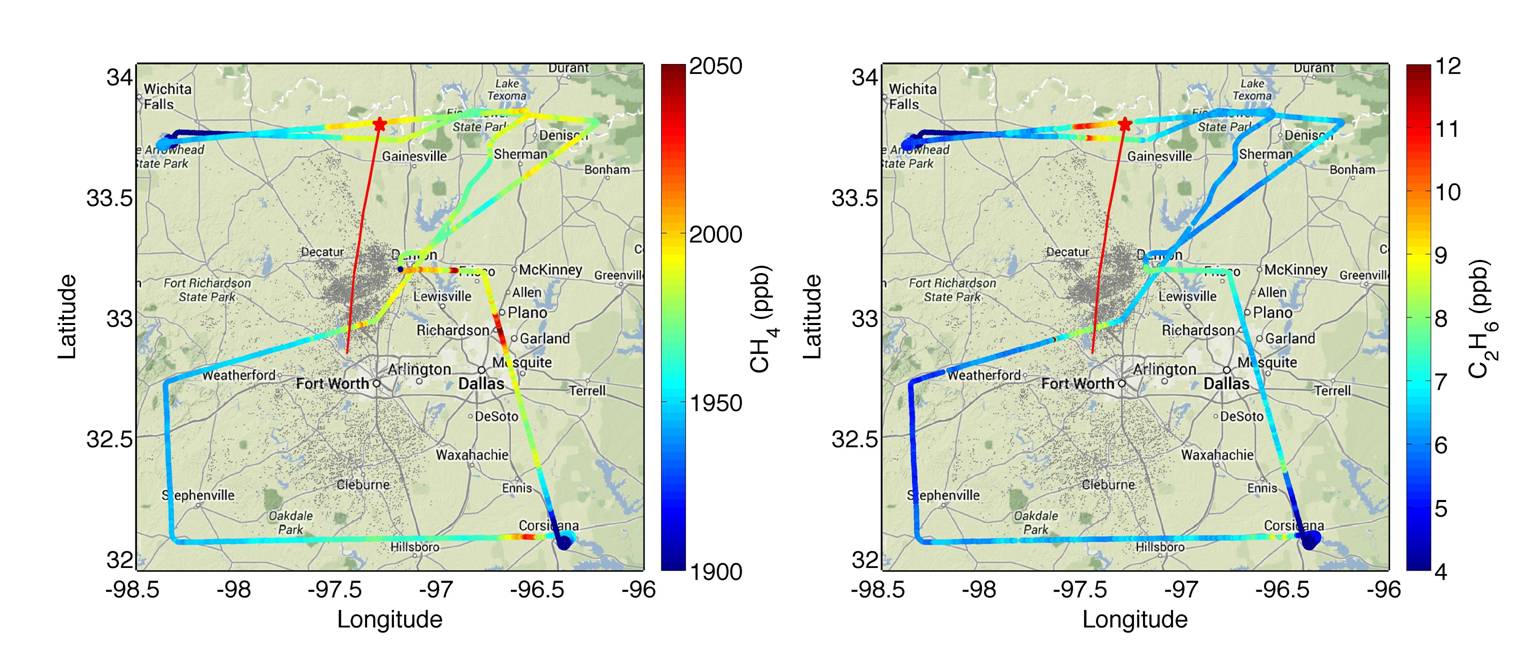
Figure 2 (original text): Flight track colored by methane (CH4, left) and ethane (C2H6, right) mole fraction. A three-hour back trajectory (red line) constructed from lidar wind measurements passes over the Barnett natural gas well locations (gray points) prior to reaching the location on the flight path indicated by the red star
3. Air pollution impacts are getting stronger recognition
For years now, ground level ozone in parts of Utah (Uintah basin), especially in winter, has been extremely high at times (>100 ppb), clearly affected by the extensive regional oil&gas development. Numerous posters and presentations showed that the hydrocarbons co-emitted with methane cause both particle and ozone pollution, and that winter snow cover is critical in enhancing the smog. Regional ozone enhancements due to oil&gas developments since 2007/08 are now measurable also in Texas.
Some conclusions
The presented data, including both well-site and atmospheric measurements, can be expected to enter the peer-reviewed literature later in 2014. In addition, now that the scientific community has developed an arsenal of investigation techniques, more measurements are likely to be carried out in the coming years, some already announced at the AGU Fall Meeting.
While not yet resolved, recent well-site and atmospheric methane measurements and associated emissions calculations suggest that the current inventory numbers for emissions from the oil&gas industry are likely underestimates. A continental scale estimate presented at AGU (abstract A44A-08) suggests that actual, nationwide emissions are more likely in the 3-5% range of produced natural gas. Emission rates may be significantly higher or lower locally, creating a large range of well-site variability, making upscaling from well-site measurements difficult and noisy at best.
At these leak rate levels, natural gas still holds a greenhouse gas advantage over coal combustion for electricity production in the long run. However, such leak rates are higher than claimed by the industry, and co-emitted or flared hydrocarbons produce locally and regionally recognized air pollution that needs to be addressed. While methane leaks may not have been on everybody's radar in the past, they have always mattered. Or as one AGU abstract (A53A-0138) elegantly summarized:
"There is increasing recognition that minimising methane emissions from the oil and gas sector is a key step in reducing global greenhouse gas emissions in the near term. Atmospheric monitoring techniques are likely to play an important future role in measuring the extent of existing emissions and verifying emission reductions."
References
1. Parrish, D.D., Critical evaluation of US on-road vehicle emission inventories. Atmospheric Environment, 2006. 40(13): p. 2288-2300.
2. Karion, A., et al., Methane emissions estimate from airborne measurements over a western United States natural gas field. Geophysical Research Letters, 2013. 40(16): p. 4393-4397.
3. Miller, S.M., et al., Anthropogenic emissions of methane in the United States. Proceedings of the National Academy of Sciences, 25 Nov. 2013, doi: 10.1073/pnas.1314392110.
4. Allen, D.T., et al., Measurements of methane emissions at natural gas production sites in the United States. Proceedings of the National Academy of Sciences, 16. Sept. 2013, doi: 10.1073/pnas.1304880110.
5. Pacsi, A.P., et al., Regional Air Quality Impacts of Increased Natural Gas Production and Use in Texas. Environmental Science & Technology, 2013. 47(7): p. 3521-3527.


While atmospheric methane levels are indeed several times higher than pre-industrial levels, the observed rate of increase has been substantially less than predicted by climate modelers.
[RH] Deleted image from report stating "Do not cite, quote or distribute."
Russ, could you please tell us where that graph is from? The timeline is odd.
Climate modelers do not "predict" methane emissions. They use the data assembled in the emissions projections, such as the RCPs used in AR5.
[-snip-]
And thank you, but I never suggested that models "predict" emissions. The chart is of concentrations, not emissions.
But the persistent difference between the projections and observations implies that either A) methane emissions have been significantly less than expected, B) methane's half-life in the atmosphere is significantly shorter than expected, or C) both.
[RH] Deleted link to report stating "Do not cite, quote or distribute."
Russ... The very first page of that link clearly states: "A report accepted by Working Group I of the IPCC but not approved in detail."
Thanks Russ.
RE "predicted": that is the wording you used in your first post above, "predicted by climate modelers".
And yes, total global emissions have likely been lower than expected in earlier assement reports. If you follow the literature, there is a lively discussion since approx. 15 years on the reasons for the mixing ratio plateau reached roughly 10 years ago. It is now thought to be due to a new equilibrium having been reached (sources equal sinks). The renewed increase suggests that this equilibrium is no longer present, meaning sources outweigh sinks again.
RH: all chapters are made available online by the IPCC here
http://www.ipcc.ch/report/ar5/wg1/#.UsYAr_vDswI
so we can discuss the contents.
Russ, the associate IPCC text is
Your graph is an adaptation of the actual IPCC graph, not the actual graph. Did you make it yourself, or where is it from?
It's like comparing apples to oranges to grapefruit to lemons, actually, because it's a very complicated issue. What it's like in one region may not be what it's like in another (or in the same region at a different time).
The NOAA Colorado study has its issues. They measured the amount of propane in the atmosphere and then estimated methane contents by assuming and then applying a methane to propane ratio. The problem is that they used the state average for the ratio. While this would be great if they measured the amount of propane in the atmosphere across the state, they only measured emissions in Weld County, which is an area that produces alot of natural gas liquids and has many condensate tanks where some liquids-rich gas is simply vented into the atmosphere. Why is this relevant? The state average would very likely have a much higher methane:propane ratio than just Weld County, which would lead to a large overestimate.
Further, Levi (2012) was published as a reply comment in JGR. It used the NOAA's measurements of propane and butane to estimate methane contents and found that they were pretty close to the generally accepted 1.5% leakage rate. After the NOAA (2011) study replied to his reply, JGR pulished another followup reply in Levi (2013).
http://blogs.cfr.org/levi/files/2012/10/JGRCH4.pdf
http://blogs.cfr.org/levi/2012/10/12/revisiting-a-major-methane-study/
http://www.agu.org/pubs/crossref/pip/2012JD018487.shtml
http://blogs.cfr.org/levi/2013/03/06/one-more-round-in-the-methane-debate/
http://blogs.cfr.org/levi/files/2013/03/JGRResponse-Accepted.pdf
Further, Colorado wasn't a great area to examine emissions from shale gas production because there was virtually no shale gas production in Colorado at the time. What they were exploiting is tight gas, which is treated significantly differently from an operational perspective. Tight gas wells tend to flow at much lower rates and, therefore, operators would often just vent the methane to the atmosphere after fracking the well (small fracks, mind you, very different than fracking shale). This, of course, could lead to higher emissions, but is no reason to condemn shale gas (though is a reason to criticize tight gas development).
That's just the science behind the Colorado study. What about policy and regulations? The NOAA took its measurements in 2008. Why is this relevant? Because in 2009, the state introduced new regulations to crack down on methane emissions (going after that venting problem with tight gas). Since then, the state has made the regulations even tighter, calling for major improvements like mandatory green completions (all gas flowback must be captured into a pipeline instead of being vented or flared) and requiring all high-bleed valves on a well to be replaced by low-bleed valves. These regulations should serve as a model for the country (frankly, they're fantastic).
http://www.nytimes.com/2013/11/19/us/colorado-governor-proposes-strict-limits-on-greenhouse-gas-leaks-from-drilling.html
The Utah study I'm less familiar with, though probably would also be a tight gas operation and not shale gas. Utah's regulations on emissions are very poor and it isn't a big producer of natural gas to begin with (nor will it likely be one in the future), so it might not be very representative either.
As for the UT (2013) study, what it represents is tightly controlled shale-gas operations. Are all shale-gas operations like this? Maybe not, but many are. Most importantly, new regulations from the EPA are going to make green completions for shale-gas operations mandatory across the country (i.e. no venting and no flaring starting January 2015), which will probably make the UT (2013) study representative of almost all shale gas operations in the future.
http://www.epa.gov/airquality/oilandgas/pdfs/20120417changes.pdf
Of course, like you point out, emissions to do with oil development still have to be tackled (an absolute waste of energy to flare or vent that gas). The EPA's upcoming regulations won't apply to this, although it would be nice if they did. Then there are emissions from transmission and distribution, which are getting the study they deserve if we're to know how much of a problem they could really be.
Overall, alot of the emission problem from the upstream side of the industry is easily manageable, with some government bodies already addressing it. That's not to say everything is rosy (it isn't), but it doesn't mean natural gas has been written off as a valuable tool in the fight against global warming. With some work, it'd be a good tool as long as we remember it's a bridge and we bring production down in the long term.
gws.
I haven't modified any graphs. I haven't the time nor the inclination to do that sort of thing.
The original graph I linked (now helpfully removed by moderators) was from Figure 1.7 from the AR5 WG1 second draft (Octcober 2012). That document is no longer on the IPCC website (but it is avialable on the web...[-snip-]... you'll have to google it yourself.),
Obviously, the second draft has been replaced on the IPCC website by the June 2013 final draft ([-snip-] the link you provided will lead you to exactly the same document [-snip-]).
[RH] Moderation complaints snipped.
So, despite the US boom in horizontal drilling and hydraulic fracturing that's described above, global methane emissions and concentrations are still significantly lower than projected by every single IPCC report.
It's also noteworthy that the IPCC's methane projections (along with others) migrated incrementally lower each time. (If you don't see why this pattern is noteworthy, I invite you to read Richard Feynman's 1974 comments about the replication and refinement of Milliken's oil drop experiment for measuring the charge of an electron.)
Methane concentration levels rose quite steadily for decades, plateaued briefly for a few years at the beginning of the century, then started rising again steadily from about 2006 on, just about the time that the boom in fracking really started to take off. (Graphs of these things are easily available on the web.)
I know that correlation does not necessarily prove causation, but let's not pretent that there is not a very strong correlation here, folks. It just makes you look as if you are trying to fudge the facts for some reason or other...
"With some work, it'd be a good tool as long as we remember it's a bridge". The problem I have always had with this statement, is that I do not see anyone laying the foundation, for the other side of this "bridge".
Russ, your argument on the projections is a non sequitur. Of course the science community corrected the projections over time because science progresses; we learn, we do better. That said, the global inventory (remember: it is only an educated guess) likely still overestimates methane emissions, mostly due to assumptions of (too?) high emission rates from coal mining in east Asia.
There is evidence from measurements and modeling (see the van Amstel review I linked, or Katzenstein et al., PNAS 2003, for a regional persepective) that North American (NA) methane emissions have generally been underestimated in the past. It is, however, speculation to link global atmospheric abundance to what happens in NA. As included in our post last year (linked above), global ethane abundance has dropped, suggesting that global fossil fuel related methane emissions may have dropped, especially in the former Sowiet Union in the 90ies. That likely contributed to the methane mixing ratio plateau. In general though, the plateau is driven simply by an approach to steady state due to a near contant global methane emission rate (550 +- 50 Tg/yr) between the mid 80s and mid 2000s.
Is the renewed increase linked to what happens (fracking?) in NA? Again, likely not. The methane abundance pattern, see here, is generally driven by the largest natural source, wetlands, especially in the tropics. I encourage you to watch Ed Dlugokencky's talk at AGU, session U33A-04. The midlatitude contribution is thought to be related to anthropogenic sources increasing, such as in East Asia, but the coarse resolution of the global data is not helping in pinpointing sources (see e.g. Bergamaschi et al., 2013, in JGR-Atmospheres).
Miguelito, continued hammering on the Petron et al. pilot study looks like a strawman at this point. As this post is trying to highlight, science has progressed much beyond that study. The Levi papers were included in our earlier post. His points are well taken, but I linked to the more detailed ClimateCentral study in this post.
Living in an oil/gas area of the country and spending an early part of my life dealing with natural seepage problems, the topdown NASA approach may be very misleading. We have houses and buildings in the local area where the natural emissions are so high that we intalled permanent tiki torches, membranes and collection systems (some passive and some with active pumping) to prevent explosive levels in the buildings. These tiki torches are still burning after 40 years.
A few of the larger natural sources are now going into generators for small scale power generation.
In the LA basin, there is a strong relationship between locations of natural gas seeps and locations that became large oil producing areas, but the natural seeps existed before the oil/gas wells. Some of the largest natural seeps are within 1 km of active wells and the existance of natural seeps of both oil and gas were used to locate good drilling sites, both on shore and offshore, before 4-D seismic studies.
How can natural seeps and oil filed induced leaks be separated in a low resolution study? Why should we give credability to the low resolution NASA type study? If they had no data before the oil field development, they have no real information beyond political PR.
Articles that discusses methane discusse cattle and ruminants but never seems to mention termites, which utilize the same microbiology as rumiminates with methanogenic bacteria to eliminate excess hydrogen from fermentation of carbohydrates. In tropical areas full of termites, the cellose that would not be eaten were the numbers of cows to be reduced would be consumed by the termites, so the net production of methane would not be diminished by diminishing cattle production.
[JH] Unnecessay white space eliminated.
deweaver, the atmosphere is not interested in which sources emit the methane, and the NOAA studies are not designed to study just oil&gas exploration emissions. However, they are still useful, and trustworthy, despite their integration over several possible sources, because the major non-oil&gas exploration sources (such as landfills and cow population) can be assessed independently, and then subtracted from the total. In addition, several tracers are used to distinguish between sources, such as co-emitted ethane and 13C-CH4.
Natural seepage cannot be easily distinguished from explorative sources, but while possibly large locally, the continental or global source is uncertain at best. There is, at this point, mostly speculation of how much it might contribute realtive to natural gas production. Dedicated measurements and careful extrapolation are needed.
Ruminants are a large anthropogenic source, approx. three to four times larger (75-95 Tg/yr) than the extrapolated termite source (20-30 Tg/yr), which has been investigated several decades ago. Your last statement is an interesting speculation, inferring that termite numbers would increase dramatically if you removed cattle production from a tropical area. Have any evidence for that?
Wili, I concur. My work is application oriented. I count on detail-oriented folks to keep the data and conclusion good, but the real world measurements seem more reliable to me than the menutia of inventory procedures. They have already been proven to be wrong, and it seems, manipulated by the industry. Real measurements by sampling seem much more reliable, but discounted in the article. In my book, I simply report EPA has been underestimating CH4 emissions measurements. Excellent work, though, Thanks.
@gws, Do you concur with Joe Romm that the EPA are significantly understimating the global-warming potential of methane compared to the latest IPCC figure of 34 over a 100-year time scale?
"Amazingly, the EPA has been using a GWP of 21 for its estimate of how methane compares to carbon dioxide — a figure that is nearly twenty years out of date. That means methane is a whopping 60% stronger than EPA calculates in its GHG inventory. Back in April, EPA finally said it was thinking about raising the GWP — to 25!"
Ref. http://thinkprogress.org/climate/2013/10/02/2708911/fracking-ipcc-methane/
Dallas showed high CH4 emissions. How much is known about emissions from natural-gas transmission and distribution networks in and between US cities and towns, and from such networks in industrial areas outside them--well, from transmission and distribution networks in the US? I've often wondered how these emissions compare to those associated with the fossil-fuel industries.
There are lots of old and poorly maintained gas lines; the San Bruno explosion south of San Francisco some years back underlined that.
Synapsaid:
You may be interested in this excellent long read on an amateur scientist looking for gas leaks in the US NE.
There is some information on the problem with corroding cast-iron distribution pipes here. Astonishingly, some of these pipes, still in use, were installed as early as the 1830s, decades before the Civil War.
Miguelito @6
Michael Levi has also written about the Uintah study. According to him, there is a fairly recent bottom-up study that showed that there are high leakage rates, around 5%, in that area due mainly to gas gathering and processing activities. Had the authors of the top-down study used a 2-sigma confidence interval, their results would have overlapped with the bottom-up results.
Stephen @16: Basically, yes.
However, consider that the EPA uses only data it considers very well established, and goes at times to extremes to make sure measurements and resulting data it uses are essentially unassailable (since the EPA has to defend itself in court a lot ...). Thus the outdated use of the methane GWP. Now that a new IPCC report is out, EPA will consider redoing calcs using the new GWP, but possibly not until a few more papers come out addressing that topic. I will not make a prediction.
What is the level of fugitive emissions at which natural gas has the same global warming effect as coal when used for electricity production?
The comparison should use modern, efficient coal fired plants and the most efficient natural gas plants to give the best case scenario for "base load" electricity. Many comparisons I have seen use the 100 year GWP for methane, but this is not realistic. We should worry about a much shorter timeframe and the use of the 20 year GWP of 84, or even the 10 year which I think would be way over 100.
It would appear that if the warming over shorter time frames is used that fugitive rates as low as 1% would totally negate any benefit compared with coal. What happens in the next decade is crucial.
Andy Skuce @ 18:
Thanks for the referral to the McKenna article--the very research we need is getting underway. This is the best news I've seen for a long time.
newairly @21: There is no single best answer on this since electricity production (or other natural gas uses) efficiencies vary. A more detailed monograph on this question was linked in the article, and the interactive graph is here.
An example for an instantaneous switch: Methane leaked has to be compared to the amount of carbon dioxide it would otherwise have produced had it not been released but instead burned to replace coal, so the molar GWP is what is needed for the calculation. Assuming a typical 40% higher efficiency of electricity production, 2.5 times less CO2 is emitted from a natural gas relative to a coal-fired power plant. If f is the fraction of methane leaked, then
GWPmol x f - 2.5 x (1-f) = 0
for the break-even point you asked about. Using a 20-yr GWPmol = 31 (aka 86/2.72), this gives f approximately equal to 7.5%.
Which GWP value you choose is less of a scientific, but rather political or moral question. The advantages of using natural gas over coal are obvious. Replacing coal by natural gas for energy production while minimizing methane leaks will reduce greenhouse gas emissions very significantly.
However, the important thing to realize is that this cannot be the final answer since natural gas is still a fossil fuel that is sure to run out eventually. Is its extensive use going to hamper the development of renewables? Are those advocating the "bridge" going to point out to the industry that they ought to stop exploring/mining in a few decades?
gws:
Our estimates of cattle biomass and food conversion effieciency with associated methane production is fairly well known. We do understand the microbiology of starting with anaerobic fermentation of cellulose to hydrogen and acetate, with the cow living on the acetate as a carbon source, and the hydrogen being detoxified (toxic to the fermenters) by reacting (using different bacteria) with CO2 to produce methane.
I have not seen good studies on termite food conversion efficiencies, and estimates of standing biomass and food consumption are SWAGS at best (Scientific Wild Ass Guesses). Remember there are many species of termite with different microbiological ecologies, whose efficiency depends upon the ability of the gut to prevent O2 diffusion in a very small high surface area/volume ratio reactor. Any O2 in an anaerobic microbiological reactor will destroy the food energy value by producing heat, CO2 and water from the cellulose. We are now obtaining good data on the microbiomes in people and cattle, but termits are far down the list of priorities.
In the tropics, only termites and ruminants can utilize cellulose for energy, and most of the tropic plants produce a lot of cellulose. If they produce proteins, some insect will eat them, and they live in nutrient-deficient soils with limited NPK, but an infinite amount of CO2 to create cellulose. Plants in the tropics don't have winter to kill off non-termite species of insects (who can't digest cellulose). The plants have a survival choice of becoming primarly non-digestable (cellulose/lignin) or toxic or both.
I have also not seen any discusssion about methane losses to bacteria in the soil and on surfaces. When you look at microbiological oxidation of methane to CO2 and H2O, the rates are dependent upon concentrations at low concentration ranges. There is an Smin (minimum substrate concentration) where the methane oxidation rates in aerobic soils goes to zero, but above that concentration the rate increases rapidly as the bacteria utilize a high volume food source.
This increasing rate of oxidation as a function of concentration can result in the biological oxidation rate increasing much faster than the concentration, making methane concentations in the atmosphere self-limiting as bacteria use the methane as a food supply. I have seen very little relevant research on biologial oxidation of methane.
I would be suprised that 5% of the methane being produced is being lost. Flow measurement and billing systems automatically determine BTU content and flow rates to fractions of a % accuracy. When 5% of 100 billion is 5 billion dollars, most businesses don't leave that much money on the table.
deweaver @24
Sure, more research on termites, especially their carbon cycle interactions in the tropics would be useful. However, it appears very unlikely that they produce as much methane as cattle globally. The consensus numbers on termite methane emissions are above (20 Tg), the highest number I have come across was 50 Tg, so unless the population numbers grow dramatically, it will remain a <=10% source.
Methanotrophy, the reason for methane uptake in soils, is relatively well researched. Global methane cycling models include the term, and all biosphere-atmosphere methane exchange models do as well. The sink is estimated to represent <10% of the global sink to the atmosphere, likely around 5%. Methanotrophy locally limits emissions from deeper soil sources, but at a deposition velocity of only 0.01 cm/s at best even if applicable to 50% of Earth's land area, you would get a steady state methane mixing ratio of around 4 ppm at the very best if relying entirely on soil uptake. Can you boost that? Sure: restore more carbon to soils and you increase methanotrophy.
Human wastefulness seems like a given. So a 5% loss rate of produced gas does not seem unreasonable to me. Typical short-term thinking (and profit) keeps most of us from making the "right" long-term (and profit) decisions. Why do you think gas companies did or would do any differently?
Distinguishing between biogenic methane sources, (soils, termites etc) and fossil methane is straightforward. I would assume studies of fugitive emissions have done this?
Yes, the most straightforward way to do that is looking for co-emitted ethane (and/or higher alkanes not coming from natural sources) as described above. Another method is investigating the 13C/12C carbon isotopic ratio of methane, which is lower for natural sources from methanogenesis than for the fossil fuel source (basically pyrolysis). All studies I discussed used either one or both of these methods to distinguish between sources contributing to the (excess) atmospheric methane mixing ratio investigated.
gws,
How do you get a velocity of only 0.01 cm/s. When the rate of distruction in soils and on surfaces are a non-linear funtion of the concentration and the problem of mass transport from the atmosphere to the soil is a complex problem with both advection terms due to atmosperic pressure fluxiations and diffusion terms, there is no way a simple velocity function could every fit the data.
Once the concentation is above Smin (energetic break even concentration for the bacteria), the biomass will rapidly increase to bring the concentration back down to Smin in a dynamic equilibrium with the mass transfort function. With diffusion being an X^2 type function, non-linearity is basic to the problem and increasing concentration can result in a very rapid destruction rate with all moist surfaces biodegrading methane as fast as it reaches the surface.
I don't know that concentration level, but we should know it.
deweaver @28: That number was calculated from methane soil uptake flux data dividing by the atmospheric concentration (definition of deposition velocity; used when uptake is first order as in teh case of microbiol uptake). Typical uptake rates are around 1 mg m-2 d-1, atmospheric methane is about 1.2 mg m-3. Gives about 0.001 cm/s, I meant to estimate high. I see if I can find some papers to list here. Compared to other gases, soils are not good sinks for methane.
check, e.g., here, here, or more detailed here (Fig. 5).
newairly @21 & gws @23
Surely focussing on electricity generation alone gives a false sense of security about what level of fugitive emissions of natural gas produces the same global warming effect as coal?
In the US for example, the vast majority of coal (~90%) is burnt by the electric power sector, whilst the majority of natural gas (~70%) is burnt or otherwise consumed by innumerable much less efficient end users across the economy (namely in sectors covering residential & commercial buildings, industry and transportation).
My understanding is this the main reason why Howarth et al from Cornell University rejected the electric power sector-only comparison between gas and coal as flawed is because gas in particular is burnt with very high efficiency in power stations. In isolation, this scenario takes a flatteringly high amount of methane leakage to achieve the same global warming effect as coal - namely the 7.5% figure given above by gws.
However what of all the other energy uses of natural gas? Howarth et al took this into account by normalising the quantity of energy released at the time of combustion. This seems to me to be a far more realistic approach, but one that unfortunately results in a far lower methane breakeven leakage rate. My recollection is the Howarth et al methodology produces a far less comforting breakeven leakage rate of only ~3%, which is well in line with the recent Miller et al findings on actual methane leakage rates.
Ref "Methane and the greenhouse-gas footprint of natural gas from shale formations" (Robert W. Howarth,Renee Santoro,Anthony Ingraffea)
Stephen @31,
You are of course correct that the viewpoint of electricty production maybe a focus too narrow; the Howarth vs. Cathles discussion in Climatic Change linked in our previous post may give a broader perspective. For instance, for natural gas use in homes (e.g. water heaters) one has to consider extra leakage from the distribution system and compare to the alternative method (here, e.g. heating with electricity and how that is produced), while considering the efficiencies of both processes. In some the natural gas use may be more, in some less efficient than in the power plant comparison. And thus in some regions, the alternative energy source may be even worse while in others better suited to minimize GHG emissions. No one-size-fits-all.
I often invoke the example of Germany ~20 years ago: After the iron curtain fell, the country converted much of its home central heating units nationwide away from oil/electricity to much higher efficiency natgas burners, therefore saving large amounts of GHG emissions. At the same time, this reduced Russian methane emissions because they fixed production and pipeline leaks in response to the economic incentives from the west, a win-win situation. Meanwhile, the Germans have realized that this conversion only goes so far, and that climate change cannot be addressed sufficiently with natural gas ...
... which reminds me of this famous quote:
Informative story on NPR this morning:
Much of North Dakota's Natural Gas is going up in Flames
Situation is similar in Texas.
Two new, contrasting studies addressing air pollution from shale areas have been published:
1. A study published by a Houston company in Science of the Total Environment found no significant impact from oil and gas extraction activities in the Barnett shale region of Texas for a selected subgroup of air toxics (the paper title is thus somewhat misleading).
2. An investigation by a 3-member consortium (Center for Public Integrity, InsideClimate News and The Weather Channel) found that, in the Eagle Ford shale region of Texas, an ever increasing amount of emission permits given to frackers and limited state oversight suggests that air toxics emissions have strongly increased in a previously low emissions region, leading to very significant impacts.
The air quality perspective of fracking-driven new oil&gas development is getting more attention:
NPR, Inside Climate News, NPR All Things Considered, Ecowatch, and, as an academic example, a discussion on legal aspects and local government roles (note: these are heavily weighed toward Texas)