Climate Science Glossary

Term Lookup

Enter a term in the search box to find its definition.

Settings

Use the controls in the far right panel to increase or decrease the number of terms automatically displayed (or to completely turn that feature off).

Term Lookup

Settings


All IPCC definitions taken from Climate Change 2007: The Physical Science Basis. Working Group I Contribution to the Fourth Assessment Report of the Intergovernmental Panel on Climate Change, Annex I, Glossary, pp. 941-954. Cambridge University Press.

Home Arguments Software Resources Comments The Consensus Project Translations About Support

Bluesky Facebook LinkedIn Mastodon MeWe

Twitter YouTube RSS Posts RSS Comments Email Subscribe


Climate's changed before
It's the sun
It's not bad
There is no consensus
It's cooling
Models are unreliable
Temp record is unreliable
Animals and plants can adapt
It hasn't warmed since 1998
Antarctica is gaining ice
View All Arguments...


Username
Password
New? Register here
Forgot your password?

Latest Posts

Archives

The Little Ice Age: Skeptics skating on thin ice

Posted on 9 September 2010 by gpwayne

Climate change skeptics suggest that because the climate has changed dramatically in the past – and without man’s intervention – it is possible that current changes to the Earth’s climate are also a natural event. You may be familiar with paintings depicting Londoners skating on the frozen River Thames, when winters, at least in the northern hemisphere, were more severe. The beginning and end of this period are subject to various interpretations, but the period is referred to as the Little Ice Age (LIA) and occurred between the 16th to 19th centuries.

Limited History

If we are to understand the LIA, we need to figure out what caused it. Scientists have examined several important strands of evidence about the LIA, including the activity of the sun, of volcanoes, and ocean heat circulation, principle drivers of natural climate change.

The activity of the sun can be assessed by looking at proxies – processes we know are affected by the sun’s activity. One of these is the formation of the radioactive isotope Carbon-14 in the atmosphere, which plants then absorb. By measuring carbon-14 in tree rings and other materials we know are from a certain period, we can estimate how active the sun was at the time. This graph shows the sun’s activity over the last millennium:
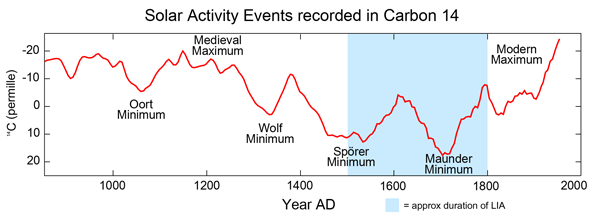
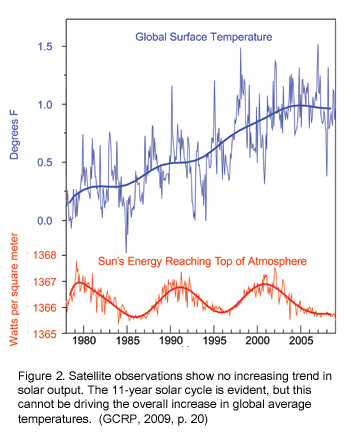
The carbon-14 data used in this graph go up to 1950. The graph below gives a fuller picture, showing that in the last three decades, the sun's normal cycle of activity has remained steady, while temperatures have shot up:
Yet while the dips in solar activity correlate well with the LIA, there are other factors that, in combination, may have contributed to the climate change:

  • Volcanic activity was high during this period of history, and we know from modern studies of volcanism that eruptions can have strong cooling effects on the climate for several years after an eruption.
  • The ‘ocean conveyor belt’ –  thermohaline circulation – might have been slowed down by the introduction of large amounts of fresh water e.g. from the Greenland ice cap, the melting by the previous warm period (the Medieval Warm Period).
  • Sudden population decreased caused by the Black Death may have resulted in a decrease of agriculture and reforestation of agricultural land.

Can We Draw a Conclusion?

In truth, not really. The Little Ice Age remains for the present the subject of speculation. The most likely influence during this period is variable output from the sun combined with pronounced volcanic activity. We know that from the end of the LIA to the 1950s the sun’s output increased. But since WW2 the sun has slowly grown quieter, yet the temperature on Earth has gone up.

The skeptical argument that current warming is a continuation of the same warming that ended the LIA is unlikely. There is a lack of evidence for a suitable forcing (e.g. the sun) and numerous correlations with known natural forcings that can account for the LIA itself, and the subsequent climate recovery. Taken in isolation, the LIA might cast doubt on the theory of climate change. Considered alongside the empirical evidence, model predictions and a century of scientific research into the climate, recovery from the LIA is not a plausible theory to explain the observed evidence and rate of global climate change.

This post is the Basic version (written by Graham Wayne) of the skeptic argument "We're coming out of an ice age".

0 0

Printable Version  |  Link to this page

Comments

Comments 1 to 21:

  1. This is a fascinating follow up from dana1981's post. The C14 data cited show a solar activity level just around 1950 that is greater than that of the putative mediaeval warm period. If we go back to dana's post, we find a graph taken from Lockwood (2001) which shows maximum coronal source flux in the mid 1990s 1.5 times greater than the 1750 maximum. Lockwood's paper is rich in data - the abstract says coronal source magnetic flux had risen 34% since 1963 and 140% since 1900. If I understand her correctly, flux is a good measure of TSI. Her 10Be isotope data which she says is also a good proxy for flux suggest peaks in 1500 with a trough around 1520 and a huge trough in 1700. 10Be peaks dramatically around 1950 as best as I can make out from her graphics. I'm not quite sure how her data translate into the current decade with its 'quiet' sun. Alas, I haven't yet mastered (and probably never will) the art of posting links and graphics but then I always was a technological dinosaur :-( But I would be interested if anyone wanted to have a closer look and see how these data play out in the overall picture. And my wife has soundly taken me to task for hanging round the blogosphere at 1.30 am when I'm meant to be finishing a psych report :-)
    0 0
  2. Chris: And my wife has soundly taken me to task for hanging round the blogosphere at 1.30 am when I'm meant to be finishing a psych report :-) Nobody on the Internet would be wrong, if we were all bachelors. :-)
    0 0
  3. Re: doug_bostrom (2)
    "Nobody on the Internet would be wrong, if we were all bachelors."
    If we were all bachelors we wouldn't be on the Internet. Catch-22. Nice post Graham! You may want to reiterate that, while the LIA was an intensely "personal" event to those in Northern Europe, there is a lack of evidence to extend its effects to the rest of the globe (thus no "global cooling" during the LIA). The Yooper
    0 0
    Moderator Response: [Graham] Thing is Dan, when we lack evidence - and this applies to the MWP as well as the LIA - introducing the global argument serves to muddy the waters, and may be construed as over-egging the issue. A lack of evidence is not grounds for suggesting further problems with the skeptical argument in my opinion.
  4. What is really worrying is that solar activity has been so quiet since 1950, yet temps are still increasing. This implies that once solar activity starts up again, global warming will speed up - is this right?
    0 0
  5. A feature of the Little Ice Age were Frost Fairs on London's Thames, when it froze in the winter. I have heard claims that these were annual occurrances, but they were not, but were quite infrequent and were often of short duration. The last one was held in 1814, and lasted 4 days. Frost Fairs
    0 0
  6. Re: Cornelius Breadbasket (4) Many factors are in play regarding temperature balance, with solar activity being just one. If solar activity ramps up and other forcings and feedbacks stay uniform, then yours would be a reasonable assumption. So, yes, you would be correct in that event. But remember that solar forcing, compared to other forcings, is not the main actor on this stage. CO2 is the big dog. If, at the same time, man reduces the quantities of sulfate aerosols injected into the atmosphere (which act to reduce the GHG warming coming from the CO2, then temperatures could rises even more. Factoring in albedo changes in the Northern Hemisphere if, as expected, the Arctic sea ice melts out in the next few years, then expected changes could get very "pronounced". All of these converging together = bad news. Worst case scenario: If on top of all this a methane hydrate/clathrate release initiates... ...then the Earth pinball game goes TILT. What is certain: many uncertainties exist. And we're all in this together. The Yooper
    0 0
  7. This "basic version" is pretty good; I really love the title. But again, as I have said so often, a "basic version" has to avoid the fancy vocabulary that repels the target audience: 'thermohaline' and 'forcing'. It is especially bad that 'forcing' is used with no preparation for the technical sense of the word, which is SO different from the sense the reader is likely to assume -- if he assumes any meaning for the word at all. Also, I would have put much more emphasis, using bold fonts and the like, on "But since WW2 the sun has slowly grown quieter, yet the temperature on Earth has gone up." Such emphasis goes a long way to prepare the reader for the conclusion that the skeptics argument is completely groundless. That, by the way, is what the article should be saying instead of pathetically weak conclusion like, "the skeptical argument... is unlikely". We can say a lot more about it than just 'unlikely'. The skeptical argument is wrong, very wrong. We should say so in no uncertain terms.
    0 0
    Moderator Response: [Graham] Sorry, but this is the statement that's wrong: "We can say a lot more about it than just 'unlikely'. The skeptical argument is wrong, very wrong". That may be your opinion, but there is no scientific evidence to support it. If there was I'd be more than happy to use it, but in this instance we really must be candid, and admit the uncertainty that pervades this whole issue. Fact is, if the cause and effects of the LIA and MWP were not so equivocal and our knowledge so sketchy, the skeptics wouldn't keep bringing it up. The argument is weak, but so is any rebuttal that relies solely on scientific evidence.
  8. The anecdotal evidence about frost fairs in London is very charming, and a staple of 'sceptic' discourse, but if the Wikipedia entry is to believed the river froze over significantly only a few times a century and that is counting winters when it 'more or less' froze over so presumably would not have supported people, stalls and games. And a painting is cited as if it were evidence of a commonplace phenomenon, when it is at least as likely that it was painted because the scene was so unusual and therefore worth commemorating. Other rivers in southern England have also frozen over, the Severn for example ca 1883 and possibly also in the 20th century (I'd really like to find some comparative figures). What happened with the Thames in the 19th is that the old London bridge, with its narrow arches that restricted flow, was demolished, and also the river was given embankments and made much narrower. So not only does it flow faster now but it presumably is more saline that it used to be in the stretch that froze over (it is tidal way above central London). One of the things about many sceptics (Watts notably) is that they are shameless in their use of anecdotal evidence, exactly like homeopaths and other pseudomedicine practitioners.
    0 0
  9. Daniel, I have to disagree with you on this one about evidence for LIA as a global event. MWP wasnt but I think there is pretty good evidence that LIA was. (eg High-Frequency Holocene Glacier Fluctuations in New Zealand Differ from the Northern Signature
    0 0
  10. My understanding from the literature is that the LIA was confined to northern Europe, and there is suggestion that it is linked to the behaviour of jetstreams in reponse to solar activity (sunspots). The same response that has been seen in the last few years while solar activity has been low. Jetstreams dipping, cold winters in Europe - but not in Alaska. If indeed it is accepted that the LIA was restricted then it deserves mentioning in the basic version post.
    0 0
  11. Re: scaddenp (9), John Chapman (10) Surprisingly, I agree with Phil (thanks for reminding me of this study, Phil; I'd not had the pleasure of a fuller read of this one yet, so I really appreciate you bringing it to my attention again). I was able to locate a free copy of the study here. If you have a different take on this, let me know. From the text:
    Three main conclusions can be drawn. First, there is a notable interhemispheric disparity in the timing of the maximum ice extent. The Mount Cook glaciers were further advanced about 6500 years ago than at any subsequent time. In contrast, most Northern Hemisphere glaciers reached their greatest Holocene extents during the LIA (1300 to 1860 C.E.). Second, several glacier advances beyond the extent of the 19th century termini occurred in New Zealand during northern warm periods characterized by diminished or even smaller-than-today northern glaciers, such as between 7500 and 5500 years ago in the Swiss Alps (22) and Scandinavia (23), during the Bronze Age Optimum [about 1500 to 900 before the common era (B.C.E.)], during the Roman Age Optimum (200 B.C.E. to 300 C.E.), and during the MWP (800 C.E. to 1300 C.E.). Third, the greatest coherency between the Mount Cook and Northern Hemisphere records was during the Dark Ages (300 C.E. to 700 C.E.), and broad similarities were apparent during the past 700 years (the northern LIA), with multiple glacier advances followed by a general termination commencing in the mid- to late 19th century. However, northern Holocene moraine sequences are dominated by the LIA-maximum terminal moraine less than 400 years old (typically mid-19th century in the Swiss Alps and mid-18th century in Scandinavia), whereas the most prominent moraine of the past millennium at Mueller Glacier is about 570 years old and is followed inboard by several smaller moraines. This pattern of broad consistency but differing detail of glacier behavior has continued over the past 150 years. Our results are in accord neither with the hypothesis of interhemispheric synchrony of mid- to late Holocene climate change nor with a rhythmic asynchrony, downplaying the importance of global driving mechanisms. This includes solar irradiation changes translating quasi-linearly into near-surface climate. However, recent studies show that climate models driven by solar changes can induce regionally distinct temperature changes (26), and indeed the Mount Cook moraine chronology shows some similarities to the solar record [e.g., (26)]. ...our study shows that mid- to late Holocene glacier fluctuations were neither in phase nor strictly antiphased between the hemispheres, and therefore it is likely that regional driving or amplifying mechanisms have been an important influence on climate.
    My take: While some of the moraine, tree and glacier data is consistent with the LIA being a global event, some is not, which the authors themselves note. However, while checking the cites on this one, I found this other study on glaciers in Peru with more robust findings (enough so I won't bother to waste the time to summarize). It does offer up some interesting rationale as to the why, which I'll leave for someone else to dig into, if they're interested. It was good enough to convince me. After reading this one, Phil, I am satisfied with your correction of me that the LIA was most likely a global event, albeit one with some localized temporal asymmetry. I was wrong in my original contention and appreciate being enlightened. I blame low blood-alcohol levels. :) The Yooper
    0 0
  12. Daniel, I chatted with one of the authors (Barrell) about it over morning tea. He was more hesitant - probably global, but there are many issues relating things like the Be10 timescale calibration, understanding regional ice patterns, etc. In short, a lot of work still be done before the situation is clearer. Interhemispheric connections will be a research topic for a long time to come.
    0 0
  13. A couple of points. -LIA and low solar activity shows a good correlation, meaning small changes in solar output are magnified, ie positive feedback, possibly by clouds. -At least 2 provable lag effects with regards to solar activity are known -daytime maximum T after highest solar output (around 25% lag time), and seasonal maximum T (again, around 25% after maxmum solar output). Applying 25% lag time to the solar output from 1700-1950 indicates maximum T around 2010-now. This explain the T increase since 1950 without much change form the sun, and should even continue to increase since solar output, unlike seasonal and daily effects,m hasnt declined much. Furthermore, the ocean is known to produce a longer lag effect on top of solar lag effects which apply to eg daily and seasonal effects, further enhancing/smearng out solar lag effects. Your argument that 20th century warming post 1950 is based on tweaking model dials, can be untweaked if eg solar lag effects above are taken into such models. Its interesting that you call the causes of LIA- a known event- as speculation, but something that hasnt even happened yet, projected T rises, this site calls their likely causes as solid as a rock! Have AGW proponents got their probabilities all mixed up? I think so. Moreover your comment •"Sudden population decreased caused by the Black Death may have resulted in a decrease of agriculture and reforestation of agricultural land. " is a bit of a fantasy. This is researchers reaching for a human effect where they cant find any, to bolster their paticular human-induced angle. T was dropping worldwide after MWP, and popluation worldwide was increasing. How this kind of thing can get a mention in line with a ball of variable nuclear reactions millions of time bigger than the earth, is beyond me. I think your discussion above is generally good/logical, but various parts/probabilities assigned will be shown to be misinterpreted/wrong in future years.
    0 0
    Moderator Response: [Graham] You say " various parts/probabilities assigned will be shown to be misinterpreted/wrong in future years". OK - can I see your data on that please - or did you throw the tea leaves away? :)
  14. thingadonta - "Your argument that 20th century warming post 1950 is based on tweaking model dials, can be untweaked if eg solar lag effects above are taken into such models. " This is simply not true and I dont think this discussion is improved by baseless assertions. There is a huge literature on model creation. Please show us where models are tweaked to fit a warming. Likewise, this detail of "lags". What makes you think that the underlying physics is missing from models? (Hint - how do think energy flows are calculated?).
    0 0
  15. Re: scaddenp (12) Thanks for the update. Sounds like you have the makings and material for a SS post of your own on this. I, for one, would look forward to a review by you on it. The Yooper
    0 0
  16. No Daniel - I watch the subject with interest but it is outside my area of expertise. I have moments of wishing that I had specialised in quaternary geology - it certainly is fascinating.
    0 0
  17. In support of a non-global event, pasted direct from Wikepedia: "The Intergovernmental Panel on Climate Change (IPCC) describes areas affected by the LIA: Evidence from mountain glaciers does suggest increased glaciation in a number of widely spread regions outside Europe prior to the 20th century, including Alaska, New Zealand and Patagonia. However, the timing of maximum glacial advances in these regions differs considerably, suggesting that they may represent largely independent regional climate changes, not a globally-synchronous increased glaciation. Thus current evidence does not support globally synchronous periods of anomalous cold or warmth over this time frame, and the conventional terms of "Little Ice Age" and "Medieval Warm Period" appear to have limited utility in describing trends in hemispheric or global mean temperature changes in past centuries... [Viewed] hemispherically, the "Little Ice Age" can only be considered as a modest cooling of the Northern Hemisphere during this period of less than 1°C relative to late 20th century levels.["Climate Change 2001: The Scientific Basis". UNEP/GRID-Arendal. http://www.grida.no/climate/ipcc_tar/wg1/070.htm. Retrieved 2007-08-02] Several causes have been proposed: cyclical lows in solar radiation, heightened volcanic activity, changes in the ocean circulation, an inherent variability in global climate."
    0 0
  18. Surely the "recovery from the LIA" argument fails on basic logic anyway? It's much warmer now than it was before the LIA, by that logic temperatures should have levelled off before now. It's like saying you are still climbing out of the valley when you are half way up the mountain.
    0 0
  19. Thingadonta at #13: we already discussed the diurnal temperature changes before and clarified that there was no "lag" so you should at least leave the diurnal cycle out of your speculations. A couple of months ago, Arkadiusz was kind enough to point out the SHALDRIL project. Milliken has studied the core extensively and says: " There is no compelling evidence for a Little Ice Age readvance in Maxwell Bay. The current warming and associated glacial response in the northern Antarctic Peninsula appears to be unprecedented in its synchroneity and widespread impact." http://gsabulletin.gsapubs.org/content/121/11-12/1711.abstract
    0 0
  20. thingadonta writes: LIA and low solar activity shows a good correlation, meaning small changes in solar output are magnified, ie positive feedback, possibly by clouds. If there are strong net positive feedbacks in the climate system, that means that climate sensitivity must lie on the high end of the range and 21st century warming will probably be worse than models predict. Is this really an argument you want to make? thingadonta continues: At least 2 provable lag effects with regards to solar activity are known -daytime maximum T after highest solar output (around 25% lag time), and seasonal maximum T (again, around 25% after maxmum solar output). Applying 25% lag time to the solar output from 1700-1950 indicates maximum T around 2010-now. Oh, come on; there's no physical basis for a constant "25% lag time" that can be consistently extrapolated across temporal scales from a single day to multiple centuries. But in any case, once again this would be bad news for the 21st century since it would mean that more of the impact from our previous CO2 emissions must still be "in the pipeline". thingadonta continues: Its interesting that you call the causes of LIA- a known event- as speculation, but something that hasnt even happened yet, projected T rises, this site calls their likely causes as solid as a rock! Why is that surprising? We can only study the LIA through sparse historical records, uncertain proxies, and climate models. We can't go back in time and place satellites in orbit to measure TSI, volcanic aerosols, etc. In contrast, we know much more about the current climate. We know that TSI is stable or slightly declining, we know that CO2 is increasing and that it's coming from fossil fuels rather than the oceans, and so forth. This is not to be dismissive of paleoclimate studies -- we really can learn a lot about the MWP, LIA, etc. from historical data, proxies, and models. But it shouldn't be at all surprising that we know much more about what's happening today.
    0 0
  21. ”Volcanic activity was high during this period of history ...” However, it appears that the high volcanic activity may be warming rather than cool. Sulphur aerosols act (higher albedo), a relatively short time - causing the cooling. Volcanoes “stratospheric” would erupt every year - as was the case during the Triassic. Volcanoes as an ozone-destructive - act in a very long period of time. Example: LIA - Tambora eruption in 1815 - "year without summer" in Europe - but the years 1818-3? was warmer or much warmer than before the eruption of the volcano. Ozone - the thinner the layer - the higher the mortality of marine phytoplankton. Phytoplankton and Cloudiness in the Southern Ocean: “The effect of ocean biological productivity on marine clouds is explored over a large phytoplankton bloom in the Southern Ocean (SO) using remotely sensed data. Cloud droplet number concentration over the bloom was twice what it was away from the bloom, and cloud effective radius was reduced by 30%. The resulting change in the shortwave radiative flux at the top-of-the-atmosphere was -15W m-2 ... ” Positive feedback - the more ULV = the less phytoplankton = the lower the cloud cover = more ULV ...
    0 0

You need to be logged in to post a comment. Login via the left margin or if you're new, register here.


The Consensus Project Website

THE ESCALATOR

(free to republish)


© Copyright 2024 John Cook
Home | Translations | About Us | Privacy | Contact Us