The HadSST4 Sea Surface Temperature dataset
Posted on 5 July 2019 by Kevin C
The oceans cover two thirds of the surface of the earth, and so sea surface temperatures form a vital part of our understanding of the impact of human activity on the temperature of the planet. Sea surface temperatures contribute to estimates of global surface temperature change which are widely used in the evaluation of climate models, the estimation of internal modes of climate variability, and the setting of political targets. The ways in which sea surface temperatures have been measured by ships, buoys and satellites have varied much more significantly over time than equipment at weather stations; these changes have to be corrected when evaluating historical temperature change. Differences between different sea surface temperature datasets highlight where some of these corrections are uncertain, however users of temperature data frequently ignore these uncertainties and the effect they may have on their conclusions.
This issue was highlighted in a paper by Kent and colleagues in 2017, which made a call for action both for temperature record providers to make more progress on these issues, and for users to be aware of what the data can and cannot tell us. A number of authors have responded by investigating aspects of the sea surface temperature record (e.g. Hausfather et al 2017, Cowtan et al, 2017, Carella et al 2018, Davis et al 2018). Last week the latest version of the UK Hadley centre sea surface temperature dataset, HadSST4, was released.
The Hadley centre have been at the forefront of the development of sea surface temperature data for many years, providing the only sea record which attempts to reconcile the measurement types of individual observations. A Japanese dataset, COBE-SST2, also uses the Hadley analysis of data corrections in combination with an alternative post-processing algorithm to produce an infilled sea surface temperature reconstruction.
Other datasets apply more coarse grained corrections: NOAA's ERSST (Huang et al, 2017) corrects the gridded ship temperature field on the basis of smoothed differences between water and air temperature measurements, while my own coastal hybrid reconstruction (Cowtan et al, 2017) uses coastal weather stations to estimate a global correction for the combined impact of different types of sea surface temperature observations.
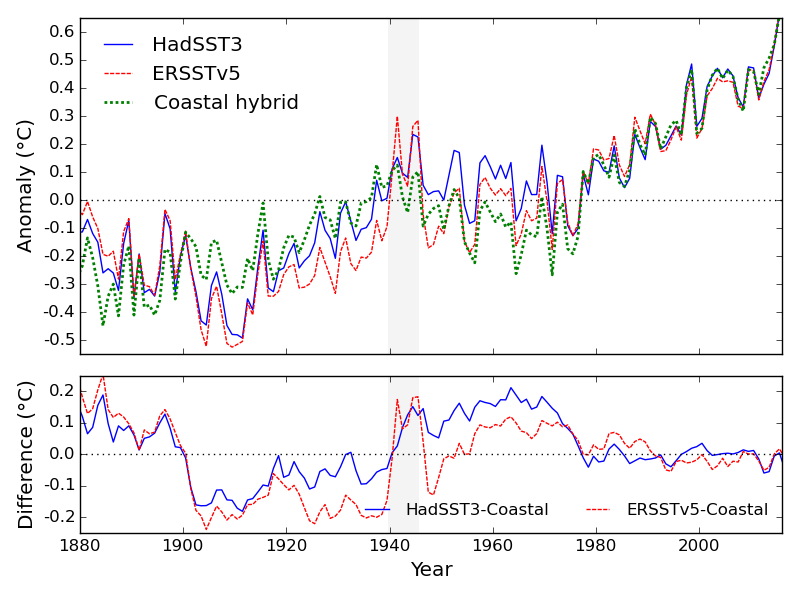
The problem is that these methods lead to different answers (Figure 1), suggesting that the required corrections for the different observations are not yet well understood. More seriously, these differences are often comparable to the size of the sources of internal variability which some authors infer from these data! Agreement between the datasets is good between 1980 and 2005, however in the 1950s and 1960s ERSST5 is cooler than HadSST3, and the coastal hybrid record is cooler still. There are large differences during World War 2. In the early 20th century the coastal hybrid record is warmer than the others. In the 19th century ERSST5 is the warm outlier. HadSST3 also shows a lower trend than the other datasets of the supposed "hiatus" period (Hausfather et al, 2017).
 Comparison of HadSST3 (the current version of the UK Met Office dataset), ERSST5 (the current NOAA sea surface temperature dataset), and the coastal hybrid sea surface temperature dataset (from Cowtan et al, 2017). Temperature averages are calculated using common coverage.
Over the past couple of years the Hadley centre have contributed to significant work on the mid 20th century (Carella et al 2018, Davis et al 2018). In particular Carella and colleagues provide a new method for distinguishing between sea surface temperature observations using buckets versus engine room intakes, based on evaluation of the diurnal cycle in the observations. This leads to changes in the inferred observation type in cases where metadata are missing or unreliable, and as a result changes the distribution of observation types in the 1950s and 60s. Improvements have also been made to the estimation of the correction required for different observation types, including the differences between different types of buckets.
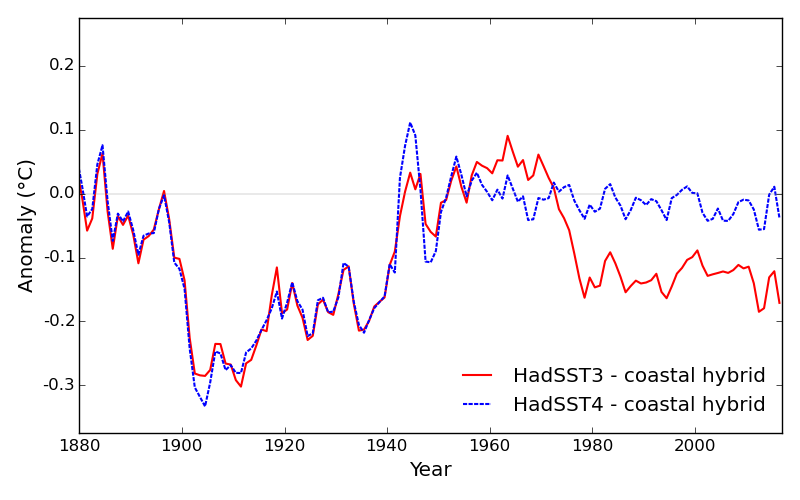
These changes, along with corrections to recent temperature observations determined from satellite data and surface and subsurface automated probes, have been incorporated in a new version of the Hadley record, called HadSST4 (Kennedy et al, 2019). The new version is significantly cooler for the period from 1950-1975, and also shows more temperature change on a centennial timescale. When compared to the coastal hybrid temperature record (Figure 2), the big step around 1975 has been completely eliminated, and (more tentatively) temperature change since the 19th century shows better agreement, although there are still large unexplained differences in the early 20th century.
 Comparison of the current and new versions of the UKMO sea surface temperature data (HadSST3 and HadSST4) to the coastal hybrid temperature record of Cowtan and colleagues (2017).
Where does this leave us? Over the past couple of years I have been recommending that people baseline their temperature comparisons on the period 1981-2010, because there are significant differences between datasets prior to that point. The largest disagreements arising between 1950 and the present have been substantially reduced, providing more flexibility with regard to choice of baseline. Trends in this period, including the supposed "hiatus" period, are also more consistent between datasets. The large changes to the period spanning 1950 to 1975 will change the conclusions of many papers on internal variability in sea surface temperature (which were arguably never well founded). HadSST is no longer a warm outlier on this period: it is now cooler than ERSST and in good agreement with our coastal record. The continuation of ship bias correction right up to the present (first done in ERSST in 2015) brings HadSST into very good agreement with all other SST datasets from the late 1990s on.
The early 20th century is more difficult. Our coastal record suggests that HadSST3 and 4 are too cool in this period (as do many climate model simulations), however ERSST comes to a similar conclusion to HadSST by different means. World War 2 shows very large discrepancies. Assigning observation types and estimating corrections becomes increasingly difficult as the data and metadata become sparser, and the problem is so hard that no-one outside the Hadley team and associates is even attempting it.
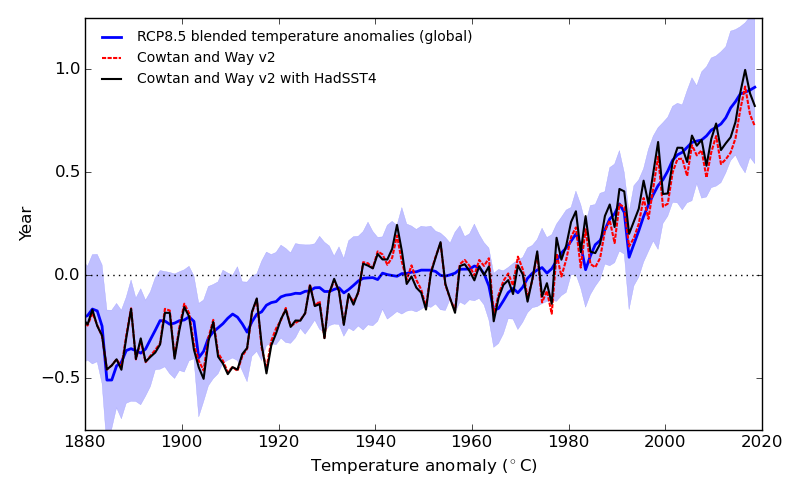
I have made available a new version of our infilled land-ocean temperature reconstruction (Cowtan & Way 2014, Richardson et al 2016) using HadSST4 (i.e. the second dataset on this page), and included it in the trend calculator (here and here). Temperature trends over the supposed "hiatus" period have increased. Estimates of temperature change compared to a pre-industrial baseline and of climate sensitivity are increased, however these depend on the longer term features of the records over which there is still substantial disagreement. The new land-ocean temperature record is compared to CMIP5 climate model simulations in Figure 3. While the CMIP5 simulations are expected to overpredict recent warming (because the emissions increases projected in 2005 were too high), the agreement between observations and projections is improved.
 Comparison of infilled global temperature observations calculated according to Cowtan and Way (2014) using either HadSST3 or HadSST4 against blended land-ocean temperatures from the CMIP5 RCP85 climate model simulations. (1951-1980 baseline)
Another approach to the problem of reconstructing global temperatures is being led by the National Oceanographic Centre, with the Hadley centre, UEA, Reading, Edinburgh and York as partners. The GloSAT project aims to create a new (diurnal) marine air temperature record stretching back to the 1780s along with land air temperatures for the same period. This will provide more information for the evaluation of sea surface temperature observations, as well as giving a new perspective on the onset of anthropogenic warming in the context of the large volcanic eruptions of the late 18th century.
References
- Carella, G., J. Kennedy, D. Berry, S. Hirahara, C. Merchant, S. Morak-Bozzo, and E. Kent, 2018: Estimating sea surface temperature measurement methods using characteristic differences in the diurnal cycle. Geophysical Research Letters, 45 (1), 363–371.
- Cowtan, K., and R. Way, 2014: Coverage bias in the HadCRUT4 temperature series and its impact on recent temperature trends. Quarterly Journal of the Royal Meteorological Society, 140 (683), 1935–1944.
- Cowtan, K., R. Rohde, and Z. Hausfather, 2017: Evaluating biases in sea surface temperature records using coastal weather stations. Quarterly Journal of the Royal Meteorological Society.
- Davis, L. L. B., D. W. J. Thompson, J. J. Kennedy, and E. C. Kent, 2018: The importance of unresolved biases in 20th century sea-surface temperature observations. Bulletin of the American Meteorological Society.
- Hausfather, Z., K. Cowtan, D. C. Clarke, P. Jacobs, M. Richardson, and R. Rohde, 2017: Assessing recent warming using instrumentally homogeneous sea surface temperature records. Science Advances, 3 (1), e1601 207.
- Huang, B., and Coauthors, 2017: Extended reconstructed sea surface temperature, version 5 (ersstv5): Upgrades, validations, and intercomparisons. Journal of Climate, 30 (20), 8179–8205.
- Kennedy, J. J., Rayner, N. A., Atkinson, C. P., & Killick, R. E., 2019: An ensemble data set of sea?surface temperature change from 1850: the Met Office Hadley Centre HadSST.4.0.0.0 data set. Journal of Geophysical Research: Atmospheres, 124.
- Kent, E. C., and Coauthors, 2017: A call for new approaches to quantifying biases in observations of sea-surface temperature. Bulletin of the American Meteorological Society, 98 (8), 1601–1616.
- Richardson, M., K. Cowtan, E. Hawkins, and M. Stolpe, 2016: Reconciled climate response estimates from climate models and the energy budget of earth. Nature Climate Change, 6 (10), 931–935.


 Arguments


Quite interesting.
Unfortunate that the data doesn't go back to the end of the little ice age (1870). If we had that, then we could make assessments about the ocean heat sink. As an object is being cooled (ocean), heat transfer is from its surface between water-air and water-earth. But, unlike a solid object, oceans can mix deep water with surface water faster than heat transfer allows through vertical currents.
Scenario. The ocean cools during the little ice age (1300 - 1870), creating a huge heat sink after 570 years. Afterwards, surface air heats up. If surface air to water has a U value of say 5 to 30, then it will have litte effect on ocean surface temperature relative to water core to water surface because of the large difference between surface and core temperatures (the core being about 17 C cooler than the surface) and the much higher U value of heat transfer between water and water that is 30+ or so times greater. This would allow air surface temperatures to rise while ocean surface temperatures still drop. If we saw a lag in ocean temps after the little ice age, that might confirm the above scenario.
Wffrantz @1,
Without mention of the GloSAT project in the OP, your scenario is probably entirely off-topic. That aside, as I understand your "scenario", it isn't well thought through.
You set out a three-part climate with the deep ocean, the surface ocean (perhaps the mixed layer) and the atmosphere. Your U values you borrow from building insulation but the principle of an average factor of heat transfer for the interfaces within a three-part climate is fine. And whether the relative size of these factors fits with your assumptions would need a bit of work.
Where the real problems begin to appear is in the idea that a cold period of climate lasting almost half a millenia (the period ascribed to Little Ice Age in IPCC AR5 is 1450-1850) will still be cooling the climate at its conclusion and the onset of a warming. The idea of 'inertia' caused by the thermal capacity of the oceans is widely understood. This would slow the warming process. But it would not result in a situation where "ocean surface temperatures still drop."
To achieve such a "drop", the deep oceans would have to be out-of-equilibrium with the rest of the climate before the warming begins, itself not inconceivable abet the 400-year period of cold. But the "drop" requires the deep ocean to have somehow cooled below equilibrium of the preceding colder climate. Such a situation requires more than 'inertia' to achieve. So without some additional mechanism the 'scenario' you present cannot occur.