


 Arguments


A Climate Bet Impossible to Lose
Posted on 1 February 2021 by Rob Honeycutt
Ten years ago I was just doing what I often do: following various links and conversations online where people are denying man-made climate change. I ended up on the German website NoTricksZone where I got caught up in a discussion related to climate projections. I made an off-handed comment saying something like, “Why is it those who reject AGW will never put their money where their mouth is and make a bet?” Lo and behold, the owner of NTZ, Pierre Gosslin, sent me an email suggesting that we do just that. And with that, the “Climate Bet for Charity” was born.
As of January 2021 the bet has concluded. I’m sure no one is in doubt about who won. For that matter, there was never any doubt about which side would win this bet from the start. Someone in New Zealand with the website kiwithinker.com started tracking the data with some interesting adjustments along the way. I also kept my own version of a tracking system that works differently but ends up with the same results. Here, I’m going to lay out the structure of the bet, how the data tracked, why the results are what they are, and where we are moving forward.
Terms
The terms of the bet were kept very simple, per a write up by Pierre on the NTZ website:
“If the decade of 2011 – 2020 is cooler or the same on average globally than the decade of 2001 – 2010, then warmist Rob Honeycutt and warmist betters will have to pay to charity the total amount that gets pledged by NTZ and readers betting on a cooler decade.
If the average global temperature for the decade 2011 – 2020 is warmer than the average of 2001 – 2010, then NTZ and coolist readers will have to pay everything they pledged to the charity.”
Of note, in Pierre's original article describing the bet, he states:
I wonder, will we finally see the true plumage of these folks who deny climate science?
Selection of data sets
We chose to use an average of two satellite data sets, UAH and RSS. Since we know Roy Spencer and John Christy (who both coincidentally contributed to the recent Trump administration climate denial flyers) run the UAH data this would, in their perception, keep the results honest and agreeable. Pierre agreed to maintain a list of people who pledged to the bet and was expected to notify each person of their obligation to pay up upon the conclusion of the bet.
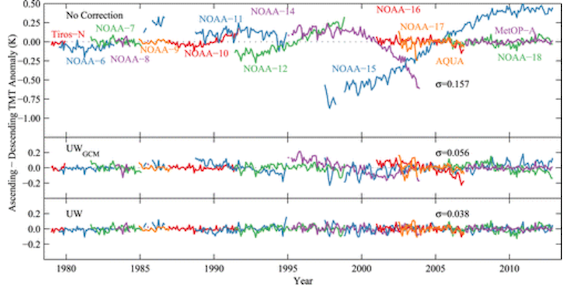
I’ve learned quite a lot more about global temperature data sets since the start of the bet. Originally, I was under the impression that the satellite data were more accurate than surface station data. Because we had these satellites constantly orbiting the earth taking equal measurements of the whole surface of the planet, I erroneously assumed that they would produce better data. At that time I was unaware of how much processing went into making the data useful, demonstrated by this graph of satellite raw data. [Update: Johnny Vector notes in the comments below that the data below is likely "level 1" data, at least a step above "raw data."]
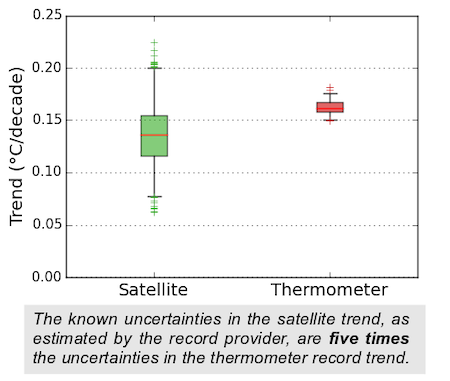
Later, I also learned just how much more uncertainty there is in the satellite data.
Nonetheless, these were the datasets we agreed to, so we were stuck with them for the coming decade.
Chances of a cooler decade
Pierre and the NTZ crowd’s premise, as best as I understand it, was that warming over the previous five decades was a direct result of ocean cycles rather than the increased radiative forcing from rising CO2 levels. So, the logic goes: After five full decades of this warming cycle, the climate must be ready to shift into a cooling trend. How could it be possible to have a SIXTH decade of ocean driven warming? Right? The NTZ was convinced by all the “logic” ricocheting around the denialsphere. (No need to link and promote any of that tripe here.)
From the side of real climate science the answer was easy. We have a high level of scientific understanding regarding the radiative forcing imposed by CO2. We know human activity is causing atmospheric concentrations to rise primarily through the burning of fossil fuels. It wasn’t a stretch to believe humans would continue to burn fossil fuels for another decade and enough forcing would be imposed on the climate system to cause another decade of warming.
It’s really not that complicated. More CO2 = increased forcing = a warmer planet.
But, could anything else alter the outcome? Large, low latitude volcanic events certainly have a dramatic cooling effect for a couple of years. Over the course of a decade, though? Even that probably wouldn’t be enough. Maybe global nuclear war might cool the planet enough to cause a decade of cooler temps … but then collecting on bets would be the last thing on anyone’s mind.
Long and short is, while we continue to burn fossil fuels, this is a bet that is nearly impossible to lose.
Tracking the data
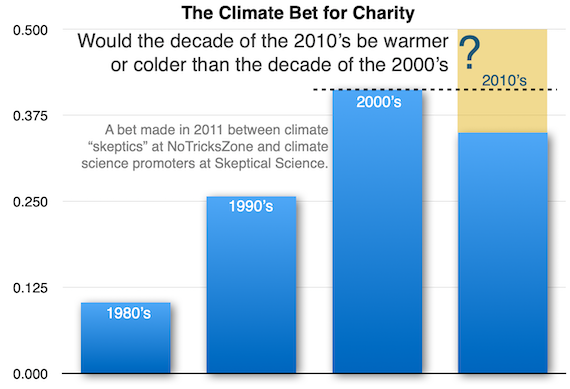
Kiwi Thinker devised a method to track the wager. The only problem I have with the methods is the data to the left side of the graph is relatively meaningless because you’re dividing a small amount of data over an entire decade of time. In the end, the result is the same, but early on it’s not informing you about anything of substance. It does make for a good horse race, and people like that.
More interesting along the way, the scale of the Y-axis had to be increased several times to accommodate for the rise in temperature of the new decade. I suppose in anticipation of a close race, originally the Y-axis scale only went to 0.25°C. In June 2017 the scale was expanded to 0.35°C. Two years later it was expanded again to 0.4°C. And finally in the last year it was expanded again to 0.45°C.
It should be acknowledged that over the course of the past decade both datasets have updated their methods and that created about a 0.05°C jump in the data. Interestingly, in the earlier versions of the data the UAH set was the warmer of the two. After their respective updates, the two flipped places and RSS was warmer and UAH made cooler.
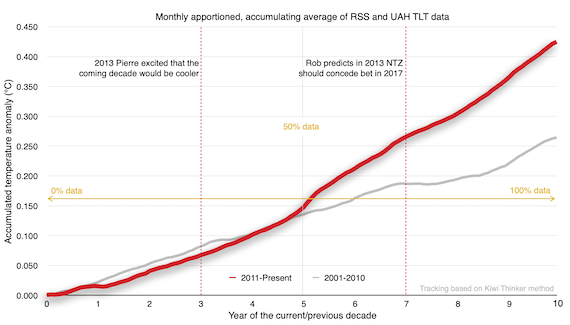
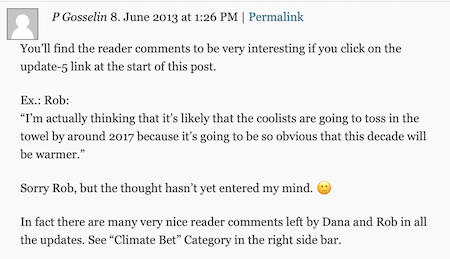
In this recreation of Kiwi Thinker's graph I mark one particular exchange that I had with Pierre in June of 2013.
By 2017 the current decade did, in fact, end up beating the previous decade. By that time it should have been obvious to the "coolists" they had lost the bet. Funny how simple predictions can be when you just listen to the science.
Rob's tracking method
I wanted to look at the data differently. My approach was to create a running decadal average in order to see who would win the bet at any point in time. My thinking was, I don’t want these folks to think the result was just a matter of timing, as in, “Meh, if we’d made the bet X years earlier (or later) then the coolists would have won.”
There’s enough data in the satellite sets to show three full decades of a running averages. That means we can look at what would have happened if the bet had been made at any point during the previous decade, as well as seeing who would have won at any point through the course of the bet’s decade.
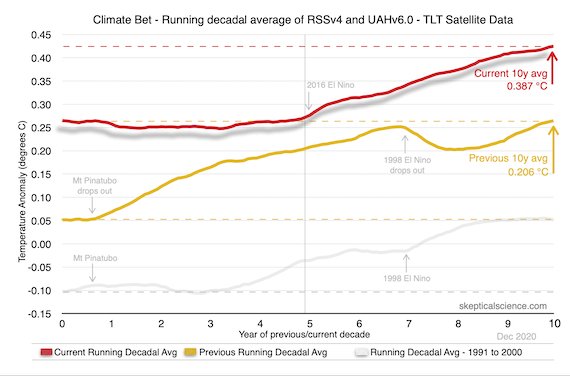
What is abundantly clear is, there is no point in the entire satellite data where the previous decade was cooler. Absolutely nowhere.
The other benefit of my method is, as noted, you can clearly see how different significant events affect the decadal trend. You can see how Mt. Pinatubo caused the decadal trend to go flat for about 3 years. Directly above that, 10 years later, you can see where the data starts to rise again as the Pinatubo years drop out of the average. You can similarly see the reverse effect from the 1998 super El Niño.
Seeing how the Mt. Pinatubo cooling affects the trend, it’s pretty safe to assume it would require at least 2 or 3 very well timed Mt. Pinatubo events to produce a cooler decade. It’s not much of a stretch to believe that’s highly unlikely to occur.
This is not hard to figure out
We have research going back to the 19th century explaining the science. We know our atmosphere has a greenhouse effect that keeps our planet warmer than it otherwise would be. We know most atmospheric gases are transparent to infrared radiation emitted from the surface, and we know that a variety of trace gases are responsible for the greenhouse effect. We can measure the effect. We can reproduce the effect with models. We know why non-condensing greenhouse gases like CO2 have such an important role in controlling our planet’s surface temperature.
We’ve known most of this stuff for a century and a half, and our understanding has only grown deeper over the past 50 years. As we learn more our confidence in what we know only continues to grow stronger.
There is "No Trick" here. Ocean cycles can not produce a hockey stick that oddly turns upward right at the start of the industrial revolution. There is no magic reservoir of heat in the oceans that coincidentally began emerging from the deep. The notion is gobsmackingly absurd.

Where we go from here
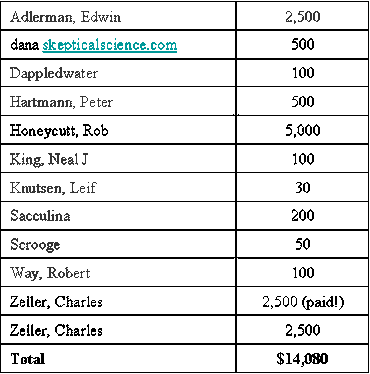
I contacted Pierre Gosslin in recent weeks about the bet, but apparently his side gave up and some paid out months ago. The terms of the bet were supposed to be that we’d agree on what charity to pay, but that’s inconsequential. I don’t know for sure that anyone other than Pierre paid. He did create the following list of names for the bet. I've asked Pierre if he's made any attempt to contact these people and let them know they need to pay up. As of this writing, I haven't received an answer to that question, nor have I been updated on the status of Pierre's tar and feathering supplies.
Coolist bets:
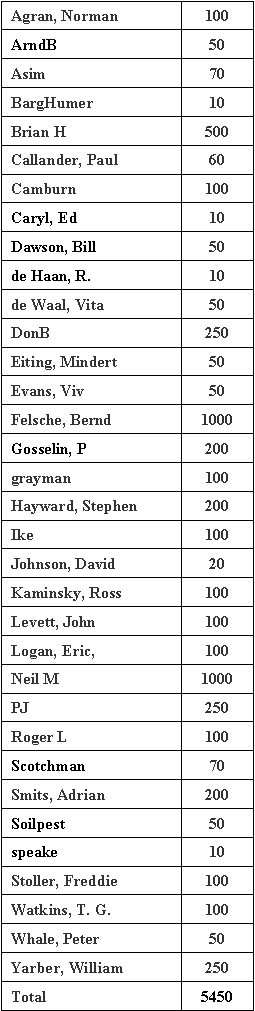
Warmist bets:
I believe most of these folks are going to be too embarrassed to come forward to admit they were wrong. Pierre readily admits they lost, but that’s the extent of it. He also said ocean cycles just ended up favoring our side. Both Dana Nuccitelli and I have offered to re-up the exact same bet again. His side said okay and offered $100. Dana's suggestion of a larger wager was rebuked. That’s how much confidence these guys have in their position – a hundred bucks.
Ocean cycles? Really? ...Again?
What are the odds that their “ocean cycles” theory is going to produce a SEVENTH decade of warming? Impossible! The next decade absolutely has to cool. They can’t lose, right?
Of course, from our side it’s easy. We can bet as much as we want because, as long as humanity continues to dump CO2 into the atmosphere this planet of ours is going to keep getting warmer. Back in 2011 when we started this, Pierre made the comment that I seemed like an unusually generous person to bet $5000. I wish I could claim that was my primary motivation. I just knew, with near certainty, that I would never have to pay out that money. The amount was merely a strategic attempt to get them to pay out the most money possible.
The good news
Rather than end on that pessimistic note I think it’s important to point out, things are moving in a positive direction on many fronts. The United States is back in the Paris Agreement, run by an administration that views the climate crisis as a top priority. Renewables are continuing to get cheaper and cheaper, to the point they’re falling below extraction costs for fossil fuels sources. Most newly installed electricity generation is now renewable. All the major car companies are shifting production to electric vehicles. That's just to name a few.
A day is coming when I would lose this same bet thanks to international climate mitigation measures. It’s not likely during my lifetime, but probably in my children’s lifetimes. They’re smart kids, though. I’m sure they’ll listen to the science and know when the bet is no longer impossible to lose.


You cheated. Ocean cycles were rebooted in the middle and then commandos of invisible leprechauns were lighting fires everywhere to heat up things. I'm pretty sure I saw it on FaceBook. It's all a hoax.
Ah, luck of the Irish, I say. :-)
Leprechauns? No way. It's pirates.
https://pastafarians.org.au/pastafarianism/pirates-and-global-warming/
...but a nice piece on an interesting bet, Rob. As you said, it was a pretty sure bet. I think the "coolists" were out on a Snipe Hunt looking for support for their viewpoint.
I think your cheating was the result of using physics instead of fizzicks to predict what would happen.
It's the kind of bet I wish we would lose, but that will take a bit of time.
Interesting ...
I can 't figure out whether climate change deniers genuinely believe that the earth is not warming. But now I am starting to believe that some of them are sincere, even though they are wrong. I think it is called "emotional investment". As they have invested years, even decades of their life defending the denier position, admitting their mistake now would be admitting they have wasted years.
Humans are a social species. Of course, believing falsehoods is not a clever survival strategy. But being loyal to the group you belong to – sometimes by agreeing with what everyone in your group claims to be true – IS a valuable survival strategy. You have a better chance of survival in a group than on your own. But that also means that such people cannot be persuaded by logical arguments or by facts.
Speaking as a satellite systems engineer, please don't refer to that second graph as "raw data". That is already at least a "Level 1" product. Level 0 is raw data, right from the sensors. I build astrophysics instruments, so I don't know for sure that the graphed data is L1; I strongly suspect it's Level 2, which has had even more processing done to it.
I mention this not for the sake of pedantry, but because it's worth pointing out always that any satellite numbers in Kelvins have already undergone a large amount of processing. The only numbers that come down in Kelvins are the internal temperatures of the satellite itself. (Okay, even those probably are downlinked in A/D counts, but the conversion to Kelvin is usually a simple linear calibration.)
Anyway, I think it's worth avoiding the term "raw data" when referring to anything that's already been heavily processed based on a model, especially when there are two models whose outputs are outside each others' one-sigma error bars.
Johnny... That's a very interesting point, and one that I will absolutely remember in the future.
Johnny's point about "raw data" raises an important issue. What is "raw" data? When does data processing start?
For the satellite data, what is being measured is actually microwave emissions form the atmosphere, and it take a lot of modellig to derive "temperature" from that data. Rob's post has some good links in the "Selection of data sets" paragraphs that explain much more.
Pretty much any environmental variable has some sort of processing that needs to be carried out. Even something as simple as the regular temperature measurements aren't that "raw":
Both of these still just give you the temperature of the thermometer, not the air, so the temperature measurement system has to try to make sure the thermometer is at air temperature, usually using a Steveson Screen or some other form of ventilated radiation screen.
That gives you local air temperature, and then you need to make sure that your local temperature is telling you the information you need at a regional scale. There is a good series of posts here on how temperature measurements taken for the purpose of weather observations are used to estimate global temperature changes:
https://skepticalscience.com/OfAveragesAndAnomalies_pt_1A.html
Everything in science has "models" involved at some point. Some are simple and extremely well-defined. Others are complex and involve considerably more uncertainty.
bvangerven
Its possible that many of the remaining climate denailist scientists have narcissistic personality disorder. This affects about 1% of the general population. People with this disorder are psychologically incapable of admitting they are wrong, or find it extremely painful to do so, and so only do so rarely. Plenty of people have something close to this disorder. The point is there will always be a few denialists just as there is still a flat earth society.
I often forget myself, but the first question a statistician is supposed to ask is "How was these data collected?".
On the wildfires, Jewish Space Lasers, anyone?
https://www.forbes.com/sites/brucelee/2021/01/30/did-rep-marjorie-taylor-greene-blame-a-space-laser-for-wildfires-heres-the-response/?sh=78c42e84e44a
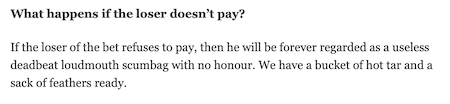
Good news! This means I can bulldoze my way into Gosselin (and his merry maniacs) Notrickszone armed with this wonderful phrase: "If the loser of the bet refuses to pay, then he will be forever regarded as a useless deadbeat loudmouth scumbag with no honour."
If there is another round please let me know. I do would suggest to have a neutral party collect the money in advance. I do not expect these people to be less Trumpian in 10 years, if anything moral values in these groups are on a steep decline.
RealClimate has a new post up about a number of climate bets of this sort. They have a graph very similar to Rob's first graph above, and link back to this post as one of the bets.
http://www.realclimate.org/index.php/archives/2021/02/dont-climate-bet-against-the-house/
Bob... I actually made that graph for Stephen Lewandowski for use on twitter. I guess Gavin picked it up from there.