Climate Science Glossary

Term Lookup

Enter a term in the search box to find its definition.

Settings

Use the controls in the far right panel to increase or decrease the number of terms automatically displayed (or to completely turn that feature off).

Term Lookup

Settings


All IPCC definitions taken from Climate Change 2007: The Physical Science Basis. Working Group I Contribution to the Fourth Assessment Report of the Intergovernmental Panel on Climate Change, Annex I, Glossary, pp. 941-954. Cambridge University Press.

Home Arguments Software Resources Comments The Consensus Project Translations About Support

Bluesky Facebook LinkedIn Mastodon MeWe

Twitter YouTube RSS Posts RSS Comments Email Subscribe


Climate's changed before
It's the sun
It's not bad
There is no consensus
It's cooling
Models are unreliable
Temp record is unreliable
Animals and plants can adapt
It hasn't warmed since 1998
Antarctica is gaining ice
View All Arguments...


Username
Password
New? Register here
Forgot your password?

Latest Posts

Archives

A Flanner in the Works for Snow and Ice

Posted on 23 January 2011 by MarkR

A new paper by Flanner et al in Nature Geosciences tries to estimate the so called ‘cryosphere albedo feedback’ since 1979. As Earth warms, ice and snow melt and the loss of their shiny, reflective surfaces means more sunlight is absorbed and global warming receives a boost.

The strength of a feedback can be calculated from how much extra heating it adds as temperatures increase; the equations are here. Climate models expect that changes in Northern Hemisphere snow and ice since 1979 should have been a positive feedback of about 0.25 W m-2 K-1 - i.e. for each degree of global warming, the loss of snow and ice means that another 0.25 W of sunlight is absorbed per square metre of the Northern Hemisphere. Globally, and in the long run it’s expected to be 0.2 because there’s less snow in the south and you eventually run out of summer snow to melt.

Flanner et al use satellites to measure the change in shortwave (i.e. sunlight) reflectivity across the Northern Hemisphere from 1979 to 2008. 

They find the total amount of cooling that ice & snow provide to the Northern Hemisphere month by month split between sea ice and snow:
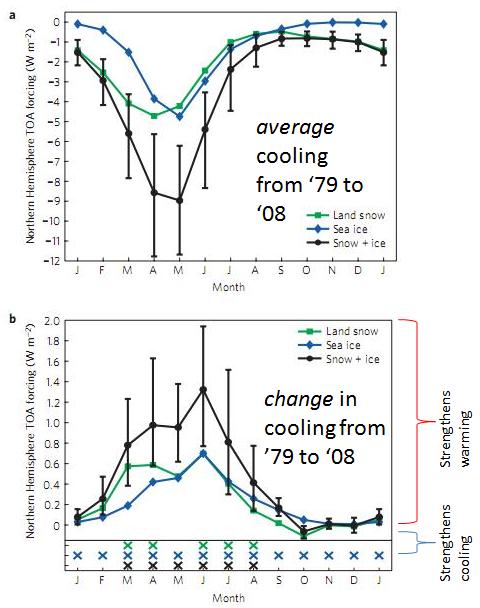


Figure 1a) is the total cooling effect by month of snow, ice and snow+ice. b) is the change in cooling effect for each month since 1979 split into snow, ice and snow+ice. Positive means melting has led to more warming, negative means it’s added to cooling.

Even though there is much more ice in the winter, the days are shorter and the sunlight weaker so the total cooling effect is smaller. May to June ice & snow is much more important even though there is less of it. Next they made annual averages and mapped these over the hemisphere:
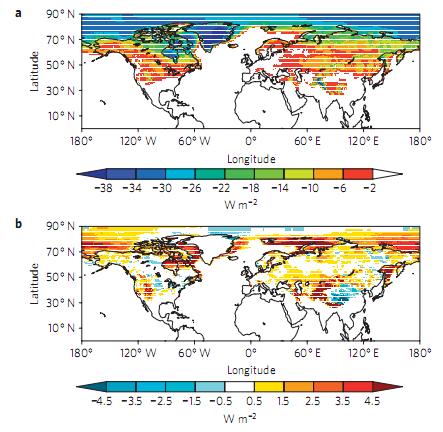
Figure 2a) total cooling effect and b) change in cooling effect since 1979 in snow and ice of the Northern Hemisphere.

The authors find that the total effect is 0.33-1.07 W m-2 K-1 with a best estimate of 0.62 W m-2 K-1, significantly higher than climate models’ 0.25 W m-2 K-1. Models have underestimated the darkening of the Northern Hemisphere and therefore how much global warming we’re ultimately in for.

Perhaps the first snow and ice melted more quickly than expected and eventually we’ll run out of the easy to melt bits, or maybe the decline in Arctic sea ice will halt for ~30 years to bring it back in line with models. However, if the current pattern holds then this would boost the best estimate of global warming temperature rises by about 20% - here’s hoping it’s just a blip!

0 0

Printable Version  |  Link to this page

Comments

Prev  1  2  3  

Comments 101 to 140 out of 140:

  1. Gentlemen and Adelady After finding an error (by a factor of three) in the first line of Spherica's latest effort I did not follow the rest through. Tom obviously did follow it and found an error the other way which offset the first. How would anyone reading this be expected to take Sphaerica seriously after a string of errors which included an angle of incidence at the north pole of 66 degrees when in fact it is 23 degrees at the summer peak. Even Alec Cowan is now chiming in with an apologia for all the errors I have identified in the arguments of Sphaerica, Tom and even Adelady. Anyone care to find an error in any of my numbers?? If not then please declare my arguments correct and the others wrong.
    0 0
  2. 101, Ken, First, you didn't find a mistake in my calculations. You thought you found a mistake, and you were in error (see post 96 by Tom and post 98 by me, both correcting your misunderstanding of what an "annual average" means, and why it would be particularly inappropriate to use in our situation). Second, Tom didn't find a mistake in my calculations, he pointed out your mistake, and added that if I had used your suggested average annual value then I would also need to remove the compensation that I'd already built into my calculation (i.e. dividing by four, to account for only one season of melt, which is a more correct method of working with the problem). Tom pointed out your error, and how I would have needed to adjust my calculation had I made the same mistake you did. As far as your angle of incidence claims, anyone here can go back and read the thread. I already corrected you several times on that. You are focused on the exact spot of the north pole, when the area of interest is that entire area from about 50˚N and up. So far, the major errors are yours, first in thinking you've found errors in other people's work, and then compounding that by failing to understand where you've gone wrong (even when we clearly point it out to you), and then further compounding that by misrepresenting what we have written.
    0 0
  3. 101, Ken,
    Even Alec Cowan is now chiming in with an apologia for all the errors I have identified in the arguments of Sphaerica, Tom and even Adelady.
    Wow. Did you really misread Alec's post that badly? Really? Or do you just think that everyone else's reading comprehension skills are that poor? I feel like I just dropped out of a twister into Oz.
    0 0
  4. Out of curiosity, how do we know the ice loss is due to an increase in temperature in the Artic?
    0 0
    Response:

    [DB] See for yourself:

    Arctic

    [Source]

  5. I need data from 1979 and 2010. How much has the Artic warmed?
    0 0
  6. RW1 #105: "data from 1979 and 2010." Why only two years? -- from here
    0 0
  7. I'm pretty sure that if we just choose to ignore the actual evidence, the problem will go away!
    0 0
  8. muoncounter (RE: 106), "Why only two years?" I would like to know how much the Arctic has warmed from 1979 to 2010. From that, see if it was enough to melt the ice.
    0 0
    Moderator Response: [DB] Did you read the article that is the subject of this post?
  9. Tom Curtis Where did you get these numbers? 1979-1983: -7.40E+020 Joules 1984-1988: -4.18E+020 Joules 1989-1993: 8.24E+020 Joules 1994-1998: 1.41E+021 Joules 1999-2003: 2.06E+021 Joules 2004-2008: 6.97E+021 Joules
    0 0
  10. RW1 #108: "to see if it was enough to melt the ice." Why not start on the observation side, rather than with an 'if'? Observed: Arctic ice melting (see any of the many threads here at SkS, along with copious literature). Observed: Warming (graph posted above); if that's not good enough, Comiso 2003 is a good read. Average temperature trends are generally positive at 0.33 +/-0.16C /decade over sea ice, 0.50 +/-0.22C / decade over Eurasia, and 1.06 +/-0.22C / decade over North America. The trend is slightly negative and insignificant at -0.09 +/- 0.25C/decade in Greenland with the negatives mainly at high elevations. Conclusion: There must be enough of a radiative forcing imbalance in the Arctic so that both ice extent is decreasing (and melt season getting longer) and temperatures are warming at rates much greater than the global average. Perhaps you can calculate whether all of this can occur with 0 net forcing. That would evaluate 'natural cycles.' But I'm reminded of a talk by Ken Wilson, a Nobel laureate in Physics, several years ago: He stated the memorable line: 'I don't mind reinventing the wheel, I just don't like reinventing the flat tire.'
    0 0
  11. Ken Lambert @109, from spreadsheet described in my 73, as modified to include actual arctic sea ice extents as described in my 88.
    0 0
  12. muoncounter (RE: 110), "Why not start on the observation side, rather than an with an 'if'?" Cause and effect. The graph seems to show about 0.75 C of warming from 1980 to 2003 from 60-75˚, but what about 66.6˚ to the North pole from 1979 to 2010?
    0 0
  13. RW1@113: [Source] The zonal means from 59 degrees north are: 59.00000000 0.9049376845 61.00000000 0.9578167200 63.00000000 1.027678609 65.00000000 1.094777465 67.00000000 1.213630080 69.00000000 1.325709581 71.00000000 1.454651952 73.00000000 1.595859289 75.00000000 1.811631322 77.00000000 2.137880087 79.00000000 2.348255634 81.00000000 2.444648981 83.00000000 2.764386654 85.00000000 2.764386654 87.00000000 2.764386654 89.00000000 2.764386654 Your can work out the actual mean for from 65 degrees (or 67 degrees) north by weighting each latitude band for area; or you can work on the obvious fact that mean increase in temperature within the arctic circle is obviously greater than 1 degree over this period.
    0 0
    Moderator Response: [DB] Fixed images.
  14. Tom Curtis (RE: 113), 1980 compared to 2010: 67.00000000 1.433453083 69.00000000 1.605143428 71.00000000 1.782773018 73.00000000 1.956291556 75.00000000 2.163378954 77.00000000 2.532876968 79.00000000 2.804517508 81.00000000 2.930059433 83.00000000 3.353630066 85.00000000 3.353630066 87.00000000 3.353630066 89.00000000 3.353630066 or 1980-1990 compared to 2000-2010: 67.00000000 1.022729039 69.00000000 1.085630417 71.00000000 1.143316746 73.00000000 1.204136610 75.00000000 1.295737386 77.00000000 1.443844914 79.00000000 1.538919687 81.00000000 1.585246086 83.00000000 1.786555529 85.00000000 1.786555529 87.00000000 1.786555529 89.00000000 1.786555529 Assuming these figures are accurate, how do we get the surface area weighted averages?
    0 0
  15. 114, RW1,
    ...how do we get the surface area weighted averages?
    I believe the equation for the surface area between two latitudes is
    2πr2 [ (1 - sin(L1) - (1 - sin(L2) ]
    where
    r = radius of the Earth L1 = the lower latitude (closer to the equator) L2 = the higher latitude (further from the equator)
    0 0
  16. More usefully, the average annual temperature anomaly between the 80's and the 2000's for the area from 67 degrees north to the pole is 1.2832875654 degrees C. The formula the (sum of temperature times area for each latitude band) divided by the area of the entire spherical cap, with areas for latitude bands and spherical cap determined by the formula given by Sphaerica @115, using a radius for the Earth of 6371 km. As the Earth is an oblate spheroid, that will have introduced some error, but inconsequential for our purposes.
    0 0
    Moderator Response: [DB] Fixed equation result.
  17. Tom Curtis #109 Show me how you got to 2.2E21 Joules in your original calculation at #54?
    0 0
  18. KL @117, I again refer you to my posts 73 and 88. I showed how I obtained the figures in 54 in 54, but I see no point in reviewing figures for which I have obtained a more accurate result.
    0 0
  19. Sphaerica #102 This is bizarre. I must be in a parallel universe. You are claiming the exact opposite of what actually happened: Viz: "As far as yot opposite of your angle of incidence claims, anyone here can go back and read the thread. I already corrected you several times on that. You are focused on the exact spot of the north pole, when the area of interest is that entire area from about 50˚N and up." The area of interest is the Arctic. 66 degN and up. Tom's area of interest was the edge of the Arctic sea ice at 75 degN and up. I had to direct Tom to a calculator so he could correct his erroneous angle of incidence claims as well. The Earth still turns once every 24 hours - even up in the 'tropical' summer Arctic. At 75 degrees N the summer angle of incidence will be 23 +/-15 degrees on July 23. At 66 deg N it will be 23 +/-23 degrees on July 23. (The Arctic circle where it is 0 degrees at midnight on one day of the yesr) At 50 deg N it will be 23 +/- 40 degrees on July 23. When the angle goes negative Sphaerica - it is dark - nighttime. Lots of IR goes out to space at night. So it is simply wrong to claim that I am only focussing on the exact spot of the North Pole. What you and Tom are missing all through this thread is that angles of incidence above 40 degrees (where you claim albedo drop off becomes significant) only occur at midday below a latitude of 73 deg N (ie; 23 +/-17) on one day of the year.
    0 0
  20. Tom Curtis #118 OK, take me through the calculation showing all the terms you used to get the 1.51 x 10^21 Joules at #73.
    0 0
  21. Ken Lambert @119 says:
    "What you and Tom are missing all through this thread is that angles of incidence above 40 degrees (where you claim albedo drop off becomes significant) only occur at midday below a latitude of 73 deg N (ie; 23 +/-17) on one day of the year.
    What you have been obtusely ignoring, Ken, is that the albedo effect on which you rely is far smaller than you seem to think. Specifically, the average albedo on smooth water over the full day of 21st May at 75 degrees North is only 0.328 compared to the 0.9 albedo of snow covered ice. That average is conservative in that it is calculated using the lowest angle above the horizon for each half hour period of the day. Further, on wavy water, as for example, the sea, the albedo is significantly less than that. This is because light striking a facing slope of the wave will strike at a much smaller effective angle of incidence (ie, closer to perpendicular to the water face) and hence have a much reduced reflectivity. Light striking the opposite slope will be reflected at a shallow angle, and have a high probability of striking the facing slope of the next wave, and hence being absorbed. Treating the ocean as a non-wavy surface probably overstates the albedo by 40%. What is more, the period of highest albedo is also the period of lowest incidence of light. That is a very substantial effect. If we take the average of the albedo using my conservative estimate only over the 15 hours in which the sun is highest in the sky, the mean albedo falls to 0.17, or 0.73 less than the case of snow covered ice. This is particularly significant in my model in that it is so conservative as to estimate no sunlight in the other nine hours of the day, even with the sun still being in the sky. What has been most striking about your behaviour in this discussion is that you regularly insist a particular effect is substantial while making no attempt to actually calculate it. And when it is calculated, and your point is shown thereby to be without substance, you quibble about minor points while accepting gross biases in the calculation in your favour without any qualm. For instance, you quibble about Sphaerica (and my) admitted error about the angle of incidence which results in a change in average albedo of just 0.3, and hence overestimates incoming energy flux by 50% at most. In the meantime you happily accept all the biases I introduced into my calculations in your favour without qualm, even though they probably underestimate the incoming energy flux by a factor of 3.85 or more. And in the meantime you pester after a statement of how my calculations where achieved (which has already been given in more than sufficient detail) because you cannot refute and find your position refuted by them.
    0 0
  22. I will not engage with anyone who demonstrates a blatant and total lack of integrity. I would hope that casual readers will recognize these traits for what they are, when demonstrated, regardless of that person's position, and so take anything stated by that person either now, previously, or subsequently with an appropriately healthy degree of skepticism. Trust should not be blindly given to those who simply state what you wish to believe. If anything, those are the people for whom the bar should be set highest, because they have you at a disadvantage, and so can take advantage of you most easily and completely.
    0 0
    Moderator Response: [mc] While you are certainly free to question another's statement and advise others to question them, questioning personal integrity is not necessary.
  23. Tom Curtis #121 t looks like I will have to sort this out for you Tom, sonce you won't show your exact calculation: This is what you say you did at #73: "4) From the half hourly values obtained in (3), I calculated the additional energy absorbed by ocean surface exposed by melting sea ice as the difference between the albedo (0.9) of the sea ice and the albedo of the ocean given the angle of incidence, multiplied by the effective surface radiation (as calculated in 3). Taking the mean of that value, the average additional power absorbed by the ocean is 97 W/m^2. 5) Using that value, I calculate the total additional energy absorbed as 7.57 x 10^8 Joules per meter squared over a notional 90 day summer, or 1.51 x 10^21 Joules over the whole 2 million square km of additional ice cap melted over the period 1979-2011." Here are your asumptions as I understand them: 1)Your 97W/sq.m is based only on average incoming energy flux due to the difference in albedo from Sea Ice compared with Seawater for an range of incidence angles over the Arctic Summer above 75 degrees N.
    0 0
  24. Mod, I purposely did not direct my comment at anyone in particular. I made a broad, general statement. You are free to delete the comment, if you see fit. I did hesitate for some time before hitting submit, weighing the alternative of simply disappearing from the thread in silence. But I felt that it needed to be explicitly said.
    0 0
  25. Tom, Ken; why don't you set up a google docs spreadsheet (maybe under an anonymous account or two) and plug your numbers / equations in? you could both edit it (it has track changes) and see if you can converge to an answer?
    0 0
  26. Ken Lambert @123:
    "1)Your 97W/sq.m is based only on average incoming energy flux due to the difference in albedo from Sea Ice compared with Seawater for an range of incidence angles over the Arctic Summer above 75 degrees N."
    The highlighted phrase is ambiguous. Do you intend to indicate that I only calculated the difference in incoming energy between the early 1980s and the last few years that resulted from the reduced summer sea ice? Well, if so, yes. That is in fact what I have stated all along that I am calculating. Alternatively do you intend to say that I only took albedo into account in calculating this value? But that is a ridiculous statement given that I had just spent several paragraphs explaining the total number of factors I had taken into account including, path length through the atmosphere and consequent atmospheric absorption, cloud albedo, the relative footprint of solar radiation given the high latitude, and even the orbital eccentricity; with formulas given for how I handled each factor. Further, it is not just any range of angles of incidence. It is a range of angles that is traversed during an arctic day which underestimates the altitude of the sun for each time interval. Finally, you do not call the results of a calculation an assumption.
    0 0
  27. les @125, having investigated that possibility I have discovered that Google docs won't recognize Open Office files for import; and that a cut and past transfers values only, not formulas, which is pretty useless. It is IMO not worth my time to redo my spreadsheet again from scratch for the benefit of someone who is being at best, obtuse.
    0 0
  28. Sorry- accidental 'Enter' posting at #123 Tom Curtis: Here are your assumptions as I understand them: 1) Your 97W/sq.m is based only on average incoming energy flux due to the difference in albedo from Sea Ice compared with Seawater for an range of incidence angles over the Arctic Summer above 75 degrees N latitude. 2) The Area of additional Sea Ice melt is assumed to be 2 million sq.km melted over the period 1979 - 2011 (32 years) 3) The whole 2 million sq.km is assumed to be exposed to the 97W/sq.m for the length of the Arctic summer (90 Days) 4) No account is taken of any change of outgoing energy flux due to surface temperature increases in the 90 day period. 5) No acount is taken of transfer of heat to the Arctic by other means (ocean currents eg.) Based on these assumptions you then calculate the total energy absorbed over a 90 day Arctic summer as follows: 97W/sq.m x 90 days x 24 hr/day x 3600 seconds/hour = 7.54E8 Joules/sq.m. You then multiply 7.54E8 Joules/sq.m x 2 million sq.km (2E12 sq.m) = 1.51E21 Joules. (15.1E20 Joules). So far, this matches your number. Now, the same problem arises with the additional 2 million sq.km melted relative to 1979. It did not all happen in one summer season. It is not in linear increments for 32 years, but not all in one summer either. But even if we heroically assume an extra 2 million sq.km was melted in ONE 90 day summer, then the 2 million sq.km of extra Seawater is only fully exposed at the END of the 90 day period. The melt curve is roughly sinusoidal with time. If you break up the summer into 3 x 1 month periods, and assume a linear approx for the decline in ice area, then after 1 month you will expose 1/3rd of the 2 million, after 2 months 2/3rds of the 2 million and, after 3 months the whole 2 million. Whichever way you break it up, the average area exposed to the 97W/sq.m is HALF the 2 million sq.km. for the 90 day period. Hence your 15.1E20 Joules should be half that: about 7.6E20 Joules per 90 day summer - making the heroic assumption that the whole 2 million sq.km is melted and Seawater exposed in one summer. Dr Trenberth says in his "Tracking the Earth's Energy" Aug09 paper: Quote "Sea ice is important where it forms. Record losses of Arctic sea ice of about 10^6 km2 occurred in summer of 2007 relative to the previous lowest year [25], although the thickness and volume of the ice is quite uncertain. To melt 10^6 km2 of ice 1 m thick and raise the temperature of the water by 10 degC requires 3.4 x 10^20 J, or globally 0.02 W/m2. For 2004–2008 this is about 0.9 x 10^20 J/yr." Endquote So if we assume that the worst year (2007) melted a 1 million sq.km area then we HALVE the 2 million area and the calculated figure of 7.6E20 Joules to a number of 3.8E20 Joules in one 90 day summer. This is quite close to Dr Trenberth's number of 3.4E20 Joules needed to quote "melt 10^6 km2 of ice 1 m thick and raise the temperature of the water by 10 degC requires 3.4 x 10^20 J" With a global imbalance of 145E20 Joules/yr, the 3.8/145 equals 2.6% of the planet's warming from the melting of 1 million sq.km of Arctic sea ice in one summer (year). This similar to the 2.8% I calculated previously.
    0 0
  29. Ken Lambert @128, the sea ice does not start melting at the beginning of summer, and nor does it magically return to the winter state at the end of summer. Further, there is less winter sea ice in the arctic now than 30 years ago. Therefore your adjusted sea ice area calculation is nonsense. For what it is worth, on average over winter, there was 0.63 million square km less sea ice over the period 2004-2008 than the period 1979-1983. There was, on average 1.08 million square kilometers less in the spring. There was 2.04 million square kilometers less on average in the summer. There was on average 1.69 million square kilometers less in the Autumn. Even if these where the minimum seasonal extents, therefore, that would only represent a 25% reduction in the calculated energy, not the 50% you calculate. However, these are not the minimum values, but the average value taken over the season. Early in the summer there is less than 2 million square kilometers exposed, but late in the summer there is significantly more than an extra 2 million square kilometers exposed. The average over the whole season is an extra two million square kilometers. So, there is no need to adjust the figure to find the average, for the figure is already the average. These figures are based on the seasonal sea ice extent data linked @88. I extrapolated the autumn 2008 figures to determine the average by adding the average difference between summer and autumn ice to the summer ice of 2008. Prior to using those figures, I had based my calculations on, first, the area of the difference in latitude band taking the month of the season with the least change of latitude (based on the chart in 58) and on sea ice area graphs compared over a season choosing the minimum difference for the season. Neither method was entirely accurate but where conservative. I find it gratifying that the one figure I have not had to change over the whole exercise, though I have used three entirely different and conservative methods to determine it, is the difference in sea ice.
    0 0
  30. The warming anomaly in the high Arctic is quite apparent in the DMI data: [Source] And in the overall temperature anomaly over time: [Source] Yields a declining winter maximum Arctic Sea Ice extent over time: [Source] Resulting in a declining Arctic Sea Ice cap: [Source] Melting ice cares not for sophistry. Or is it that Arctic Sea Ice declines from it's current winter maximum of about 13.5 million square km area to it's melt season low of about 4.2 million square km out of sheer habit...: [Source] As much as I'd like to vote for sheer habit, I'm going with the physics-based insolation & the damage it inflicts on the ice...and the resulting changes in albedo over time. The Yooper
    0 0
  31. Ken Lambert @128 and further to my 129, when going over the figures I noticed that the historical sea ice extent data defines summer as July, August and September, while I have been using solar altitude data for May, June and July. This means that I am over estimating sea ice area for the relevant period (although the large underestimates I use on other factors still mean I am underestimating additional incoming energy flux). Never-the-less, the name of this game is give Ken every bias in the data he could ask for, and I have a personal preference for greater accuracy. Therefore I corrected by calculated values as follows: 1) For each of May, June and July, I determined the 1979 and 2010 values of sea ice area from the following chart: The chart tracks the trends in median monthly Arctic sea ice area. I used the trend chart to avoid distortions from start point or end point effects. 2) I then determined the mean of the three monthly values, and the May and July values. For both of these, I determined the difference between 1979 and 2010 values, and took the lowest value (May, July as it turns out). 3) I then used this value to calculate the additional energy absorbed by the ocean over the summer months in the Arctic in 2010 relative to 1979 on the trend due to the shrinking of Arctic sea ice. As previously noted, this is the gross energy absorbed over the summer, and does not factor in any increased energy losses over that period. The final value thus determined is 1.21*10^21 Joules. That is 13% less than my previous best conservative estimate @84. It is no where near the 75% reduction Ken thinks he has found in the data. In other words, even allowing every possible bias in his favour, and taking into account all the factors he considers relevant, there is still more than three times additional energy coming in than he thinks there should be. More importantly for this thread, Flanner estimates that the increased net energy absorption (additional energy absorbed - additional energy lost) due to arctic sea ice melt is around 5*10^20 Joules, or approximately 42% of the conservative estimate of additional incoming energy flux. As Ken would say, this is quite close to Trenberth's figure of 3.4*10^20 Joules needed to explain melting and warming of Arctic ice. But though he might say that, 1.6*10^20 Joules is a lot of additional heat left over after that process. Regardless of that, the conservative calculation of additional incoming energy shows (unsurprisingly) that low arctic insolation due to low solar altitude in the Arctic does not provide a principled basis to reject Flanner's results.
    0 0
  32. Tom Curtis #131 I hung in there Tom, because I could not let you get away with the litany of error and denegration of both my calculations and 'principles'. Your final paragraph tells the story of this bizarre exchange. Quote: "More importantly for this thread, Flanner estimates that the increased net energy absorption (additional energy absorbed - additional energy lost) due to arctic sea ice melt is around 5*10^20 Joules, or approximately 42% of the conservative estimate of additional incoming energy flux. As Ken would say, this is quite close to Trenberth's figure of 3.4*10^20 Joules needed to explain melting and warming of Arctic ice." So Flanner's actual number for NET energy absorbed is around 5E20 Joules (presumably per season or per year). Is not what global warming is all about - the NET increase in heat gained by the Earth?? So where did you get the number "2004-2008: 6.97E+021 Joules" which is 69.7E20 Joules over 4 years or 17.4E20 Joules per year?
    0 0
  33. Daniel Bailey #130 I assume by your entry to the thread Daniel that you are informing Tom Curtis' rather than me. " Melting ice cares not for sophistry. Or is it that Arctic Sea Ice declines from it's current winter maximum of about 13.5 million square mile area to it's melt season low of about 4.2 million square miles out of sheer habit...:" I assume you mean sq.km not sq.miles Daniel. And what is 'sophistry' about my sound calculation which points out the trail of basic errors in Tom's elongated journey.
    0 0
    Moderator Response: [DB] "I assume you mean sq.km not sq.miles Daniel." Thanks for the heads-up on the slip-up. And sadly, no: 'Tis not Tom engaging in sophistry.
  34. Continuing in the vein of offering mute testimony to the growing dominion of the summer sun in the Arctic: [Courtesy L. Hamilton] "No icecube is an iceberg, entire of itself; every icecube is a piece of the iceberg, a part of the Arctic Sea Ice cap. If an icecube be melted away by the sun, the Arctic Sea Ice cap is the less, as well as if a promontory were, as well as if a manor of thy friend's or of thine own were: Any icecube's demise diminishes me, because I am involved in the Arctic Sea Ice cap, and therefore never send to know for whom the bell tolls; it tolls for thee." Apologies to both Hemingway and Donne. The Yooper
    0 0
    Moderator Response:

    [DB] Forgot to post the linear relationship details on the chart:  R = .94

  35. db, I think I'd re-do that graphic without the links from year to year. Just a couple of simple dotted lines. One across at 8000 cubic km, one vertically at 4 million sqkm. Doesn't matter what we think about comparing trends, years, decades. We really are in new territory.
    0 0
    Moderator Response: [DB] Thanks for the suggestion; that one was not mine, though. The looming Zero point on the graph is compelling in itself. "We really are in new territory." Sadly, yes. And it happens on our watch.
  36. Daniel Bailey #130 Quite a bard Daniel. We can do science in rhyming couplets if you like - the numbers will still end up the same. I have already calculated the heat gain from the loss of sea ice mass at #66. Using the trend off the PIOMAS chart of -3.5E3 km3/decade, the number comes to 1.17E20 Joules/year. I used 1000kG/m3 for the density of ice, and Tom Curtis 'corrected' my hasty calc by pointing out that the density of Sea Ice is 917 kG/m3. Tom helpfully said: "You forgot to compensate for the lower density of ice, which is 917 kg/m^3 which reduces your figure to 1.07*10^20 Joules per year" Since this reduces my number by a massive 9% to be closer to Dr Trenberth's number of 0.9E20 Joules/year, his pedantry just does not transpose to his own calculations which at various times have be out by factors of 15 times, 2 times (was it 149 times way back in the beginning?)etc etc. Such bizarrity has even extended to Tom quoting temperatures to about 8 places behind the decimal point, for what purpose I cannot fathom. Even if we accept Flanner's number for NET Arctic sea ice melt due to reduced albedo of the missing sea ice, the number is still 5/145ths or 3.45% of the Earth's net imbalance from the Arctic - 4.4% of the planet's surface area. At the beginning of this thread - the theme was the supersized contribution of the Arctic to global warming. Anyway Daniel - what is your point?
    0 0
  37. Ken Lambert @133 and 136 wants to make rhetorical play of of my errors in calculation. Apparently it is his "... sound calculation which points out the trail of basic errors in Tom's elongated journey." I'm afraid he gives himself rather too much credit. He gives himself to much credit because, where I have been able to, I have consistently tracked down any errors or inaccurate assumptions of my own without his dubious assistance. More to the point, he gives himself too much credit because his own trail of errors is longer and larger than my own. The main difference between us being only that I correct my own errors. He persists in his. In fact, my calculations contains far more "errors" than he will admit to. To start with, my calculations consistently underestimate the altitude of the sun during the arctic summer. They consistently overestimate the absorption of light in the atmosphere, so much so that for 9 hours over every day my calculations treat the surface as being in complete darkness even though the sun is in the sky. My calculations consistently ignore the effects of waviness on albedo with waves much reducing water albedo for light coming from low above the horizon. My calculations ignore three months of the year in which the arctic sun provides enough heat to melt the ice. This list by no means exhausts my "errors" of this nature. But all these errors have one thing in common - they are errors in Lambert's favour. It turns out that no error is too large for Lambert to object to if it is an error in his favour, just as, apparently, no error is too small for him to object to if it goes against him. His comments about my "correction" of his calculation @66 are typical of this. I made seven corrections to his calculation, but here as in the rest of this thread he has chosen to ignore all six that show he has underestimated heat gain in the arctic. As always, only those changes that work in favour of his argument are ever allowed acknowledgement by Lambert. Nor are Lambert's mistakes limited to ignoring relevant factors that refute his argument. He has persistently tried to treat one seasons additional incoming flux as though it was thirty year additional incoming flux. That is a 130 fold error. What is more, it has the advantage of over my supposed 149 fold error of not being fictitious. More recently he took the average sea ice loss and divided it by two to find an "average" before halving again just because (so far as I can tell) he felt like it. That error is only a factor of four, but it has absolutely no warrant beyond Lambert's wishful thinking. All this is beside the point, however, other than to expose the blatant hypocrisy of Lambert's rant. Let's get down to substance. The essence of Lambert's claims are two points: 1) It is impossible that change in forcing in the Arctic should be more than a fraction of 4.4% of total forcing because the Arctic represents just 4.4% of the total Earth's surface; and 2) The total forcing in the Arctic closely approximates to an annual energy gain of 18*10^20 Joules, that being the additional energy gain in terms of melting arctic sea ice as calculated by Trenberth. The second point needs no further rebuttal. I have already pointed out six additional factors relevant to arctic heat gain at the first link in this post. As always, Lambert has simply ignored those alternatives without argument. The first point, forms the only topical part of Lambert's post. As a general principle it is obviously faulty. Plainly the net increased forcing due to decreased sea ice in the arctic is greater than that at the equator for the simple reason that there has never in human times, been sea ice at the equator to melt. Lambert, purports, however, to show that Flanner's calculated change in forcing due to lost Arctic sea ice only represents 3.45% of the total change in forcing. That total change as determined by Trenberth, Lambert's gold standard for this discussion is 0.9 W/m^2, or about 1.448*10^22 Joules each year. Flanner calculates a NH forcing of 6.2 W/m^2 per degree K for both sea ice and snow albedo effects. Of that, just under half, or about 3 W m^-2 K^-1 is due to sea ice. This needs to be halved to turn it into a global figure, and then adjusted for the temperature rise. Taking the temperature increase as being 0.38 degrees K, a conservative estimate, the globally averaged forcing due in reduced arctic sea ice is 0.3*0.5*0.38 = 0.057 W/m^2, or 9.17*10^20 Joules per annum. That represents 6.33% of total forcing from the Arctic. To double check, 0.57/0.9 = 0.0633 = 6.33% I am sorry to say that Lambert got his faulty value from my 131, where I calculated the value in error. Typical of Lambert, his ability to fact check vanished as soon as he had a result that appeared to suite his argument.
    0 0
  38. Another paper along the same lines as Flanner: Perovich et al 2011 Solar partitioning in a changing Arctic sea-ice cover The summer extent of the Arctic sea-ice cover has decreased in recent decades and there have been alterations in the timing and duration of the summer melt season. These changes in ice conditions have affected the partitioning of solar radiation in the Arctic atmosphere–ice–ocean system. ... Results indicate a general trend of increasing solar heat input to the Arctic ice–ocean system due to declines in albedo induced by decreases in ice concentration and longer melt seasons. The evolution of sea-ice albedo, and hence the total solar heating of the ice–ocean system, is more sensitive to the date of melt onset than the date of fall freeze-up. ... Our analysis applying a multiyear ice albedo evolution algorithm to seasonal ice overestimates the albedo and thus underestimates the solar heat input. As the multi-year ice pack declines and more of the Arctic has a seasonal ice cover, more solar heat will be input to the ice–ocean system, resulting in an enhanced ice-albedo feedback.
    0 0
  39. 138 Muomcounter I have no argument with your quotation. viz: "As the multi-year ice pack declines and more of the Arctic has a seasonal ice cover, more solar heat will be input to the ice–ocean system, resulting in an enhanced ice-albedo feedback" The nub of this thread is the size of the extra heat gain compared with other parts of the planet.
    0 0
  40. KL#139: "nub of this thread is the size of the extra heat gain compared with other parts of the planet." No, the nub of this thread is the change in the northern hemisphere; in particular, the northern part of the northern hemisphere - what may someday no longer be called the cryosphere. See the Flanner paper, whose title states "Radiative forcing and albedo feedback from the Northern Hemisphere cryosphere ..." So by voicing agreement with Petrovich, you must also agree with Flanner as well as the author of this post.
    0 0
  41. MC #140 ( -Moderation complaint snipped- ). I might as well talk to you MC ( -Inflammatory snipped- ). Is Tom's quotation of Flannner right?: viz "More importantly for this thread, Flanner estimates that the increased net energy absorption (additional energy absorbed - additional energy lost) due to arctic sea ice melt is around 5*10^20 Joules, or approximately 42% of the conservative estimate of additional incoming energy flux. As Ken would say, this is quite close to Trenberth's figure of 3.4*10^20 Joules needed to explain melting and warming of Arctic ice." If so, have I not made my case against the 17E20 and 18E20 Joules/year numbers which Tom was talking about?
    0 0
    Moderator Response: [DB] Your comment was deleted due to a pervasive use of all caps; a violation of the Comments Policy.
  42. Ken Lambert @141, Flanner does not, SFAIK estimate the total additional energy absorbed by the arctic (net increased energy minus net increased outgoing energy). Rather, he estimates a forcing change per degree K averaged over the Northern Hemisphere. That can be turned into a value for net additional energy simply by multiplying by the surface area of the NH and and the actual change in temperature over the period; or to an actual globally averaged forcing by halving the value and multiplying by the temperature gain. These are also appropriately called Flanner's estimates IMO in that they constitute only a change of unit, and a multiplication by the actual temperature increase. They are not a quotation, and I am never claiming to quote somebody unless I enclose the text in exclamation marks. The "estimate" you quote in the surviving part of post 141 was in error (and as that is simple arithmetic, I can only plead exceptional tiredness as an excuse). The "correct" value is Flanner's value of 6.2 W/m^2 estimate is given in my 137. Again, more correctly it is my estimate based on Flanner's figure for NH radiative forcing, but again simple arithmetic takes you from one to the other, and you can double check the arithmetic for yourself. I apologize for any confusion. Finally, even if the Flanner based estimate were 3.4*10^20 Joules rather than the better 9.17*10^20 Joules, you would still not have shown my 17 or 18*10^20 Joules per summer season (not year) estimates where incorrect. This is because those estimates were of the increase in incoming energy flux, while Flanner's is an estimate of the increase in incoming energy flux minus the increase in outgoing energy flux. To show an inconsistency you would have to show the outgoing energy flux did not increase by around 9*10^20 Joules, however, if we were to go down that route we would need to find a much better estimate of the increased incoming flux than mine (which remains a significant underestimate).
    0 0
  43. Oops - accidental enter - ignore #143 Thanks for your apology of sorts Tom. We can keep this on first name terms surely. Lets go to Dr Trenberth's paper "Tracking the Earth's Global Energy" Aug09 and make a generous estimate from it: Ref Table 1. These are his estimates: in Joules/year Arctic Sea Ice: 1E20 Ice Sheets: 1.4E20 (half Greenland half Antarctica) Ocean (global): 20-95E20 (average 58E20) For the Arctic estimate of NET heat absorption (incoming minus outgoing): Arctic Sea Ice: 1E20 Ice Sheets: 0.7E20 (including all Greenland loss) Ocean: 4.2% of 58E20 = 2.44E20 for all Earth area above 66N Total: 1 + 0.7 + 2.44 = 4.14E20 Joules/year This assumes that ALL the Greenland ice loss is included and the area proportion (4.2%) of the global average ocean heat absorption even though not all the ice is lost in the Arctic in summer so the average albedo for the whole planet's oceans is implied in using the 4.2% proportion. This is conservative because most of the worlds oceans are ice free and the average albedo would be lower than the Arctic which still has ice in summer. Even if we took the top end of Dr Trenberth's range for global oceans of 95E20 Joules/year, then 4.2% of that would be 3.99E20 and the sum 1 + 0.7 + 3.99 = 5.69E20 Joules/year. With the above conservative assumptions, the NET Arctic range is 4.14 - 5.69E20 Joules/year. Adding in the 4.2% proportion from the global oceans also ignores any transport of heat from elsewhere on the planet, so surely overestimates the effect of absorption Solar heat by albedo decrease due to ice loss of the Arctic surface area by itself. The above 4.14 - 5.69E20 number is still roughly half the NET 9.17E20 Joules/year you are claiming from Flanner.
    0 0
  44. 143, Ken, In your tally, I believe you are ignoring a major component, i.e. energy absorbed by land (deprived of previous snow/ice cover). More importantly, Flanner's study covers the entire northern hemisphere, not just the Arctic circle, so this change in albedo would extend well south, and include a strong input resulting from the earlier springs and later winters that we have experienced since the onset of recent climate change. You keep restricting your estimate to 4.4% of the earth (I'm assuming this is the Arctic Circle, plus a bit), when snow and ice extends considerably farther south than that, particularly on land.
    0 0
  45. Sp #144 Well tell us the area of the Earth's surface you are considering. We can go from 4.4% inside the Artic circle to 50% for the NH if you like.
    0 0
  46. 145, Ken, You dodged the question. You said:
    The above 4.14 - 5.69E20 number is still roughly half the NET 9.17E20 Joules/year you are claiming from Flanner.
    Flanner covers the entire northern hemisphere, while your numbers are limited to the Arctic Circle. That is clearly the discrepancy, and until you fill in the gap, I'm not quite sure what your point is.
    0 0
  47. Sphaerica The 4.14 - 5.69E20 number relates to the Arctic which is the area Tom Curtis has been calculating with the reduction in sea ice and decreased albedo. Remember the 1-2 million sq.km lost each summer? Tom then threw in Greenland ice loss - so I added that in the above number for comparison. Are you suggesting that Tom's 9.17E20 Joules applies to snow and ice for the whole northern hemisphere?
    0 0
  48. I had been preparing a response to Ken Lambert's 143. That response has been delayed primarily because I was trying to track down detailed information of oceanic heat transfer from the sub-arctic to the arctic, and from the surface to the depths in the arctic. However, in light of Lambert's unsavoury characteristic of claiming victory anytime a response delayed, in light of his incapability of admitting error coupled with a determination to score rhetorical points of the errors of others, and in light of his inability to keep even simple concepts straight (as for example the difference between change in incoming energy due to change in albedo (as discussed here) as distinct from the amount of energy used to melt a particular volume of ice (which he repeatedly treats as equivalent), no response will be forthcoming. I find arguments from obtuseness uninteresting - and evidently, that is all that Lambert has to offer this forum. As that is all he has to offer, the rebuttal of any current claim by Lambert can easily be found by perusing previous posts. (In this particular case, one might start by asking just how many heat sinks are their in the arctic. The answer is not three.)
    0 0
  49. Tom Curtis #148 Well this takes us full circle Tom. I started off my part in this thread asking why you were highlighting the change incoming energy from decreased albedo and ignoring the outgoing. The NET is what counts. I have quoted Dr Trenberth's numbers for the NET estimated energy uptake from melting Arctic ice plus all Greenland ice plus a 4.2% porion of the global ocean uptake at #143. With these generous totals - we get 4-5E20 Joules/year from Trenberth. Why would you not accept that and call it quits?
    0 0
  50. This seems apropos (and a bit of humor can't hurt this discussion): source Before anyone objects, no doubt the bear means that NY's winter TOA insolation is less than that of the Arctic summer, which a quick glance at an insolation graphic verifies.
    0 0

Prev  1  2  3  

You need to be logged in to post a comment. Login via the left margin or if you're new, register here.


The Consensus Project Website

THE ESCALATOR

(free to republish)


© Copyright 2024 John Cook
Home | Translations | About Us | Privacy | Contact Us