


 Arguments


Ten temperature records in a single graphic
Posted on 26 January 2011 by John Cook
Last week in Monckton Myth #2, Robert Way published an intriguing graph 'All Method Temperature Index'. The graph plots the average of ten different global temperature datasets:

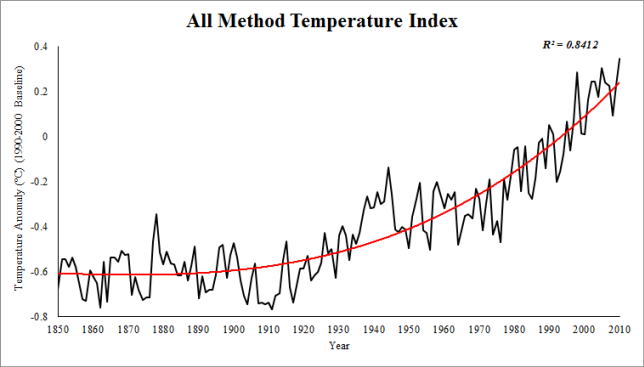
Figure 1: All Method Temperature Index (AMTI). 1990-2000 Baseline.
To create this graph, Robert had to track down a number of different temperature series. There were your classic "rock star" datasets - NASA GISS, NOAA and HadCRUT. The other favourites, although not going back as far as the thermometer records, are the satellite records UAH and RSS.
But another great addition are a number of other "reanalysis products". These are datasets that use a wide range of sources to reconstruct temperature. This includes thermometers, radiosondes, satellites, buoys and ship measurements. This way, they're able to create temperature records covering the entire globe, even Arctic regions that other datasets such as UAH, RSS and HadCRUT fail to cover. This is important because the Arctic is warming faster than the rest of the planet. To omit the Arctic is to underestimate the global warming trend.
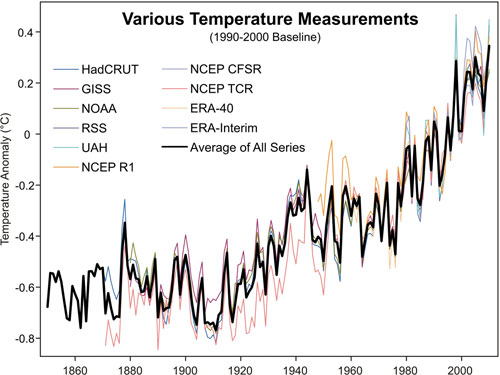
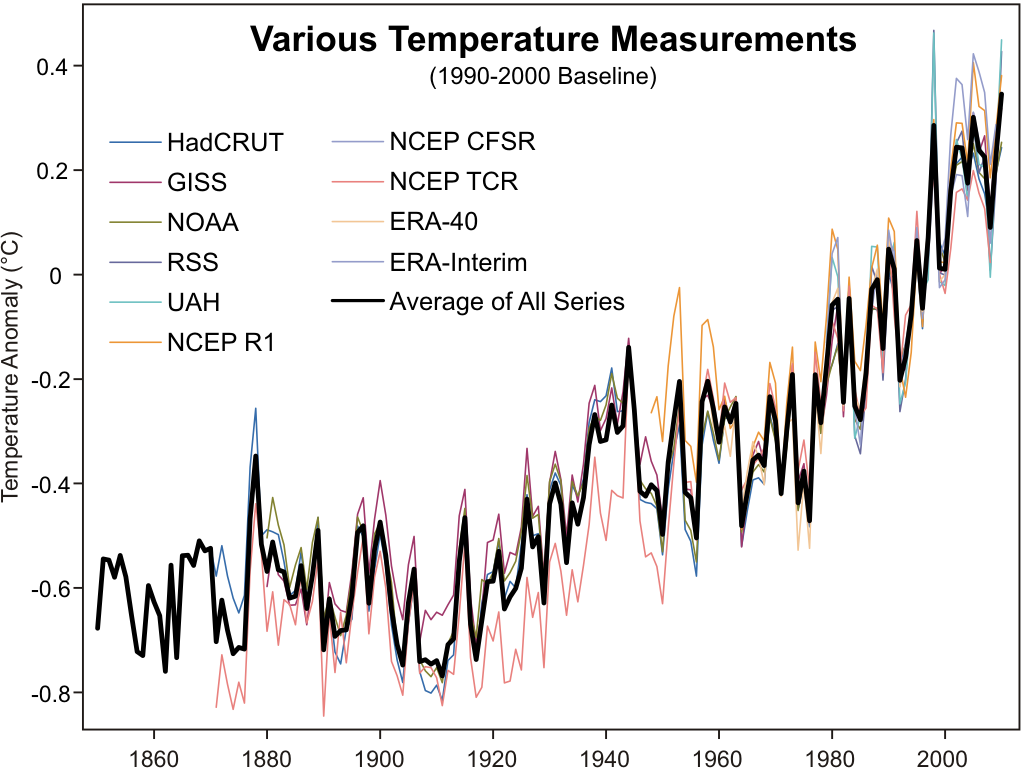
Robert has also plotted a graph of all ten temperature records in a single graph, a vivid reminder that many independent lines of evidence all tell us the same thing. I've added it to our steadily growing Climate Graphics resource:
As with all our climate graphics, this is under a Climate Commons license so you're free to use this elsewhere. And the graph is available in a number of formats including an Excel Spreadsheet which contains all of Robert's methodology including the ten datasets and his graph from Monckton Myth #2. I'm very happy about this as I've been wanting to get hold of the European reanalysis data for while but have been too lazy busy to process the data myself :-)


 0
0  0
0 [sourced here; more information here].
One would have to choose a level or layer. It seems that NCDC uses the 850-300 mb layer.
[sourced here; more information here].
One would have to choose a level or layer. It seems that NCDC uses the 850-300 mb layer.
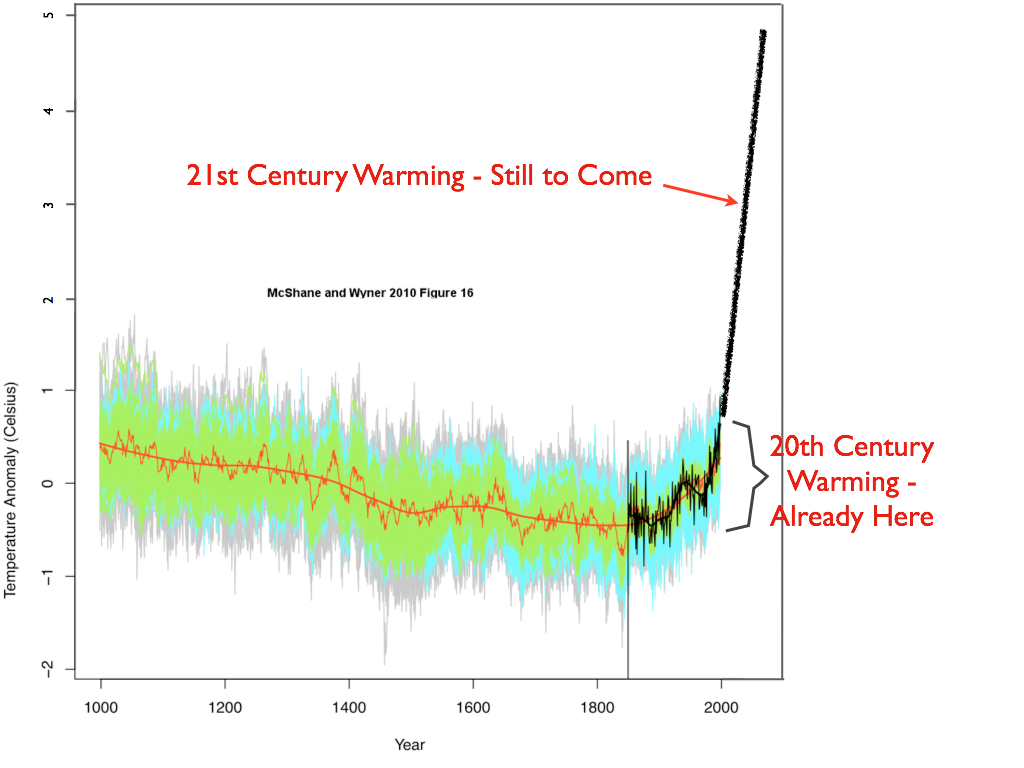
 With yet more warming in the Business-As-Usual (BAU) pipeline:
 The Yooper
 [Source: here]
Regarding the Arctic:
Miller et al. (2010, QSR):
"Solar energy reached a summer maximum (9% higher than at present) 223c.gif ¨11 ka ago and has been decreasing since then, primarily in response to the precession of the equinoxes. The extra energy elevated early Holocene summer temperatures throughout the Arctic 1–3 °C above 20th century averages, enough to completely melt many small glaciers throughout the Arctic, although the Greenland Ice Sheet was only slightly smaller than at present."
Jakobsson et al. (2010, QSR):
"The combined sea ice data suggest that the seasonal Arctic sea ice cover was strongly reduced during most of the early Holocene and there appear to have been periods of ice free summers in the central Arctic Ocean."
Also from Polyak et al. (2010, QSR):
"The current reduction in Arctic ice cover started in the late 19th century, consistent with the rapidly warming climate, and became very pronounced over the last three decades. This ice loss appears to be unmatched over at least the last few thousand years and unexplainable by any of the known natural variabilities."
So in the early Holocene, when temperatures were likely 1-3 K above 20th Century values, the Arctic may have been ice free during the summer. Now consider that The Arctic has already warmed by 1-2 K relative to temperatures in the early to mid 20th century, and recently has been warming at almost three times the global rate (about 0.5 K per decade since 1979). These data suggest that the Arctic is already very close to temperatures experienced there in the early Holocene, and will very likely exceed them around circa 2040. That is also when we will likely see the Arctic briefly ice free in the summer, although it is not impossible that the Arctic could be largely ice free before then.
By 2100 warming of annual temperatures by +5 K predicted by the IPCC for the Arctic (range 3-8 K). Our current emissions path (SRES A2) suggests a warming of almost +6 K with respect to early 20th century temperatures, way above anything seen over the Arctic during the Holocene.
[Source: here]
Regarding the Arctic:
Miller et al. (2010, QSR):
"Solar energy reached a summer maximum (9% higher than at present) 223c.gif ¨11 ka ago and has been decreasing since then, primarily in response to the precession of the equinoxes. The extra energy elevated early Holocene summer temperatures throughout the Arctic 1–3 °C above 20th century averages, enough to completely melt many small glaciers throughout the Arctic, although the Greenland Ice Sheet was only slightly smaller than at present."
Jakobsson et al. (2010, QSR):
"The combined sea ice data suggest that the seasonal Arctic sea ice cover was strongly reduced during most of the early Holocene and there appear to have been periods of ice free summers in the central Arctic Ocean."
Also from Polyak et al. (2010, QSR):
"The current reduction in Arctic ice cover started in the late 19th century, consistent with the rapidly warming climate, and became very pronounced over the last three decades. This ice loss appears to be unmatched over at least the last few thousand years and unexplainable by any of the known natural variabilities."
So in the early Holocene, when temperatures were likely 1-3 K above 20th Century values, the Arctic may have been ice free during the summer. Now consider that The Arctic has already warmed by 1-2 K relative to temperatures in the early to mid 20th century, and recently has been warming at almost three times the global rate (about 0.5 K per decade since 1979). These data suggest that the Arctic is already very close to temperatures experienced there in the early Holocene, and will very likely exceed them around circa 2040. That is also when we will likely see the Arctic briefly ice free in the summer, although it is not impossible that the Arctic could be largely ice free before then.
By 2100 warming of annual temperatures by +5 K predicted by the IPCC for the Arctic (range 3-8 K). Our current emissions path (SRES A2) suggests a warming of almost +6 K with respect to early 20th century temperatures, way above anything seen over the Arctic during the Holocene.

 And here is another Hockey Stick published only days ago:
 There are enough Hockey Sticks out there to equip a couple of NHL teams.


Comments