Climate Science Glossary

Term Lookup

Enter a term in the search box to find its definition.

Settings

Use the controls in the far right panel to increase or decrease the number of terms automatically displayed (or to completely turn that feature off).

Term Lookup

Settings


All IPCC definitions taken from Climate Change 2007: The Physical Science Basis. Working Group I Contribution to the Fourth Assessment Report of the Intergovernmental Panel on Climate Change, Annex I, Glossary, pp. 941-954. Cambridge University Press.

Home Arguments Software Resources Comments The Consensus Project Translations About Support

Twitter Facebook YouTube Mastodon MeWe

RSS Posts RSS Comments Email Subscribe


Climate's changed before
It's the sun
It's not bad
There is no consensus
It's cooling
Models are unreliable
Temp record is unreliable
Animals and plants can adapt
It hasn't warmed since 1998
Antarctica is gaining ice
View All Arguments...


Username
Password
New? Register here
Forgot your password?

Latest Posts

Archives

Roy Spencer’s Latest Silver Bullet

Posted on 22 May 2011 by bbickmore

Barry Bickmore is a geochemistry professor at Brigham Young University who runs the blog Anti-Climate Change Extremism in Utah.  He has graciously allowed us to re-publish his excellent post on Roy Spencer's latest blog post "Silver Bullet" that climate sensitivity is low.

Summary:  Roy Spencer has come up with yet another “silver bullet” to show that climate sensitivity is lower than IPCC estimates.  I.e., he fits a simple 1-box climate model to the net flux of heat into the upper 700 m of the ocean, and infers a climate sensitivity of only about 1 °C (2x CO2).  There are several flaws in his methods–inconsistent  initial conditions, failure to use the appropriate data, and failure to account for ocean heating deeper than 700 m.  (He partially fixed the last one in an update.)  All of these flaws pushed his model to produce a lower climate sensitivity estimate.  When the flaws are corrected, the model estimates climate sensitivities of at least 3 °C, which is the IPCC’s central estimate.  In any case, a simple 1-box climate model does not appear to be adequate for this kind of analysis over only a few decades.  But while Spencer’s latest effort doesn’t really do any damage to the consensus position, it turns out that it does directly contradict the work he promoted in The Great Global Warming Blunder.

Since I launched my blog a year ago, I’ve had the chance to examine the claims of a number of climate contrarians.  One thing that has surprised me is how often the contrarians seem to think they’ve come up with a “silver bullet” to shoot down mainstream scientific views about how sensitive the climate is to forcing by greenhouse gases, etc.  By “silver bullet” I mean a very simple, direct, and clear demonstration that the mainstream is flatly wrong.  Why is this so surprising?  Because even though climate response is a complicated subject, overall sensitivity has been estimated at least nine different ways, and many of these methods are based on paleoclimate data, rather than model output.  Since all of these methods have produced roughly the same answer, the vast majority of climate scientists have concluded that the climate is pretty unlikely to be insensitive enough to avoid major problems if we continue to burn fossil fuels like we have been.  In other words, the possibility of a silver bullet in this case seems remote.

In my career as a scientist I’ve come up with a couple “silver bullets,” although they weren’t about anything so dramatic, but the fact is that nine times out of ten when I’ve gotten excited because I THOUGHT I had one, further investigation showed that I had made some minor mistake, and in fact the scientists whose work I was examining were right.  What bothers me about the climate contrarians is that it doesn’t seem to occur to many of them to keep digging once they get an answer they like.

Roy Spencer is a prime example of a contrarian scientist who exhibits this tendency.  As I noted in my recent review of Spencer’s The Great Global Warming Blunder, he has a history of publishing dramatic new evidence for low climate sensitivity… and then letting others sort out the serial errors he’s made.  E.g., he said the reason he published his book was that he could virtually prove climate sensitivity is low and recent warming has been the result of chaotic natural variation, but establishment scientists had blocked publication of this silver bullet in the peer-reviewed literature.  I took apart his work, however, and found out that he was only able to get the answer he liked by plugging physically unreasonable parameter values into his model.  What’s more, his results depended on a numerical fitting procedure that I hesitate to call “statistical,” because no statistician would ever suggest such a thing.  Spencer’s answer?  He says he’s too busy writing papers for the peer-reviewed literature to respond to a critique on a blog.

Well, in a new blog post, Roy claims to have yet another silver bullet that is supposed to trump those nine other methods for estimating climate sensitivity.  That is, he has modified a “simple climate model” (i.e., a zero-dimensional or 1-box climate model) to produce a climate sensitivity estimate based on recently published ocean heat content (OHC) data.  Here again, I’m going to closely examine Spencer’s methods.  Unsurprisingly, it turns out that this particular silver bullet doesn’t do any damage to the consensus on climate sensitivity.  However, my readers might be a little surprised to find out that Spencer’s discussion of his new approach provides a very clear demonstration of why the modeling results he promoted in his book were meaningless.  Maybe it is a silver bullet after all.

Ocean Heat Content and Net Radiative Flux

Spencer focuses on the OHC data series published by Sydney Levitus and colleagues.  (Here is the explanatory page for the data set.)  The series estimates the total heat content of the 0-700 m layer of the ocean since 1955, in units of 10^22 J.  Now, if you take into account the total surface area of the ocean (~3.6 x 10^14 m^2) it’s easy to calculate the net flux of energy going into the upper 700 m of the oceans.

Figure 1 shows the net heat flux into the 0-700 m layer of the ocean, calculated as explained above.  I’ve also digitized Spencer’s calculated flux from this figure and plotted it.  Notice that both lines plot exactly on top of one another.  This shows that both he and I were at least using 1) the same OHC data, and 2) the same ocean area.

Figure 1. Heat flux into the 0-700 m layer of the ocean from 1956-2010, calculated by me (black) and Roy Spencer (red).

Spencer realized that he could interpret this data through the lens of a modified version of his simple climate model.  (I explained the original version more thoroughly here.)  The modified model is shown in Eqn. 1, where Cp is the total heat capacity of a 1 x 1 x 700 m column of water, T[700] is the average temperature anomaly of the 0-700 m layer of the ocean relative to some equilibrium, dt is the time step, F is the radiative forcing of the system relative to equilibrium, a is the feedback factor, and Ts is the average surface temperature anomaly of the ocean relative to equilibrium.

    (1)

Let’s restate that in English.  On the left side of the equation, we multiply the heat capacity of a 700 m column of water that is 1 m^2 on top (700 m * 4180000 J/m^3/K) by the rate of change of the average temperature of the 0-700 m layer (units = K/s).  When we multiply those out, we get the net flux of heat energy into the ocean (units = W/m^2).  So the left side of the equation represents the same thing we plotted in Fig. 1.  The net flux of heat into the ocean equals the forcing on the system (units = W/m^2) plus the feedback (units = W/m^2).  The feedback on the system is just the response of the system to a temperature change, in terms of a change in the amount of radiation sent back into space.  In Spencer’s model, the feedback term includes the Planck response (change in black-body radiation with a change in temperature), and whatever else (changes in cloud cover, water vapor, and so on, in response to a temperature change.)  The feedback is represented as the negative of the feedback factor multiplied by the surface temperature anomaly.

Now, James Hansen at NASA has published estimates of climate forcing (both human and natural) since 1880, and Spencer noted that the HadSST2 sea surface temperature series seems to be rising about 3.5x as fast as T[700]. Spencer’s idea was that if he knew the net heat flux into the ocean and the forcing on the system, and could link the the ocean surface temperature to the 0-700 m layer temperature, all he had to do was run Eqn. 1 in a finite difference model and adjust the feedback factor until the net heat flux in the model output adequately mimicked the real net heat flux data (Fig. 1).

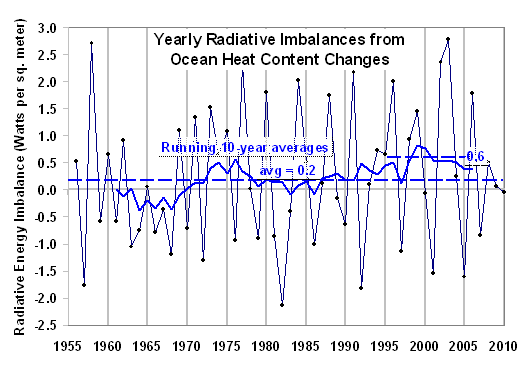
Fig. 2 plots the net heat flux output from Spencer’s model along with a 10-year smoothed version of the data in Fig. 1.  Readers will note that the model output doesn’t seem like that good of a fit to the smoothed version of the real heat flux data.  However, Spencer doesn’t appear to have been fitting the model output to the entire data series.  He appears instead to have been trying to get the same average flux value of 0.2 W/m^2 over the whole series, and an average of about 0.6 for the period 1995-2005.

Figure 2. Hansen's forcing values are plotted here along with the feedback and net heat flux values generated by Spencer's model. A 10-year smoothed series of the real heat flux values (Fig. 1) is also plotted here for comparison.

The a value he came up with was 4 W/m^2/K, which is equivalent to a climate sensitivity of about 1 °C per doubling of CO2.  Since the IPCC puts a lower limit on climate sensitivity of 1.5 °C and a probable range of 2-4.5 °C, Spencer asks,

"Now, what I do not fully understand is why the IPCC claims that the ocean heat content increases indeed ARE consistent with the climate models, despite the relatively high sensitivity of all of the IPCC models."

Actually, the IPCC is more equivocal about whether the GCMs they use account for OHC data.  They say,

"Although the heat uptake in the ocean cannot be explained without invoking anthropogenic forcing, there is some evidence that the models have overestimated how rapidly heat has penetrated below the ocean’s mixed layer (Forest et al., 2006; see also Figure 9.15). In simulations that include natural forcings in addition to anthropogenic forcings, eight coupled climate models simulate heat uptake of 0.26 ± 0.06 W m–2 (±1 standard deviation) for 1961 to 2003, whereas observations of ocean temperature changes indicate a heat uptake of 0.21 ± 0.04 W m–2 (Section 5.2.2.1). These could be consistent within their uncertainties but might indicate a tendency of climate models to overestimate ocean heat uptake."

They go on to explain that there could be problems with how the models handle heat transfer in the ocean, or with the OHC data itself.  (E.g., the upper 300 m of the ocean is fairly well observed, and the models agree well with the data there, but there isn’t nearly as much data for greater depths so there could be sampling artefacts.)

In fact, James Hansen has recently brought up this issue, as well.  In any case, the IPCC does at least indicate that their models get in the same ballpark as the OHC data, so the dilemma Spencer poses is reasonable to bring up.

The Easy Answer

There are a number of ways we can answer Roy Spencer’s dilemma, but perhaps the easiest one is simply to note that a 1-box climate model probably isn’t adequate to answer the kinds of questions he is using it for.  Regarding this issue, Spencer characterized the climate modeling community in an unflattering light in The Great Global Warming Blunder (p. xxii).

"Climate models are built up from many components, or subsystems, each representing different parts of the climate system.  The expectation of the modelers is that the greater the complexity in the models, the more accurate their forecasts of climate change will be.  But they are deceiving themselves.  The truth is that the more complex the system that is modeled, the greater the chance that the model will produce unrealistic behavior."

In my experience, this is a gross mischaracterization of the climate modeling community.  The truth is that modelers generally understand “Einstein’s Razor” very well, i.e., that theories and models “should be made as simple as possible, but no simpler.”  In their textbook, Mathematical Modeling of Earth’s Dynamic Systems, Rudy Slingerland and Lee Kump put it this way.  ”Bad models are too complex or too uneconomical or, in other cases, too simple” (p. 2).

In this case, a potential problem with a model like Eqn. 1 is that all the feedbacks are lumped together, but in reality different climate feedbacks operate on different timescales.  E.g., look at Fig. 2 again, and note that the forcing series has a number of sharp downward spikes, which are due to major volcanic eruptions, and almost identical spikes appear in the heat flux model output.  And yet, no such spikes appear in the real data.  Why?  Because if different feedbacks operate on different timescales, then those kinds of short-term perturbations tend to get smoothed out in the overall climate response.

In a recent blog post, climatologist Isaac Held examined just this issue.  He actually took a model exactly like Spencer’s and fit it to the output from a GCM that he uses.  Then he estimated the equilibrium climate sensitivity of both models by running them with a constant forcing equivalent to doubling the CO2 in the atmosphere, and finding the temperature they settled into after a while.  It turned out that whereas the GCM had a sensitivity of  about 3.4 °C (2x CO2), the simple model only had a sensitivity of about 1.5 °C.  This is interesting, because the simple model was parameterized specifically to mimic the output of the GCM.  Could it be that the issue of overall climate sensitivity is more complex than a model like Eqn. 1 can address, at least over timescales of a few decades?  Could it be that such a model would consistently low-ball its estimated climate sensitivity?  One thing is clear–Roy Spencer hasn’t asked questions like these, whereas bona fide climate modelers like Isaac Held have.

Spencer’s Flawed Modeling

What if the opposite is true, however?  That is, what if more complex models like GCMs consistently overestimate climate sensitivity, all the while fitting the same data as a more simple model?  I’m not really in a position to address that question, but let’s assume for the moment that Spencer’s simple model is adequate to the task.  Now the question is, did he apply the model correctly?

Well, no.

First, take another look at Fig. 2 and Eqn. 1.  The temperature terms in Eqn. 1 are temperature anomalies, i.e., in a model like this they refer to the difference between the temperature and some assumed equilibrium state.  The larger the absolute value of the temperature anomaly, the larger the feedback term becomes, providing a strong pull back toward the equilibrium temperature.  The feedback curve in Fig. 2 starts at 0 W/m^2 in 1955, so it is apparent that Spencer began his model in equilibrium in 1955.  We can argue about whether the climate was really in any kind of “equilibrium” in 1955, but the trouble doesn’t end there.  ”Forcing” refers to a change in the energy input relative to some assumed “normal” state.  Obviously, if Spencer assumed the climate was in equilibrium in 1955, he should have adjusted his forcing numbers to zero in 1955, as well, but instead he started his model run at 0.34 W/m^2 forcing.  Why?  Because Hansen’s climate forcing estimate is 0.34 W/m^2 in 1955, but Hansen’s series is referenced to the year 1880.  In other words, the entire forcing series is 0.34 W/m^2 too high, given Spencer’s other initial conditions.

Am I nitpicking, here?  Remember that the average net heat flux over 1955-2010 is only about 0.2 W/m^2, which is significantly less than the error in forcing.  What’s more, if the forcing is uniformly too high, the feedback has to be more negative by the same amount to produce the same net heat flux result.  In other words, the a parameter in Eqn. 1 has to be larger than it otherwise would be, indicating a less sensitive climate.

Second, Spencer’s feedback series shown in Fig. 2 is model output, but if the feedback depends on Ts (see Eqn. 1), how can the model spit out BOTH the feedback AND the net heat flux, which depends on changes in T[700]?  Spencer gave us a clue when he noted that the rate of change in the HadSST2 global average sea surface temperature was about 3.5x the rate of change in T[700] from 1955-2010.  Therefore, I guessed that he had linked the two temperatures together in the model like so (Eqn. 2).

   (2)

I ran this model by the finite difference method in Microsoft Excel, using 1 year time steps, and came up with a feedback curve that exhibits a general trend pretty close to that of Spencer’s (see Fig. 3).  My curve is a lot more noisy, which could be due to me using a different time step, Roy smoothing the data, or whatever.  (I sent two requests to see his code, which he has so far ignored.  I also asked him whether I was right that he linked T[700] and Ts by a factor of 3.5 in his model, but he hasn’t responded to that, either.  He was kind enough to answer a couple of my questions, however, which was very helpful.)  In any case, it’s pretty clear that my model is pretty similar to whatever Spencer did.

Figure 3. Feedback produced by running Eqn. 2 as a finite difference model (blue) compared to the feedback Spencer reported (red).

Even after I asked Roy and he told me the feedback was model output, it actually took a while for me to think of the idea to link the two temperatures by a constant factor.  I initially just assumed that he would have used the HadSST2 temperature anomaly as input to the model, because if I already have data for Ts, why make the model generate it?  In any case, since Spencer had his model generate the feedback, all we have to do is compare the model feedback values with the HadSST2 data for Ts, zeroed at 1955 and multiplied by 4 W/m^2/K (see Eqn. 1).  This comparison is shown in Fig. 4.

Figure 4. Feedback in Spencer's model output (red) compared to the feedback generated by multiplying the HadSST2 sea surface temperature anomaly by 4 W/m^2/K.

Whereas Spencer adjusted the a parameter in his model to fit the net heat flux data, he apparently paid no attention to how well his model reproduced the average ocean surface temperature.  Spencer’s feedback curve is never as strong as the one generated using real ocean surface temperatures, so it’s clear that his model-generated ocean surface temperatures are uniformly too low.  Therefore, to get the same feedback, his model has to adopt a larger value of a, once again making the climate seem less sensitive than it should be.

Another odd thing about Roy Spencer’s latest modeling adventure is that he doesn’t seem to have taken the normal route of fitting the model to the OHC data via a least-squares regression.  Rather, it appears he was trying to make his model produce the same average heat flux over the entire period as the real data (0.2 W/m^2).  Given the corrections I outlined above (using real ocean surface temperatures and zeroing the forcing at 1955,) I decided to try both methods to see what kind of feedback parameters I would get.  When I did a least-squares regression, varying the feedback factor to fit the OHC data, I got an a value of 1.1 W/m^2/K, which amounts to an equilibrium climate sensitivity of about 3.4 °C.  This is not only within the probable range given by the IPCC, it’s very close to their central estimate of 3 °C.  When I adjusted the model to produce an average heat flux of 0.2 W/m^2 for 1955-2010, I got an a value of 0.7 W/m^2/K, i.e., a climate sensitivity of about 5.2 °C, which is above the IPCC’s most likely range.  I have plotted the smoothed heat flux data along with Spencer’s model output and the output from both my model runs in Fig. 5.  Readers should note that all the models (including mine) pretty much suck at fitting the data, reinforcing the point that a simple 1-box climate model probably isn’t the best tool for this job.

Figure 5. Here the net flux of heat into the ocean (subjected to a 10-yr smoothing routine) is compared with Spencer's model and two models I ran.

Finally, Spencer’s readers pointed out in the comments on his blog that the ocean has been heating up below 700 m, as well.  Spencer posted an update to his blog entry that says he took into account heating down to 2000 m, and he came up with a climate sensitivity of 1.3 °C, which is a bit larger than his original estimate of 1 °C.

Conclusions

The fact is that a simple 1-box climate model like Spencer’s probably isn’t a very good tool for interpreting the meaning of a few decades of OHC data.  But if we try it anyway, we come up with climate sensitivity estimates that are at least as high as the IPCC’s central estimate of 3 °C.  In contrast, Spencer’s erroneous estimate is less than half of that at 1.3 °C.  Roy Spencer was only able to come up with low sensitivity estimates by committing serial errors that all pushed his estimates in the direction of lower sensitivity.  These errors include:  inconsistent  initial conditions, failure to use the appropriate data, and failure to account for ocean heating deeper than 700 m.  (He fixed the last one in an update.)  So the fact that Roy Spencer’s analysis contradicts at least nine other methods for estimating climate sensitivity is pretty meaningless.

This is becoming a familiar story.  Roy Spencer comes up with some great idea, all but proving the establishment wrong.  Instead of trying to work on his idea until it’s in good enough shape to pass peer review, he posts it on a blog or publishes it in a book, and then accuses the other scientists of ignoring evidence.  His true believers shower him with accolades (see the comments on his blog), and he leaves it up to others to point out the flaws in his methods.

I will say this in Roy Spencer’s defense, however.  At least he sometimes has the grace to admit he’s wrong when someone goes to the trouble to point out his errors.  For example, in my recent review of his bookThe Great Global Warming Blunder, I pointed out another serious abuse of the same simple climate model he used in his latest blog post.  One of the problems I pointed out was that his model assumed a 700 m mixed layer in the ocean, when it is really something more like 100 m.  In other words, his model assumed that the entire top 700 m of the ocean heats up and cools down at the same rate, which is nonsense.  Afterward, Roy mentioned on his blog that many of his readers had been asking him to respond to my review, but he said he was too busy trying to publish peer-reviewed science to waste his time responding to blog critiques.  And yet, in the blog post I’m critiquing here, I found the following frank admissions that I was right.

"The reason why we need to use 2 temperatures is that the surface has reportedly warmed about 3.5 times faster than the 0-700 meter ocean layer does, and radiative feedback will be controlled by changes in the temperature of the sea surface and the atmosphere that is convectively coupled to it….

While some might claim that it is because warming is actually occurring much deeper in the ocean than 700 m, the vertical profiles I have seen suggest warming decreases rapidly with depth, and has been negligible at a depth of 700 m."

Ok, so he didn’t specifically acknowledge that he had been wrong about this before, but I’m sure he meant to say that.

0 0

Printable Version  |  Link to this page

Comments

1  2  Next

Comments 1 to 50 out of 52:

  1. Great post, Barry. Spencer seems to be forming a pattern of making faulty modeling assumptions which happen to give him the answer he's looking for.
    0 0
  2. It should be noted that Spencer's inclusion of OHC down to 2000m doesn't fix the problem. Recent research has shown that there's significant amount of warming in the very deep ocean (below 2000m).
    0 0
  3. Whenever I read about Spencer's stuff the same simple (I think) unanswered question always comes to me instantly. If there is a "silver bullet" which will prevent increasing ghg emissions from warming the planet - why didn't it operate in the past?
    0 0
  4. I agree with Bickmore, lack of self-criticism seems to be a huge issue here. It was present just as strongly when Spencer concluded in his book that, "[e]ither I am smarter than the rest of the world’s climate scientists–which seems unlikely–or there are other scientists who also have evidence that global warming could be mostly natural, but have been hiding it." Being wrong never seemed to occur to him then, and it doesn't seem seriously considered now when he's still playing around with models in a seemingly blind, groping way. He should perhaps take his own advice from this tract on climate models: This is why validating the predictions of any theory is so important to the progress of science. The best test of a theory is to see whether the predictions of that theory end up being correct. In fitting his model to 20th/21st century data about OHC, he also seems to run aground on his own criticism of modelling again: The modelers will claim that their models can explain the major changes in global average temperatures over the 20th Century. While there is some truth to that, it is (1) not likely that theirs is a unique explanation, and (2) this is not an actual prediction since the answer (the actual temperature measurements) were known beforehand. If instead the modelers were NOT allowed to see the temperature changes over the 20th Century, and then were asked to produce a ‘hindcast’ of global temperatures, then this would have been a valid prediction. But instead, years of considerable trial-and-error work has gone into getting the climate models to reproduce the 20th Century temperature history, which was already known to the modelers. Some of us would call this just as much an exercise in statistical ‘curve-fitting’ as it is ‘climate model improvement’. Unless I have that wrong, he seems to be guilty of exactly the sins he's seen in others. Why is it alright for him to adjust his model to try and match observed OHC variation, but not for climate modellers to do the same with global temperatures? Shouldn't he be working blind, from 'first principles,' and wait in real-time for his model results to match future OHC measurements before declaring his 'predictions' accurate? It seems to me that his earlier critique of modelling in general would refute his own exercises if taken seriously.
    0 0
  5. What is the source for "Hansen's forcing data" in Figure 1? The link you give in two places above is the GISS-E forcing data 1880-2003 -- the set that zeros out the rate of change in black carbon and aerosols as of 1990, as can be seen in the file that includes details. Figure 1, however, shows forcing up through 2010. Is this the set from the draft Hansen et al 2011, that assumes net aerosol forcing for all years after 1990 will simply be -0.5 times the well mixed GHG forcing? Do you have a link for the forcing set used in the the graph? Thanks in advance
    0 0
  6. Missing links for above comment: Hansen forcings link from the article More detailed set, with net forcings equal to the above link The linked dataset of forcing is the one referenced in Hansen 2007 paper, Climate Simulations for 1880-2003 with GISS modelE, Clim. Dynam, 29, 661-696. Rather than just looking at graphs, I would like to do a more precise analysis of the change in forcings between Hansen's 2007 paper and the recent draft paper "Earth's Energy Imbalance and Implications". The caption Fig 1 of that paper reads "Forcings through 2003 are the same as used by Hansen el al. (2007b), except the aerosol forcing after 1990 is approximated as -0.5 times the GHG forcing. Aersol forcing includes all aerosol effects, including indirect effects on clouds and snow albedo."
    0 0
  7. Hi Charlie, I used the GISS data through 2003, because that's all I could find, but for the next few years I just digitized the data from Spencer's graph. I don't know where he got it, or if he just extrapolated.
    0 0
  8. It appears that he extrapolated. Between 2007 and 2011 Hansen changed forcings very signficantly. As I noted, in his latest paper, he chooses to set total aerosol forcing equal to to 1/2 that of GHG forcing (opposite sign of course). Obviously, this has the effect of reducing the net forcings by that amount. On the other hand, for the AR4 runs of GISS E, they more or less flatlined the aerosols from 1990 onward. So each incremental additional GHG forcing post-1990 would have full effect. In other words, he effectively cut the post-1990 GHG forcings in half by waving a magic wand. This 50% reduction in net forcings for GH gases post-1990 makes for a better match to the observed OHC. I have not been able to find a listing of detailed breakout of aerosol forcings for Hansen 2011, which would allow me to see if the choice to set aersol to -0.5 GHG forcing was as arbitrary as it appears.
    0 0
  9. I find Spencers finding of 1.3C sensitivity for doubling of CO2 as entirely unsurprising. The GISS E model has a sensitivity of only about 1.2C/doubling in the short term (5 years, for example) and only about 1.8C over a century timeframe. This is about the same as the NOAA GFDL CM2.1 model. See blogposts 3 through 6 at Isaac Held's blog that is hosted on the NOAA website, or look at Held et al 2010 (full text pdf). Held describes the NOAA GFDL CM2.1 response to a 100% step in CO2 as a rise to 1.5C in 3 or 4 years, then a plateau at that level for 70 years until it starts to slowly rise. Looking at the graphs, I would characterize it more like a 1.4C sensitivity CO2 doubling with a tau of 4 years, followed by 0.35C per hundred years slope for the next few hundred years.
    0 0
  10. Charlie @9, "I find Spencers finding of 1.3C sensitivity for doubling of CO2 as entirely unsurprising." Please pay attention, it has been demonstrated by Dr. Bickmore that Spencer was wrong, again. I do agree that this finding is unsurprising, but for very different reasons than you think. You are misrepresenting Held's research, that or you do not understand what his 2010 paper was about. Caption: The black curve in this figure is the evolution of global mean surface air temperature in a simulation of the 1860-2000 period produced by our CM2.1 model, forced primarily by changing the well-mixed greenhouse gases, aerosols, and volcanoes. Everything is an anomaly from a control simulation. (This model does not predict the CO2 or aerosol concentrations from emissions, but simply prescribes these concentrations as a function of time.) The blue curve picks up from this run, using the SRES A1B scenario for the forcing agents until 2100 and then holds these fixed after 2100. In particular, CO2 is assumed to approximately double over the 21st century, and the concentration reached at 2100 (about 720ppm) is held fixed thereafter. From Held et al. (2010): "The model’s equilibrium climate sensitivity for doubling, as estimated from slab-ocean simulations, is roughly 3.4 K. Consistent results for the equilibrium response are obtained by extrapolation from experiments in which a doubling or quadrupling of CO2 is maintained for hundreds of years." Held's work doesn't support a low equilibrium climate sensitivity, regardless of your efforts to distort his findings. The sensitivity of the GISS-E model, at least the last time I looked was +2.7 C. So you misrepresented them too.
    0 0
  11. Just to clarify Albatross's point...Charlie A clearly misinterpreted Fig 1 in Held et al 2010, which was a model experiment involving a sudden doubling of CO2. The point of that figure is that an initial increase in temp due to the "fast" response component of the model is separated from the increase due to the "slow" response component by a transient plateau in temps. Charlie A has misinterpreted this plateau as "equilibrium" despite the authors explicitly stating "the system is clearly still far from equilibrium when it plateaus, and Fig. 1 shows only the initial steps of the transition to the equilibrium response." This text and the text quoted by albatross was directly discussing that figure, so how Charlie A missed it is a mystery.
    0 0
  12. Stephen @11, Thanks. I realized a while after posting that "my caption" (from Held's blog) did not speak to the red lines. Thanks again for clarifying....although you were probably being polite....I should have been more diligent.
    0 0
  13. Albatross...No criticism was intended! I just wanted to point out (to anyone who cares) that Charlie A was referring to a different graph in the Held paper than the one you posted (fig 4). The one you post is actually much more relevant to the climate sensitivity of the model, but someone looking at it might have no idea why Charlie A said the things he did, and why they were incorrect. I was just trying to avoid future confusion. The red lines in your posted graph (where Held is doing the opposite experiment and suddenly forcing to preindustrial levels at different times) are depicting the inverse behavior depicted in Fig 1.
    0 0
  14. Hi Stephen, No worries, no offence taken. I was being critical of myself.
    0 0
  15. Great post! I was particularly interested in the following paragraph:
    In a recent blog post, climatologist Isaac Held examined just this issue. He actually took a model exactly like Spencer’s and fit it to the output from a GCM that he uses. Then he estimated the equilibrium climate sensitivity of both models by running them with a constant forcing equivalent to doubling the CO2 in the atmosphere, and finding the temperature they settled into after a while. It turned out that whereas the GCM had a sensitivity of about 3.4 °C (2x CO2), the simple model only had a sensitivity of about 1.5 °C. This is interesting, because the simple model was parameterized specifically to mimic the output of the GCM. Could it be that the issue of overall climate sensitivity is more complex than a model like Eqn. 1 can address, at least over timescales of a few decades? Could it be that such a model would consistently low-ball its estimated climate sensitivity? One thing is clear–Roy Spencer hasn’t asked questions like these, whereas bona fide climate modelers like Isaac Held have.
    I've been reading back over some of Authur Smith's old posts on two-box and other models, and had just come to this one (link) on calculating the response function directly by what is essentially a parameterised deconvolution. He also gets a low sensistivity: about 1.7C/2x over 50 years, although this increases to 2.7C if you integrate the long tail beyond 50 years. Tamino's 2-box model gives 2.4C, but he is also integrating a long tail. Integrating over a long tail seems suspect when you are deconvoluting a 130 year time series which shows probably only 40 years of unambiguous CO2 forcing, so from both of these I draw the same conclusion as you: simple models give low values of sensitivity compared to GCMs. (I'll try my own deconvolution when I get time). The question 'why?' is certainly the interesting one. Could the long tail issue be the key? e.g. suppose GCMs include a significant contribution from a heat resevoir (presumably the deep ocean) with a characteristic time in the high-decades to centuries? And that the simple models can't reproduce this because of the short period over which CO2 forcing has been dominant? I guess that's a question which could be answered by simulation. Or alternatively by using paleoclimate data in deriving the parameterisation of the simple model. Kevin p.s. Possible sources for Spencer's 2003-2010 data: he may have reconstructed the forcings himself from the raw data, but NASA also provide predictions for the future forcings here: http://data.giss.nasa.gov/modelforce/ - go to the 'Future scenarios' section just above the citations. I would have started here and updated the CO2 and solar data.
    0 0
  16. I gave a reference to the homepage of Isaac Held's blog and mentioned blogposts 3 through 6 as being the relevant ones. I see there is a need to be more specific. Blogpost #3. The simplicity of the forced climate response shows how the globally averaged results of the CM2.1 model can be emulated with reasonable precision with a very simple 2 term model with 4 year time constant. The parameters for this emulation include a sensitivity of 3.5 W/(m2 K0, which is the equivalent of about 1.5 C increase for a doubling of CO2. Willis Eschenbach has detailed a similar calculation for both GISS E and the CCSM3 models. See Zero Point Three Times Forcings and Life is like a Black Box of Chocolates For more details and a replication of the same toy model of GISS E in R, see Climate audit post Willis on GISS Model E". ------------------- If you prefer to see what Hansen says about this, then look at figures 7 and 8 of his recent self published white paper, "Earth's Energy Imbalance and Implications". Here's a copy of Figure 8A, showing the response function of GISS E for the first 123 years. Fig 7 shows the longer term response, with about 80% response at 600 years and almost to equilibrium after 2000 years. So if the GISS E equilibrium response is 3.0C for a doubling of CO2, the GISS E models predicts only a 1.2C rise 8-10 years after a doubling of CO2; about 1.5C rise at 50 years after a doubling of CO2, rising to 2.4C after 600 years and then 3C after 2000 years.
    0 0
  17. @Kevin C --- the expected increase in global average temperature for a doubling of CO2 is generally accepted to be in the 1.2 to 1/5C range when no feedback is assumed. The 1.5 to 4.5C range estimated by IPCC is assuming significant positive feedback. So if the models have relatively small feedback on short timescales (in this case, meaning less than 100 years), then the observations by many that the climate models have a sub-century transient sensitivity of 1.2 to 1.5C is not surprising. To me at least. ------------- Thanks for the link to GISS forcings page. Unfortunately, if you follow the future scenarios link, and then select tropical aerosols,you will see the same "flatline after 1990" set at the bottom of http://data.giss.nasa.gov/modelforce/trop.aer/ .
    0 0
  18. Albotross #10 says "You are misrepresenting Held's research, that or you do not understand what his 2010 paper was about." and #11 Stephen Bains says "Charlie A clearly misinterpreted Fig 1 in Held et al 2010, ...Charlie A has misinterpreted this plateau as "equilibrium" despite the authors explicitly stating "the system is clearly still far from equilibrium when it plateaus,..." " Both of those are clear misreadings of my post #10, where I said "Held describes the NOAA GFDL CM2.1 response to a 100% step in CO2 as a rise to 1.5C in 3 or 4 years, then a plateau at that level for 70 years until it starts to slowly rise. Looking at the graphs, I would characterize it more like a 1.4C sensitivity CO2 doubling with a tau of 4 years, followed by 0.35C per hundred years slope for the next few hundred years. " The term "plateau" was used by Held, not me. As I stated in comment #9, I prefer to characterize Fig 1 of Held 2010 (below) as a 1.4C response with 4 year time constant, followed by a 0.35C/100 years slope for a the next few hundred years. The 0.35C/100 years is the long tail, and will further slow after a few centuries. The total rise after many centuries is estimated to be 3.4C for a doubling of CO2. When discussing OHC from 1955 to 2010 and trying to determine sensitivity, we are not diagnosing or estimating the equilibrium sensitivity after centuries (or for GISS E, >2000 years). For this "short" period of only 55 years, climate models have a transient sensitivity that is much lower than the final equilibrium sensitivity. Graphically, this can be seen in Figure 1 of Held et al 2010 (clickable link to full text pdf in my post #9) Note that the above plots are for the full GCM model CM2.1, which has an estimated equilibrium sensitivity of 3.4C for a doubling of CO2. This estimate, by the way, is not found by running full model to equilibrium, but instead is from a 2 box model that emulates the full model.
    0 0
  19. Re Charlie's comments--this is how contrarians try and derail threads. It is funny how "skeptics" and contrarians and those in denial about AGW mock and deride climate models and believe them to be of little or no use, that is until they mistakenly think that such models support low climate sensitivity, transient or otherwise. Spencer is guilty of that, and so it seems are his uncritical supporters. Analyzing the OHC data correct, as Bickmore appears to have done, one obtains an equilibrium climate sensitivity of over 3 C. Quoting Bickmore from the above post: "When I did a least-squares regression, varying the feedback factor to fit the OHC data, I got an a value of 1.1 W/m^2/K, which amounts to an equilibrium climate sensitivity of about 3.4 °C. This is not only within the probable range given by the IPCC, it’s very close to their central estimate of 3 °C. When I adjusted the model to produce an average heat flux of 0.2 W/m^2 for 1955-2010, I got an a value of 0.7 W/m^2/K, i.e., a climate sensitivity of about 5.2 °C, which is above the IPCC’s most likely range. " From Forster and Gregory (2006): "Here, data are combined from the 1985–96 Earth Radiation Budget Experiment (ERBE) with surface temperature change information and estimates of radiative forcing to diagnose the climate sensitivity. Importantly, the estimate is completely independent of climate model results. A climate feedback parameter of 2.3 1.4 W m 2 K 1 is found. This corresponds to a 1.0–4.1-K range for the equilibrium warming due to a doubling of carbon dioxide... " From Gregory et al. (2002) [Source SkS]: "Gregory (2002) used observed interior-ocean temperature changes, surface temperature changes measured since 1860, and estimates of anthropogenic and natural radiative forcing of the climate system to estimate its climate sensitivity. They found: "we obtain a 90% confidence interval, whose lower bound (the 5th percentile) is 1.6 K. The median is 6.1 K, above the canonical range of 1.5–4.5 K; the mode is 2.1 K." From Wigley et al. (2005) who used the short-term response of the climate system to the Pinatubo eruption to estimate climate sensitivity: "After the maximum cooling for low-latitude eruptions the temperature relaxes back toward the initial state with an e-folding time of 29–43 months for sensitivities of 1–4°C equilibrium warming for CO2 doubling. Comparisons of observed and modeled coolings after the eruptions of Agung, El Chichón, and Pinatubo give implied climate sensitivities that are consistent with the Intergovernmental Panel on Climate Change (IPCC) range of 1.5–4.5°C. The cooling associated with Pinatubo appears to require a sensitivity above the IPCC lower bound of 1.5°C, and none of the observed eruption responses rules out a sensitivity above 4.5°C." Enough obfuscation already.
    0 0
  20. One more accusation of misrepresentation to discuss: At the end of post #10, Albatross says "The sensitivity of the GISS-E model, at least the last time I looked was +2.7 C. So you misrepresented them too." I assume that this is in response to my #9: "The GISS E model has a sensitivity of only about 1.2C/doubling in the short term (5 years, for example) and only about 1.8C over a century timeframe.", since that is the only mention of GISS E before Albatross's accusation. If we accept Albatross's characterization of GISS-E model as having 2.7C CO2 doubling sensitivity, then my statement "about 1.2C/doubling in the short term (5 years, for example) is equivalent to saying that I expect the climate response function of GISS-E to be 1.2/2.7 = 44% at 5 years and 1.8/2.7= 67% at 100 years. Looking at Hansen's graph of climate response function (copy in post #16, above)the response at 5 years is difficult to read, but it is appears to be just under 40%; and the response at 100 years is slightly less than 60%. It doesn't take any complicated math to see that my comments about 1.2C rise after 5 years and 1.8C after 100 years in response to a 100% step in CO2 corresponds to a GISS-E equilibrium sensitivity of 3.0C for a doubling. My statements about GISS-E in post #8 are further supported by Hansen himself, who in Hansen et al 2011 page 18 says "About 40 percent of the equilibrium response is obtained within five years. This quick response is due to the small effective inertia of continents, but warming over continents is limited by exchange of continental and marine air masses. Even after a century only 60 percent of the equilibrium response has been achieved. Nearly full response requires a millennium." Hmmmm. 40 percent after 5 years. 60 percent after a century. In other words, using the Albatross number of 2.7C/doubling for equilibrium sensitivity, this corresponds to 0.4x2.7=1.1C after 5 years, and 1.6C after 100 years. A bit less than my 1.2 and 1.8C description in #8. Albatross ---- is Hansen misrepresenting the model GISS-E ?? Figure 8a from Hansen 2011 is in post #16 above and shows the climate response for the 0-123 years. To further put things into perspective, here is Figure 7, which shows much more of the slow response, 0 to 2000 years. Held showed response graphs 0-20 years and 0-100 years. Caption from Hansen 2011 for the above figure: "Fig. 7. Fraction of equilibrium surface temperature response versus time in the GISS climate model-ER, based on the 2000 year control run E3 of Hansen et al. (2007a). Forcing was instant doubling of CO2, with fixed ice sheets, vegetation distribution, and other long-lived GHGs."
    0 0
  21. 20, Charlie A, You included the set up (i.e slow GISS ModelE-R response to forcing), but left out the core of Hansen's paper:
    Below we argue that the real world response function is faster than that of modelE-R. We also suggest that most global climate models are similarly too sluggish in their response to a climate forcing and that this has important implications for anticipated climate change.
    Then later:
    We believe, for several reasons, that the GISS modelE-R response function in Figs. 7 and 8a is slower than the climate response function of the real world. First, the ocean model mixes too rapidly into the deep Southern Ocean, as judged by comparison to observed transient tracers such as chlorofluorocarbons (CFCs) (Romanou and Marshall, private communication, paper in preparation). Second, the ocean thermocline at lower latitudes is driven too deep by excessive downward transport of heat, as judged by comparison with observed ocean temperature (Levitus and Boyer, 1994). Third, the model's second-order finite differencing scheme and parameterizations for turbulent mixing are excessively diffusive, as judged by comparison with relevant observations and LES (large eddy simulation) models (Canuto et al., 2010).
    At the same time, the focus of Held's paper is merely to separate and distinguish fast from slow acting responses to climate change. It assumes no predicative capacity whatsoever, and is based on a single model with known and quantifiable limitations. His main takeaway is our presumed ability to correctly estimate/measure the level of fast-acting responses in short time frames (the steep rise), un-muddled by slow-acting factors (the more shallow plateau). The ultimate fact, however, is that it is very early on in the game to be assuming that we know how fast things will happen. But if it does take as long as predicted, then that's very, very bad, because it means we might not make any effort to mitigate our CO2 levels whatsoever, and it will be many generations before the world discovers how very badly we've fouled up the climate. Imagine that climate sensitivity turns out to be 6˚C, and people 300 years from now have to live with a 3˚C increase, knowing that a catastrophic additional 3˚C is "in the pipeline." On the surface, it appears to be a good argument for business as usual, when to any moral person it is an argument for the opposite. But in the end, both papers are complex and nuanced. They're perfect papers from which to cherry pick scraps of info that can easily be misunderstood.
    0 0
  22. All, Regarding this claim made by Charlie @20, "If we accept Albatross's characterization of GISS-E model as having 2.7C CO2 doubling sensitivity" Had the contrarian bothered to follow the link that I had provided they would have seen that it was not my characterization but a link to RealClimate, which includes a comment by Dr. Gavin Schmidt (who works extensively with the model) concerning the model's climate sensitivity, it also made reference to Table 8.2 in the IPCC AR4 report. Thanks Sphaerica @21. Good points. Now moving on.
    0 0
  23. Albatross -- as shown in the table 8.2 linked in your post #22, the Transient Climate Response for the various models averages about 1.8C, and for GISS-E is listed as 1.5C. Note that the TCR is higher than the short term transient sensitivity, as the TCR is defined as the model output with a 1% increase of GHG each year, averaged over the 20 year span centered on the point where the GHG have doubled. Since doubling at 1% rate takes 70 years, the 20 year averaging period is from year 60 to year 80. Now look again at my comment #9 that seems to have caused such great angst. All I said saying is that the short (1955-2010 is ONLY 55 years) period of the OHC over which Spencer calculated sensitivity means that his calculated 1.3C for doubling sensitivity is not surprising since it consistent with the various models used in AR4, including GISS E which has short term sensitivity of 1.2C/doubling at 5 years and 1.8C/doubling at 100 years. (or perhaps 1.1C at 5 and 1.6C/doubling at 100 years if 2.7C/doubling is used as equilibrium sensitivity rather than the 3.0 that I have more recently). Somehow, my saying "Spencer's 1.3C for doubling CO2 doesn't matter because it isn't all that different than GISS E sensitivity" gets treated as a heretical statement. Strange.
    0 0
  24. Charlie, Spencer arrived at the curious number of 1.3 C for equilibrium climate sensitivity (he refers to climate sensitivity is the same context as reported in the IPCC) for doubling CO2, because he made several errors as outlined by Dr. Bickmore. Spencer has again been shown to be guilty of undertaking a seriously flawed analysis-- do you dispute Dr. Bickmore's debunking of Spencer's error riddled analysis?
    0 0
  25. Albatross, I find do not fully understand Spencer's calculations (assuming that I have found the one that Bickmore refers to ---- it is quite strange that there is no link to Spencer's blogpost). It is also clear from the article that Dr Bickmore does not understand what Spencer has posted. I have not bothered to try and resolved the differences in approaches and understanding between the two gentlemen. My main interest in the article was the graph of forcings from Hansen through 2010, along with a link for those forcings. Unfortunately, it turns out that the Dr Bickmore's statement about the provenance of the forcings is erroneous (which he corrected in comment #7, but not in the headpost), and his link only shows the 1880-2003 GISS forcings, with fixed aerosol forcings post 1990. A typical problem I have with serious discussion of this article are statements like "One of the problems I pointed out was that his model assumed a 700 m mixed layer in the ocean, when it is really something more like 100 m. In other words, his model assumed that the entire top 700 m of the ocean heats up and cools down at the same rate, which is nonsense." A simple review of Spencers calculations shows that, if one is using OHC for the upper 700 meters and the heat capacity for the upper 700 meters, then what one calculates is the average temperature for the upper 700 meters. That Spencer calculates an average temperature for the upper 700 meters is not the same as Bickmore's assertion that "his model assumed that the entire top 700 m of the ocean heats up and cools down at the same rate, which is nonsense." For the sort of analysis that Spencer attempted to make any sense, the layer used for OHC must have essentially zero heat flux crossing the lower boundary, and therefore it is a given that there will be a temperature vs depth variation. Dr. Bickmore's article is written as an attack rather than a discussion or review. And I originally noted, a finding of transient sensitivity of 1.3C is not sufficiently novel to motivate me to wade through the mess.
    0 0
  26. Hi Charlie, 1. I didn't think anything of your comment about it being unsurprising that you would get short-term sensitivity by fitting a simple climate model to 55 years of data. Sounds reasonable to me. If there are both fast and slow feedbacks in the system, a 1-box model can't capture that. 2. At one point I e-mailed Roy and asked him where to find the forcings and he pointed me to the page I linked. I also digitized his forcing curve from his graph, to make sure they were the same (through 2003, at least). Anyway, I don't see why this would merit an update in the text, since I just linked to where Roy said he got the data. Anyone who's interested in pursuing it further is more than welcome to ask me how I got the rest of it, like you did. (You're the only one, so far.) Given that I was just trying to reproduce Spencer's work, rather than produce a sensitivity estimate of my own, do you feel that I've been disingenuous about this? If so, I can't fathom why. 3. When I was talking about the depth of the mixed layer, I was talking about Roy's modeling adventures that he reported in his book. (See the links to my previous book review.) The point was that I had previously criticized him for a model in which he assumed a 700 m mixed layer (i.e., the same temperature, or at least the same temperature changes throughout.) There was no averaging--the temperature of the entire 700 m layer was assumed to be the same as the surface temperature. This is nonsense, as you seem to acknowledge. In THIS episode of Spencer's modeling adventures (i.e., the blog post I'm critiquing here) he averages the temperature of the 700 m layer, which as you point out, is perfectly fine. However, Spencer's comments about the top 700 m illustrate very nicely that I was right in my previous criticism. 4. Look at my last point, the re-read your criticisms of me in the post above. Your reading of Spencer's blog post is, well... exactly what I said. And yet, you criticize me for writing in "attack mode" and not understanding what Spencer was saying. 5. There are, in fact, at least two links to Spencer's blog post in my article above. Again, you don't seem to have looked very hard. (And for the record, I'm not one of those people who comments on someone else's post without linking to it, just to avoid boosting their google rating. I avoid that on moral grounds.) 6. I said I didn't think anything of it when you said it was unsurprising that Spencer would find a low climate sensitivity from a short data series. Why? Because to me you seemed to be acknowledging that analyzing 55 years of OHC data via a 1-box climate model probably wasn't an adequate way to estimate equilibrium climate sensitivity. Which was my point in the first place. But you seem to be saying that this is a reason NOT to criticize Spencer's modeling effort. Honestly, I'm having trouble following your logic. And to be perfectly frank, you don't seem to have read what I said very carefully before accusing me of misunderstanding Spencer and failing to link to his blog.
    0 0
  27. Charlie #25:
    "And I originally noted, a finding of transient sensitivity of 1.3C is not sufficiently novel to motivate me to wade through the mess."
    It's also worth noting that Spencer is claiming 1.3°C equilibrium sensitivity.
    0 0
  28. Dana's right, Charlie. I guess I thought you were agreeing with me at first because this point is so obvious. If Spencer's meant his 1.3 °C figure to be interpreted as transient sensitivity, then why was he comparing it to the IPCC's most probable range for equilibrium sensitivity? I just can't understand how you can think so clearly about how climate models work, and then stop short of admitting that Spencer wasn't.
    0 0
  29. bbickmore wrote : "Honestly, I'm having trouble following your logic. And to be perfectly frank, you don't seem to have read what I said very carefully before accusing me of misunderstanding Spencer and failing to link to his blog." I believe this is the same comprehension problem that used to be exhibited by a certain poster named Gilles - whom I believe is now called Charlie A.
    0 0
    Response:

    [DB] "whom I believe is now called Charlie A"

    I do not believe so.

  30. I'm also having a hard time understanding CharlieA's point. It sounds almost like he's saying there was no point in addressing Spencer's claims (and thus no point in reading Bickmore's post) because they actually agreed with mainstream climate science. That would be news to Spencer, I imagine. He also seems to lean a lot on this longterm shortterm response distinction.
    0 0
  31. #30 is the closest to understanding my. I had no interest in the main thrust of this post, but because of some other stuff I'm looking at, the plot of Hansen's forcings and link caught my attention. Look at the comment history. I inquired about the forcings, without making comment on either Spencer's or Bickmore's arguments. What I thought would be my final comment, #9, was a simple observation that I did not find Spencer's calculation of sensitivity of 1.3C/doubling unusual as it was consistent with the the short term response sensitivity of many models. As far as Bickmore being disingenuous about the source of the forcing data, I asked for the source. He answered it. He left the main article ambiguous or misleading as to the source of the forcings, but it is a minor, somewhat tangential matter. One that I have an interest in, but not relevant to his analysis. "It sounds almost like he's saying there was no point in addressing Spencer's claims (and thus no point in reading Bickmore's post) because they actually agreed with mainstream climate science." -- that's a reasonable description of my attitude. A more accurate statement is that I am not sufficiently interested by the debate to analyze it in detail. I would fully expect that there are others which have much greater interest is this particular kerfluffle. I was rather surprised that my statements in comment #9 about the short term transient response of the GISS E model would be controversial and that others would claim them to be misrepresentations. I also described in comment #9 the short term (70 year) response of GFDL. That description was also attacked as being a misrepresentation, and two other posters claimed the I either misunderstood or misrepresented Held et al 2010. Hopefully, after this rather lengthy exchange of comments, any reasonably intelligent reader can see that properly described the GISS E short term sensitivity, the short term sensitivity or transient response of GFDL CM2.1, and properly interpreted Held et al 2010.
    0 0
  32. Here is the complete text of my comment #9. ( -Snip- )
    0 0
    Response:

    [DB] A link will do.  Interested parties, if any, are more than capable of reading upthread.  Keep in mind the focus of this thread.  You would have been better served, and less misunderstood, if you had simply asked your question(s) on a more relevant thread (that Search function thingy again).

  33. Dana @27 and Barry @28, That is exactly what I was trying to communicate @24. Although I guess that I was not direct/clear enough.
    0 0
  34. That Hansen article is very interesting though - I'm glad it's been highlighted. I'm struggling with some of the terminology. But if I understand correctly, his argument is as follows:
    • The fast feedback sensitivity sff is the equilibrium sensitivity excluding some very slow terms like changes in ice sheets.
    • Hansen claims that sff is well determined by paleoclimatology. Here's a counterintuitive point. How come the ice ages tell us about the fast feedback sensitivity, rather than the slow sensitivity? I think the answer is that Hansen is feeding in the additional feedbacks (e.g. ice sheets) as forcings on the basis of known data, rather than allowing them to be included in the sensitivity.
    • The transient response is constrained by recent climate. Thus any model (e.g. GCM, two box, or Arthur's non-physical deconvolution) complex enough to represent at least 2 transient timescales will produce a similar hindcast for the last century, and as a result will also produce a similar forecast for the next century.
    • However, this doesn't nail down the fast feedback sensitivity. What is nails down is the product of sff and the response function over the first few decades. Turning this into a sensitivity does indeed involve the length of the long tail of the response function, and thus is poorly determined from the instrumental record alone.
    • Thus if we are interested in the next few decades, the sensitivity is actually irrelevant. It is the product of the sensitivity and response function which matters. The sensitivity will only come into play over much longer timescales.
    • Hansen claims that how much longer is confused by the GCM response being too slow. The main focus of the paper is to justify this claim.
    • Changes in response when varying the aerosol feedback is hard to distinguish from changes when varying ocean mixing, which causes the slowness of current models. Increasing the aerosol feedback requires faster response.
    • Hansen suggests that the planetary energy imbalance be used to resolve this ambiguity. A higher (more negative) aerosol feedback, coupled with slower ocean mixing (thus faster response), makes the apparent energy imbalance go away. In doing so, he resolves 'Trenberth's travesty'.
    • Having done so, he concludes that the human forcing is lower than previously estimated, but that the response is faster: 75% in 100 years. Thus his claim is that the current GCM response (figure 8a posted above) is actually wrong.
    • Another implication of the change is to explain why the IPCC underestimates sea level rise.
    So, in short, he's arguing for the sensitivity to be correct, the forcing to be lower, but the response to be faster. Doing so solves the energy budget problem and the underestimated sea level rise. Presumably, if this is correct, Charlie's '5 year sensitivity' metric would also increase by some amount (~25%?) to allow the reduced forcing to still produce accurate hindcasts. That's a lot of material. I presume I've got at least some of it wrong.
    0 0
  35. Or to put it more simply: Let's define a new plot, which is the step-function response curve scaled by the sensitivity. Paleoclimate gives us the height of the plateau at the end of this plot (the fast feedback sensitivity). Recent climate gives us the slope at the beginning. The curve in the middle is ambiguous. A wrong estimate of aerosol forcing means that we have the gradient at the beginning wrong, and thus the time to reach the plateau is out too.
    0 0
  36. I would have thought the important issue about Spencer's article is not whether his computer model is correct but rather his observation of the vertical temperature profile of the ocean, the negligible warming at depth of 700 metres, and its implications for locating a missing heat sink in the oceans.
    0 0
  37. Ross, this thread is about whether his model was correct. For discussion of oceans, look at Oceans are cooling, especially the recent discussion concerning Von Schuckmann & La Traon 0-2000 OHC over past 5 years, and then implications of this in Hansen 2011. Links to both on that thread.
    0 0
  38. Kevin C -- it does not appear that any of the usual posters here will discuss your questions. The ratio between short term sensitivity and the equilibrium sensitivity can be varied by changing various parameters in the model. Obviously, one extreme is the 1 box model. The graph below shows how a simple linear + 1 lag model can have the nearly identical 1880-2003 hindcast as GISS-E, but have equilibrium sensitivity be identical to transient sensitivity. An important thing to understand (and this relates back to this actual topic of this thread - going from a 55 year span of OHC to equilibrium sensitivity) is that the goodness of fit from 1800-2003 tells us very little about equilibrium sensitivity over the span of a 1000 years. Any transient sensitivity diagnosed by looking at upper ocean OHC over a period of 55 years could be consistent with almost any equilibrium sensitivity. If long term feedbacks are positive, then equilibrium sensitivity will be higher. If long term feedbacks are negative, then equilibrium sensitivity will be lower. This graph below is the response to a flattening of CO2 at current levels in a model that emulates GISS-E very closely from 1880-2003, but has no long term component. Context and info on the above graph I find Ross McKittrick's comments on Keynesian marginal propensity to consume (MPC) model and Friedman Permanent Income Hypothesis (PIH) model (the comment just above the graph) a rather interesting parallel to the current situation with GCMs.
    0 0
  39. "I find Ross McKittrick's comments on Keynesian marginal propensity to consume (MPC) model and Friedman Permanent Income Hypothesis (PIH) model (the comment just above the graph) a rather interesting parallel...." Enough said. McKitrick (an economist) and his forays in to climate science have been debunked so many times that I have lost count. Here is the most recent example. But this post is about Spencer failing again....and contrarians, 'skeptics" and those in denial have been unable to refute Dr. Bickmore's analysis. So instead resort to obfuscation and attempts to detract from Spencer's failings. What is striking is how the estimates for climate sensitivity keep converging on a number very close to +3 C for doubling CO2 (at least when the analysis is done correctly). Recently, Spencer was also trying to claim that natural variability could explain almost all of the observed warming the last century. I wish he would make up his mind instead of groping around in the dark for silver bullets. Really, at this point, one really has to wonder whether his systematic bias towards lower CS in his calculations are really attributable to ignorance or incompetence. Someone of his standing surely knows better than to systematically make such egregious errors...
    0 0
  40. @Kevin C, #34 re climate response function and Hansen 2011 et al. Hansen's sections 5,6, and 7 and figure 9 discuss only the ocean mixing in regards to the climate response function. It seems to me that, since the forcing for Figs 7, 8a and 9 is a step doubling of CO2, then there are some additional important time constants related to the decrease of CO2. Perhaps CO2 is the cause of the change in slope around 700 years on Figure 7 and around 50 years on fig 8a. For CO2, IPCC AR4 defines a response to a step in CO2 that has 4 time constants. "About 50% of a CO2 increase will be removed from the atmosphere within 30 years, and a further 30% will be removed within a few centuries. The remaining 20% may stay in the atmosphere for many thousands of years." ref: 2nd bullet under Carbon Cycle.. at AR Exec summary Chap 7, WG1 The specific time constants are given in note a of Table 2.14 in AR4 WG1 errata.. It gives 3 time constants, with the 4th time constant of infinity implied by the fixed a0 = 0.217. Note that the 50% decrease in 30 years in the exec summary descriptive text above is the combined result of A2/tau2 and A3/tau3 pairs of 19% decaying with 1 year e-folding period and 34% of the CO2 decaying with 19 year e-folding period. The 30% in a few centuries text corresponds to the A2/tau2 of 33.8%, tau2 of 172.9 years. The twenty percent remaining corresponds to the a0 of 21.7 and a tau of infinity Charlie
    0 0
    Response:

    [DB] OK, let's try to rein in the off-topic discussion here.  Plenty of threads exist to discuss specific options, like sensitivity or models.  This thread is about a repost of Professor Bickmore's piece on Spencer's latest attempt to un-physicalize the downsides of the anthropogenic GHG contributions to global warming.  IMHO, the Spencer series should be called "Spencer Straws", as the grasping going on is plainly evident.

  41. Last few days I analyzed available sources. ... and the all comment bbickmore - I can be (fully) agree with one sentence: “ Instead of trying to work on his idea until it’s in good enough shape to pass peer review, he posts it on a blog ...” That's true. Methodological errors in the analysis of Spencer seem to be obvious. But is it important? 1. At the beginning: a simple model (even simpler “than is possible”) for determining the impact of climate on the sensitivity of OHC - are often ( to investigate a specific range of data )better than complicated . Here should not be no doubt. According to the researchers in Australia:“Simple climate models can be used to estimate the global temperature response to increasing greenhouse gases. Changes in the energy balance of the global climate system are represented by equations that necessitate the use of uncertain parameters.”( Utilising temperature differences as constraints for estimating parameters in a simple climate model , Bodman, Karoly and Enting, 2011.) 2. “... and many of these methods are based on paleoclimate data, rather than model output ...” What does not change the fact that the range of this - just determined the sensitivity - it is very big. ... a 1,3 st. Spencer (even treated: not as a "transient sensitivity"- and as a "finished - all” global sensitivity to a doubling) compared to 1.5 - that is, within the error limits to the range of the IPCC. ... so that Spencer truly „... actually agreed with mainstream climate science ...”, because - as noted above - according to the IPCC: “... could be consistent within their uncertainties but might indicate a tendency of climate models to overestimate ocean heat uptake.” 3. bbickmore of criticism is here not only the model but Spencer and - in a way obvious (though not literally) - the "overarching" results (“...major problems if we continue to burn fossil fuels ...”). (Hint: I am surprised that every supporter of AGW, no matter what he writes, always has to add something “like that "...) "Major problems" that those 3 degrees K, if we use - as appropriate - no errors - Spencer simple model based on an analysis of changes in the OHC. However, we have: "... overestimate ocean heat uptake ... "- How much? For example, recently noted the "problem"with OHT and clouds in the tropics, the "problem" preventing the full potential of OHC - which diminishes the sensitivity of climate to these external factors that directly affect the accumulation of energy in the ocean ( Climate sensitivity to changes in ocean heat transport, Barreiro & Masina, 2011.: „This suggests that the present-day climate is close to a state where the OHT maximizes its warming effect on climate and pose doubts about the possibility that greater OHT in the past may have induced significantly warmer climates than that of today.”). In addition, the ocean can draw energy, not only passively but actively - bigger (or smaller) regional energy storage by the ocean can be a global positive feedback to the (even smaller - in absolute values) changes in OHT caused by the small (but in a concrete place ) changes in external forcing. “The influence of ocean circulation changes on heat uptake is explored using a simply-configured primitive equation ocean model resembling a very idealized Atlantic Ocean.” “Calculating heat uptake by neglecting the existing reservoir redistribution, which is similar to treating temperature as a passive tracer, leads to significant quantitative errors notably at high-latitudes and, secondarily, in parts of the main thermocline.” ( The passive and active nature of ocean heat uptake in idealized climate change experiments , Xie and Vallis, 2011.) How much - these new observations - the calculation - are significant to the results obtained by other „... many of these methods ...”? For example, “the skeptical analysis” of claims that only the ocean, "tells the truth", because: „... ocean heat has one main advantage: Simplicity. While work on climate sensitivity certainly needs to continue, it requires more complex observations and hypotheses making verification more difficult. Ocean heat touches on the very core of the AGW hypothesis: When all is said and done, if the climate system is not accumulating heat, the hypothesis is invalid.” Ocean - heat content - therefore has an advantage over : “... many of these methods ...”. Less problematic - uncertain - estimates. 4. I therefore consider that although Spencer methodological mistakes - they are insignificant to the correctness of his final conclusions (as noted - in the comments of this post). He is right - paying particular attention to the importance of natural variability - can not (I hope for now) just to prove it properly. I hope that in this last issue is consensus, ie, he ... “ can not ... " “Bullet” of Spencer - is just one of many "silver" shot at in the same direction ...?
    0 0
  42. Arkadiusz Semczyszak #41, I'm sorry, but I couldn't really follow what you said.
    0 0
  43. Okay. Briefly. 1. Your criticism is "too hot" - too poor in the reference - do not exhaust the subject, in one word: biased. 2. Simple models are: OHC - climate sensitivity - the better. 3. Result (final conclusion) Spencer is correct - it really: similar to Barreiro and Masina 2011. What is your opinion about this paper and Xie and Vallis 2011? 4. What would you have found errors in the analysis cited by me (conclusions regarding OHC - climate sensitivity - are similar to those of Spencer)?
    0 0
  44. Post this on (4.) the SkS is here
    0 0
  45. Arkadiusz Semczyszak maybe you didn't notice, Dr. Bickmore reproduced Spencer's work. As for your point 1, then, it's Spencer that should eventually be blamed. As for point 3, Dr. Bickmore showed that a flawed methodology produced a wrong result. Should have, by chance, produced the correct results, it is still flawed.
    0 0
  46. Arkadiusz @43, I'm not going to go hunting down papers that some random poster references inadequately. (Titles? Journal names? Volume and page numbers?) The oldest trick in the book is for some ignoramus to say, "What about these 50 papers?" as if that constituted an argument. No, you need to explain what you think is so compelling about each of those papers and give full references. Maybe I would feel motivated to go look them up, then. In any case, I still don't understand the rest of your argument. I think maybe we're hitting a language barrier here.
    0 0
  47. Dr. Spencer's model has been available since long before you wrote this article. http://www.drroyspencer.com/research-articles/ He must get a HUGE amount of email every single day. He seems to have a policy (which seems not only reasonable but also essential in managing his time ) of simply ignoring requests for things that you should be able to find yourself with a little effort. He is not a human google backup for those who can't be bothered to look. As you note, he does reply where he thinks there is a point worth a reply. I have had replies and many non replies. I would not have the arrogance to expect that he replies to every question I would like to ask him. You would do better to use his model rather than try to second guess it if you wish to criticise him. It's been on his site since December 2010. Saying "I think he has done this and *its wrong*" is pretty unfair as well as unscientific. Your arguments would carry more weight if there was less snark.
    0 0
  48. BTW Roy's model does not use 3.5 * T(700) instead of Tsurface. Wrong guess. It's difficult to see why this is an "excellent" post. It attempts to dismiss R.S model without even having it to look at. It seems excellent is just some kind of believers vs heretics cheer-leader term I'm unfamiliar with. If your bias is the same as mine: go daddy! It would be more interesting to see a post that does deal with Spencer's work. I'm sure it's not perfect and there are limitations to such trivial models. In fact it's not Spencer's model, his credits it to someone else and mainstream climate researchers use simple models like this to avoid doing full GCM runs. What worrying is that they agree with real satellite data as well as or better than super computer models do. http://www.drroyspencer.com/research-articles/satellite-and-climate-model-evidence/
    0 0
  49. skeggy whatever surface temperature he used, either 3.5*T(700) or the expermental data, there's no point in using a fatally flawed model. The so-called one box model (or one layer zero-dimensional heat balance model) means that the layer has uniform temperature at any time, it can not emit at a different rate than the one given by its temperature. If we have a different surface temperature we also have some additional heat flow. It is equivalent to adding a surface layer, ending up with a two boxes model. This is reasonable, as Dr. Bickmore says in this post. A surface mixed layer (much thinner than 700 m) and the rest of the deep ocean. But then you must take into account (at the very least) the heat flow between the two layers, which Dr. Spencer didn't. It is not that the one or two box model isn't worth using, it is that Dr. Spencer applied it incorrectly forcing the model into an unphysical situation.
    0 0
  50. Hey guys, how about a Spencer icon? Something about a satellite lost in clouds perhaps.
    0 0

1  2  Next

You need to be logged in to post a comment. Login via the left margin or if you're new, register here.


The Consensus Project Website

THE ESCALATOR

(free to republish)


© Copyright 2024 John Cook
Home | Translations | About Us | Privacy | Contact Us