Climate Science Glossary

Term Lookup

Enter a term in the search box to find its definition.

Settings

Use the controls in the far right panel to increase or decrease the number of terms automatically displayed (or to completely turn that feature off).

Term Lookup

Settings


All IPCC definitions taken from Climate Change 2007: The Physical Science Basis. Working Group I Contribution to the Fourth Assessment Report of the Intergovernmental Panel on Climate Change, Annex I, Glossary, pp. 941-954. Cambridge University Press.

Home Arguments Software Resources Comments The Consensus Project Translations About Support

Twitter Facebook YouTube Mastodon MeWe

RSS Posts RSS Comments Email Subscribe


Climate's changed before
It's the sun
It's not bad
There is no consensus
It's cooling
Models are unreliable
Temp record is unreliable
Animals and plants can adapt
It hasn't warmed since 1998
Antarctica is gaining ice
View All Arguments...


Username
Password
New? Register here
Forgot your password?

Latest Posts

Archives

A Detailed Look at Renewable Baseload Energy

Posted on 25 June 2011 by Mark Diesendorf, dana1981

The myth that renewable energy sources can't meet baseload (24-hour per day) demand has become quite widespread and widely-accepted.  After all, the wind doesn't blow all the time, and there's no sunlight at night.  However, detailed computer simulations, backed up by real-world experience with wind power, demonstrate that a transition to 100% energy production from renewable sources is possible within the next few decades.

Reducing Baseload Demand

Firstly, we currently do not use our energy very efficiently.  For example, nighttime energy demand is much lower than during the day, and yet we waste a great deal of energy from coal and nuclear power plants, which are difficult to power up quickly, and are thus left running at high capacity even when demand is low.  Baseload demand can be further reduced by increasing the energy efficiency of homes and other buildings.

Renewable Baseload Sources

Secondly, some renewable energy sources are just as reliable for baseload energy as fossil fuels.  For example, bio-electricity generated from burning the residues of crops and plantation forests, concentrated solar thermal power with low-cost thermal storage (such as in molten salt), and hot-rock geothermal power.  In fact, bio-electricity from residues already contributes to both baseload and peak-load power in parts of Europe and the USA, and is poised for rapid growth.  Concentrated solar thermal technology is advancing rapidly, and a 19.9-megawatt solar thermal plant opened in Spain in 2011 (Gemasolar), which stores energy in molten salt for up to 15 hours, and is thus able to provide energy 24 hours per day for a minimum of 270 days per year (74% of the year). 

Addressing Intermittency from Wind and Solar

Wind power is currently the cheapest source of renewable energy, but presents the challenge of dealing with the intermittency of windspeed.  Nevertheless, as of 2011, wind already supplies 24% of Denmark's electricity generation, and over 14% of Spain and Portugal's.

Although the output of a single wind farm will fluctuate greatly, the fluctuations in the total output from a number of wind farms geographically distributed in different wind regimes will be much smaller and partially predictable.  Modeling has also shown that it's relatively inexpensive to increase the reliability of the total wind output to a level equivalent to a coal-fired power station by adding a few low-cost peak-load gas turbines that are opearated infrequently, to fill in the gaps when the wind farm production is low (Diesendorf 2010).  Additionally, in many regions, peak wind (see Figure 4 below) and solar production match up well with peak electricity demand.

Current power grid systems are already built to handle fluctuations in supply and demand with peak-load plants such as hydroelectric and gas turbines which can be switched on and off quickly, and by reserve baseload plants that are kept hot.  Adding wind and solar photovoltaic capacity to the grid may require augmenting the amount of peak-load plants, which can be done relatively cheaply by adding gas turbines, which can be fueled by sustainably-produced biofuels or natural gas.  Recent studies by the US National Renewable Energy Laboratory found that wind could supply 20-30% of electricity, given improved transmission links and a little low-cost flexible back-up.

As mentioned above, there have been numerous regional and global case studies demonstrating that renewable sources can meet all energy needs within a few decades.  Some of these case studies are summarized below.

Global Case Studies

Energy consulting firm Ecofys produced a report detailing how we can meet nearly 100% of global energy needs with renewable sources by 2050.  Approximately half of the goal is met through increased energy efficiency to first reduce energy demands, and the other half is achieved by switching to renewable energy sources for electricity production (Figure 1).

ecofys fig 1

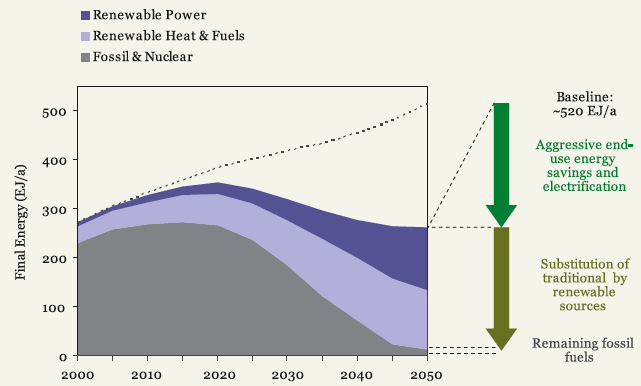
Figure 1: Ecofys projected global energy consumption between 2000 and 2050

Stanford's Mark Jacobson and UC Davis' Mark Delucchi (J&D) published a study in 2010 in the journal Energy Policy examining the possibility of meeting all global energy needs with wind, water, and solar (WWS) power.  They find that it would be plausible to produce all new energy from WWS in 2030, and replace all pre-existing energy with WWS by 2050

In Part I of their study, J&D examine the technologies, energy resources, infrastructure, and materials necessary to provide all energy from WWS sources.  In Part II of the study, J&D examine the variability of WWS energy, and the costs of their proposal.  J&D project that when accounting for the costs associated with air pollution and climate change, all the WWS technologies they consider will be cheaper than conventional energy sources (including coal) by 2020 or 2030, and in fact onshore wind is already cheaper. 

European Union Case Study

The European Renewable Energy Council (EREC) prepared a plan for the European Union (EU) to meet 100% of its energy needs with renewable sources by 2050, entitled Re-Thinking 2050.  The EREC plan begins with an average annual growth rate of renewable electricity capacity of 14% between 2007 and 2020.  Total EU renewable power production increases from 185 GW in 2007 to 521.5 GW in 2020, 965.2 GW in 2030, and finally 1,956 GW in 2050.  In 2050, the proposed EU energy production breakdown is:  31% from wind, 27% from solar PV, 12% from geothermal, 10% from biomass, 9% from hydroelectric,   8% from solar thermal, and 3% from the ocean (Figure 2).

EU Renewables

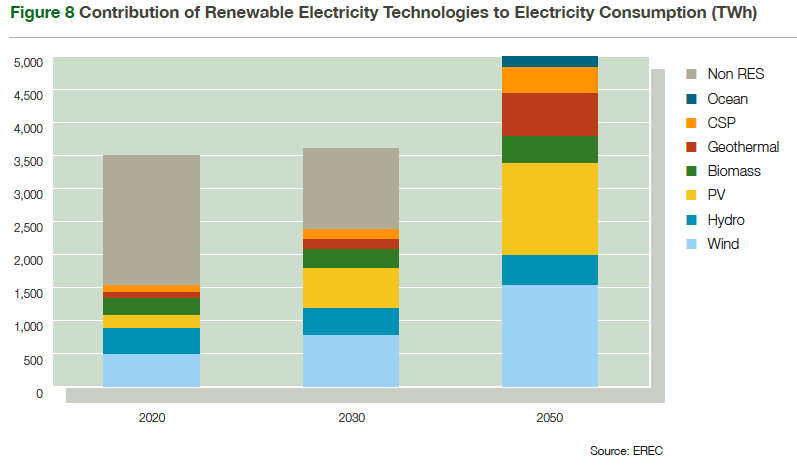
Figure 2: EREC report breakdown of EU energy production in 2020, 2030, and 2050

Northern Europe Case Study

Sørensen (2008) developed a plan through which a group of northern European countries (Denmark, Norway, Sweden, Finland, and Germany) could meet its energy needs using primarily wind, hydropower, and biofuels.  Due to the high latitudes of these countries, solar is only a significant contributor to electricity and heat production in Germany.  In order to address the intermittency of wind power, Sørensen proposes either utilizing hydro reservoir or hydrogen for energy storage, or importing and exporting energy between the northern European nations to meet the varying demand.  However, Sørensen finds:

"The intermittency of wind energy turns out not to be so large, that any substantial trade of electric power between the Nordic countries is called for.  The reasons are first the difference in wind regimes...and second the establishment of a level of wind exploitation considerably greater that that required by dedicated electricity demands.  The latter choice implies that a part of the wind power generated does not have time-urgent uses but may be converted (e.g. to hydrogen) at variable rates, leaving a base-production of wind power sufficient to cover the time-urgent demands."

Britain Case Study

The Centre for Alternative Technology prepared a plan entitled Zero Carbon Britain 2030.  The report details a comprehensive plan through which Britain  could reduce its CO2-equivalent emissions 90% by the year 2030 (in comparison to 2007 levels).  The report proposes to achieve the final 10% emissions reduction through carbon sequestration.

In terms of energy production, the report proposes to provide nearly 100% of UK energy demands by 2030 from renewable sources.  In their plan, 82% of the British electricity demand is supplied through wind (73% from offshore turbines, 9% from onshore), 5% from wave and tidal stream, 4.5% from fixed tidal, 4% from biomass, 3% from biogas, 0.9% each from nuclear and hydroelectric, and 0.5% from solar photovoltaic (PV) (Figure 3).  In this plan, the UK also generates enough electricity to become a significant energy exporter (174 GW and 150 terawatt-hours exported, for approximately £6.37 billion income per year).

UK Renewables

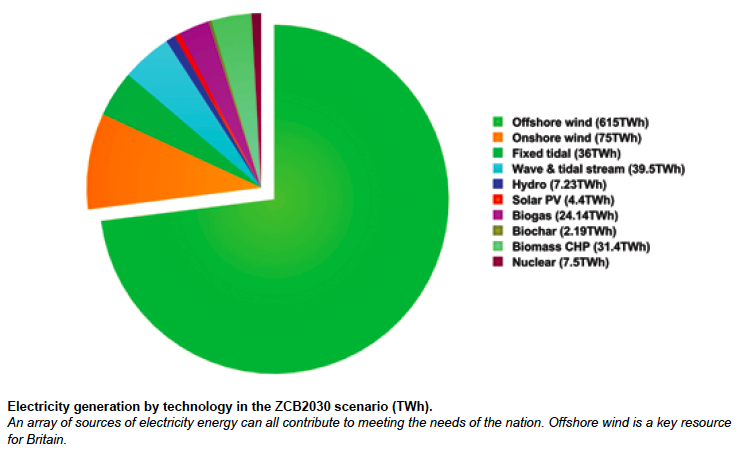
Figure 3: British electricity generation breakdown in 2030

In order to address the intermittency associated with the heavy proposed use of wind power, the report proposes to deploy offshore turbines dispersed in locations all around the country (when there is little windspeed in one location, there is likely to be high windspeed in other locations), and implement backup generation consisting of biogas, biomass, hydro, and imports to manage the remaining variability.  Management of electricity demand must also become more efficient, for example through the implementation of smart grids

The heavy reliance on wind is also plausible because peak electricity demand matches up well with peak wind availability in the UK (Figure 4, UK Committee on Climate Change 2011).

UK wind seasonality

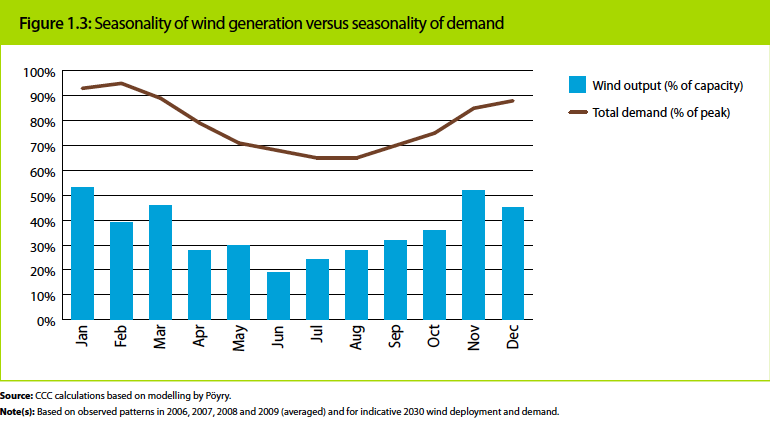
Figure 4: Monthly wind output vs. electricity demand in the UK

The plan was tested by the “Future Energy Scenario Assessment” (FESA) software. This combines weather and demand data, and tests whether there is enough dispatchable generation to manage the variable base supply of renewable electricity with the variable demand.  The Zero Carbon Britain proposal passed this test.

Other Individual Nation Case Studies

Plans to meet 100% of energy needs from renewable sources have also been proposed for various other individual countries such as Denmark (Lund and Mathiessen 2009), Germany (Klaus 2010), Portugal (Kraja?i? et al 2010), Ireland (Connolly et al 2010), Australia (Zero Carbon Australia 2020), and New Zealand (Mason et al. 2010).  In another study focusing on Denmark, Mathiesen et al 2010 found that not only could the country meet 85% of its electricity demands with renewable sources by 2030 and 100% by 2050 (63% from wind, 22% from biomass, 9% from solar PV), but the authors also concluded doing so may be economically beneficial:

"implementing energy savings, renewable energy and more efficient conversion technologies can have positive socio-economic effects, create employment and potentially lead to large earnings on exports. If externalities such as health effects are included, even more benefits can be expected. 100% Renewable energy systems will be technically possible in the future, and may even be economically beneficial compared to the business-as-usual energy system."

?

Summary

Arguments that renewable energy isn't up to the task because "the Sun doesn't shine at night and the wind doesn't blow all the time" are overly simplistic.

There are a number of renewable energy technologies which can supply baseload power.   The intermittency of other sources such as wind and solar photovoltaic can be addressed by interconnecting power plants which are widely geographically distributed, and by coupling them with peak-load plants such as gas turbines fueled by biofuels or natural gas which can quickly be switched on to fill in gaps of low wind or solar production.  Numerous regional and global case studies – some incorporating modeling to demonstrate their feasibility – have provided plausible plans to meet 100% of energy demand with renewable sources.

NOTE: This post is also the Advanced rebuttal to "Renewables can't provide baseload power".

0 0

Printable Version  |  Link to this page

Comments

Prev  1  2  3  4  5  6  7  8  9  Next

Comments 251 to 300 out of 440:

  1. More good grief:
    3) LAGI quotes a 20% efficiency of collection. For comparison , the Andasol 1, 2 and 3 plants have a 28% peak efficiency and an annual average of 15%, so 20% is reasonable.
    The words 'annual average' mean 'annual average'. So an 'annual average' of 15% is and annual average of 15%. Not 20% or half a green cheese. This is not the stuff of rational debate.
    0 0
  2. BBD @244 (again): 1) The efficiency is unitless. It is kW/m^2 of electricity produced divided by kW/m^2 of insolation. 2) LAGI write:
    We can figure a capacity of .2KW per SM of land (an efficiency of 20% of the 1000 watts that strikes the surface in each SM of land). So now we know the capacity of each square meter and what our goal is. We have our capacity in KW so in order to figure out how much area we’ll need, we have to multiply it by the number of hours that we can expect each of those square meters of photovoltaic panel to be outputting the .2KW capacity (kilowatts x hours = kW•h)."
    (my emphasis. Bolded section is the context BBD elided in his quotation.) So, and most emphatically, the 0.2 KW was not simply drawn from nowhere. It was calculated by multiplying the expected insolation by an efficiency factor. You may want to argue that 20% efficiency is to high, but it is not 100% efficiency. LAGI do not use a 200 Watt insolation value (which they give as 1000 W/m^2), and they do not omitting the panel conversion efficiency (which they give as 20%). What is more, LAGI explicitly stated this. Indeed, they did so in the sentence immediately before the paragraph you chose to quote. To quote, in fact, in order to prove that they used an insolation value one fifth of that which they had just stated they had used, and that they did not use the efficiency factor they explicitly stated they used. In my world, what you have done is called "quotation out of context" and your example ranks well up their with some of the more egregious examples I have seen from creationists. Now I will once give you the benefit of the doubt and simply assume that you are not practised in reading for comprehension. But you had better come down of your high horse and pretence that we are not reading your words of wisdom when you are plainly not reading our simple statements of fact.
    0 0
  3. Tom, why you bother? It looks to me like just some game of power is played here, with (non)-renewable energies as the party theme. Be sure of not being driven where you don't want to be. You can't address the arguments of an innumerate using his own 10, 15, 20, 30, 50 and 70s and multiplying or dividing by 2 like they do. Get your figures reusable. Never do them just for these creatures: they don't want them, they don't allow them, and most importantly, they can't understand them as independent of wishing conclusions generated in advance. Also, let them to abuse of adjectives and other 'rhetoricalities'. Moderators: Please, consider if it is not time of flushing a lot of comments that are just spam.
    0 0
  4. BBD - "MacKay uses 15W/m2 energy density for desert sited CSP" That's low even by CSP standards - the Spanish AndaSol facility will have (due to only a small percentage of fill area) a gross efficiency of 2.6%, or >20 W/m^2. CSP has a conversion efficiency of 18-30% of collection area, depending on design, with some of the linear trough and Fresnel layouts having considerably higher fill factors than basic tower geometries. Fully filled a CSP would have a 200 W/m^2 output, although I don't expect that to get over ~100 given current designs. They do seem to be less expensive to build than PV systems on a per/Watt basis, though, and thermal storage is very attractive. Now - taking a look at PV power plants, which can attain fill factors approaching 100%, we're looking at 150 W/m^2 for a 15% efficient PV system. So - your 15 W/m^2 is low to start with, by almost an order of magnitude.
    0 0
  5. Tom You are going to have to stop doing this sort of thing and re-engage, with a clear head:
    Ignoring the irrelevance given that LAGI calculate an area of approx 500,000 km^2, not 10,000 km^2 (100*100), we now know that when Mackay writes "allowing no space for anything else" he actually means "using just one quarter of that space for the solar field". We also know that he arbitrarily and with no justification given excludes any possibility of dual land use, at least in that calculation. (At another point in the book he points out that wind and solar power can occupy the same land footprint with very little loss of efficiency for either, then brushes it of. Clearly offshore wind and wave power can also take advantage of shared location with no efficiency loss in generation, and efficiency gains for transmission.)
    - What 'irrelevance'? It's an argument about scale and capacity. You are trying to delegitimise MacKay - When MacKay writes 'allowing no space for anything else' that's exactly what he means. Go back, and read it again. Where on earth do you get 'using just one quarter of that space for the solar field'? Seriously? Where? (See below before replying) - We are discussing the incorrect LAGI claim that 500,000 km2 of solar plant (with no spacing; 100% packing factor is assumed) can generate 23TW - But anyway, hot deserts are not windy enough for efficient wind generation The rest is a descent into further irrelevance. Until we get to this:
    However, I do admit that my 232 was in error, partly because I did not note Mackay's mistaken figure of 1/3rd land used when he meant 1/2, but mostly because I made an error due to tiredness (at 3:41 am).
    Your 232 is wrong because using MacKay's numbers you need ca 1,500,000 km2 to generate 23TW. That's because his calculation includes a conversion efficiency step and works from 15W/m2. Unlike LAGI, which mistakenly omits this step and runs on 200W/m2. Which is how it gets a seriously wrong result. MacKay is working with 100% coverage - the irrelevance of the erratum on p181 is irrelevant. You misunderstand this because you haven't read the caption. Do so now. See the numbers: 65 x 1500 km2 areas of 50% plant footprint, 10GW generation per area. Which yield just 16kWh/d/p for 1bn people. As compared to the 125kWh/d/p average European usage. Not only is this result consistent with MacKay's 100% coverage estimate, it is further confirmation of the scale of the error in LAGI. Errors happen. Nobody minds. It is willful refusal to acknowledge the exact nature of an error that is a problem.
    0 0
  6. Tom You just do not see it yet. Look at the average sunshine in W/m2. 200W/m2 is a fair estimate for average ground level insolation in a low latitude arid/semi-arid location. Let's say we apply a 20% technology conversion efficiency to this. We get 20W/m2. This is obvious and elementary reasoning. But LAGI uses the whole 200W/m2. There is no conversion efficiency step. I literally cannot understand why you don't see this. It's trivial. This is why LAGI comes up with a nonsense result of 500,000 km2 = 23TW and MacKay (and other numerates) come up with 1,500,000 km2 = 23TW. When are you going to concede that you've got this wrong? LAGI is missing a vital step and I have shown you exactly where it happens.
    0 0
  7. KR ( -Snip-):
    Now - taking a look at PV power plants, which can attain fill factors approaching 100%, we're looking at 150 W/m^2 for a 15% efficient PV system. So - your 15 W/m^2 is low to start with, by almost an order of magnitude.
    If surface insolation at the site is 200W/m2, and we use the 20% efficiency you claim for Andasol (which I do not necessarily accept btw), we get 20W/m2 Please explain here, with your workings shown, how you get from a 200W/m2 insolation (or 150W/m2 if you prefer) to an efficiency of '150W/m2' applying a 15% conversion efficiency. I'm struggling to remain polite now. I will say this: you appear to have become confused between packing factor and conversion efficiency. It sounds to me as if you don't really understand what is being discussed here.
    0 0
    Response:

    [DB] As CBD has pointed out, 200W/m2*(0.20)=40W/m2.

    Before complaining about the splinters in other's maths, one would do well to first remove the planks in one's own.  In maths and rhetoric.

    Everyone, please focus on keeping civility in this discussion.  The moderation level has just been toggled up a notch.

  8. BBD @257: From LAGI:
    "Using 70% as the average sunshine days per year (large parts of the world like upper Africa and the Arabian peninsula see 90-95% – so this number is more than fair), we can say that there will be 250 sun days per year at 8 hours of daylight on average. That’s 2,000 hours per year of direct sunlight."
    2000 hours times 1000 Watts/m^2 equals 2,000,000 * 60 * 60 = 7.2 billion Joules/m^2 per annum of insolation. 7.2 billion Joules over one year = 7,200,000,000 / (365.25 * 24 * 60 * 60) = 228 W/m^2 averaged over the year. So LAGI plainly take into account the average rate of insolation, but they do so by direct calculation rather than taking an initially averaged value for insolation. Of course, we already knew this because we had a direct comparison between the LAGI figures for insolation and those for Andasol from 247 above:
    "4) LAGI quote a thousand Watts of direct sunlight for 2,000 hours (23%) of the year for a total of 2,000 kWh/m^2 of direct sunlight per annum. For comparison, the Andersol plants experience per annum from 2,136 kWh/m^2 per annum in the south of Spain, so again the LAGI figures are conservative with areas in North Africa likely to experience much more both because of higher solar intensity and fewer cloud days."
    That's right, LAGI's figures for direct insolation are 6% less than those achieved at Andasol in the South of Spain, even though many of the LAGI sites are located in regions achieving 16% or more greater annual insolation than the south of Spain. Of course, when I say "we knew this" I am excluding those who are unable to comprehend more than one paragraph at a time of a viewpoint they disagree with, and who continuously quote out of context to try and give substance to arguments that are, in the end nothing but dogmatism. ( -Snip- )
    0 0
    Response:

    [DB] Everyone, please take a deep breath and try to keep the emotions out of the discussion.  I know that's hard, as that's why I moderate instead of engaging as participant (I often end up deleting my own comments on those occasions I get caught into a discussion). 

    Letting others knock us off our "A" game only detracts from the quality of the dialogue.

  9. Tom I appeal for clarity and reason:
    So, and most emphatically, the 0.2 KW was not simply drawn from nowhere. It was calculated by multiplying the expected insolation by an efficiency factor. You may want to argue that 20% efficiency is to high, but it is not 100% efficiency. LAGI do not use a 200 Watt insolation value (which they give as 1000 W/m^2), and they do not omitting the panel conversion efficiency (which they give as 20%).
    - Of course the 200W/m2 (0.2kW/m2) was not 'drawn from nowhere'. I have repeatedly said that it is a fair estimate for average surface insolation for low latitude desert locations. - Here (again) is a table which shows why I would say this. Look at the values for average sunshine in W/m2. - Now, please show me where LAGI uses the necessary additional technology conversion factor - At the same time it will be trivial to show me that LAGI did not use 200W/m2 as the basis for the rest of its calculation, which would of course invalidate its estimate No more insulting language, no more straying away to other matters. I want your point-for-point response to this with full workings for any additional calculations you use.
    0 0
  10. Two different surface insolation values are being cited in the 'discussion' above. The 'correct' values are: 1000 W/m^2 is the global average insolation under full sunlight 250 W/m^2 is the global average 24 hour insolation... including morning, afternoon, night, cloud cover, et cetera. Thus, a 20% efficient panel would indeed generate an average of about 200 W/m^2 (more nearer the equator / less nearer the poles)... when the Sun was shining. The lower values (50 W/m^2 in this case) come from averaging that power generation over a 24 hour day... even night, when the generation is obviously near 0%. PS: 200 * 20% = 40. Not 20.
    0 0
  11. CBDunkerson "PS: 200 * 20% = 40. Not 20. " Whoops. Thank you.
    0 0
  12. CBDunkerson #264
    Thus, a 20% efficient panel would indeed generate an average of about 200 W/m^2 (more nearer the equator / less nearer the poles)... when the Sun was shining.
    Well, it's average performance that counts. So what concerns us is this: 20% x 250 = 50W/m2 Slighly less idealised: 15% x 200 = 30W/m2 MacKay gives a real-world estimate for CSP of 15W/m2. I think he's right, as efficiency will no doubt rise over time. However, current real-world plant power density is even lower than assumed above. There are a number of reasons for this. Here are some real-world numbers:
    Europe’s first commercial solar tower, PS (Planta Solar) 10, completed by Abengoa Solar in Sanlúcar la Mayor in 2007, is rated at 11 MWp. With annual generation of 24.3 GWh (87.5 TJ, 2.77 MW), its capacity factor is 25%. Its heliostats occupy 74,880 m2 (624 x 120 m2), and the entire site claims about 65ha; the facility’s power density is thus about 37 W/m2 factoring in the area taken up by the heliostats alone, and a bit more than 4 W/m2 if the entire area is considered. PS20 (completed in 2009) is nearly twice the size (20 MWp; 48.6 GWh or 175 TJ/year at average power of 5.55 MW and capacity factor of nearly 28%). Its mirrors occupy 150,600 m2 and hence the project’s heliostat power density is, at 36.85 W/m2, identical to that of PS10 but, with its entire site covering about 90 ha, its overall power density is higher at about 6 W/m2. Bright Source Energy’s proposed Ivanpah CSP in San Bernardino, CA should have an eventual rating of 1.3 GWp and it is expected to generate 1.08 TWh (3.88 PJ) a year and deliver on the average 123.3 MW with a capacity factor of just 9.5%. Heliostat area should be 229.6 ha and the entire site claim is 1645 ha. This implies power densities of 53.75 W/m2 for the heliostats and 7.5 W/m2 for the entire site. Again, no stunning improvements of these rates are expected any time soon and hence it is safe to conclude that optimally located CSP plants will operate with power densities of 35-55 W/m2 of their large heliostat fields and with rates no higher than 10 W/m2 of their entire site area.
    So, again but with 10W/m*2: 10,000km2 = 100GW 100,000km2 = 1TW 2,300,000km2 = 23TW Smil's examination of the impact of packing factor on installation footprint finds the following energy densities for SPV plant: Olmedilla 85 GWh/year = 9.7 MW 9.7 MW/108 ha = 9 W/m2 Moura 88 GWh/year = 10 MW 10 MW/130 ha = 7.7 W/m2 Waldpolenz 40 GWh/year = 4.56 MW 4.56 MW/110 ha = 4.1 W/m2
    0 0
  13. To add to the dance of figures loosely related with the post: 9? 7.7? 4.1 W/m2? Wow! Brazil get some 0.8W/m2 in bio-ethanol in their best model crops. USA gets some 0.3W/m2 in bio-ethanol from corn. And land is no cheap because ... it produces a lot of sugar cane or corn! That land is better used for sun harvesting! On the other hand, USA managed to got many hundreds of TW during Hiroshima's blast, and using less than a cubic metre. And those 23TW so discussed and compromising the area of whole countries can easily be got from burning 40 milliard tons of coal per year, if you only want heat, an amount of heat that could melt 2,200 km3 of ice itself if you ignore the effect of more than 140 GTons of CO2 added to the atmosphere by burning it, which stands for that greenhouse gas rising some 17 ppm by year. But don't get dismayed by this as you can cut emission to a half or less by using petroleum and natural gas, all provided you only needed heat and you needed it in the same place the fuel is. But, obviously, bio-fuel and nuclear are very expensive while sun, wind, petroleum, natural gas and coal are 100% free -nothing sarcastic there, not at all-. And that may have been the problem from the very beginning. Well, we may or may not need in a period of thirty years some hundreds of thousands of square kilometers to harvest sun or at least 800 km3 of coal or oil, or 650,000 km3 of natural gas (more than half the volume of all oceans together), what I'm sure is here and there, and a 100% free too, as said, not in a sarcastic fashion but because it's true. Well, number crunching is over. It was very entertaining. What on Earth are you talking here about? and, how does that relate to the topic in the post? [Few adjectives were used in this, and none of them was harmed while making this comment]
    0 0
  14. All This is what we are discussing:
    average raw energy density x plant conversion efficiency = average output
    Here's what LAGI does: - reasonably assumes 200W/m2 raw energy density - multiplies 200W/m2 by the estimate of 2000 hours p/a of direct sunlight: 200W/m2 x 2000 = 400kWh per m2 - and on this assumption estimates: - 500,000 km2 = 23TW Plant conversion efficiency is not calculated. Much of the ambiguity arises from LAGI's use of 'capacity' (emphasis added):
    We can figure a capacity of .2KW per SM of land (an efficiency of 20% of the 1000 watts that strikes the surface in each SM of land). So now we know the capacity of each square meter and what our goal is. We have our capacity in KW so in order to figure out how much area we’ll need, we have to multiply it by the number of hours that we can expect each of those square meters of photovoltaic panel to be outputting the .2KW capacity (kilowatts x hours = kW•h).
    What capacity? What are we talking about here? MacKay includes a value for conversion efficiency. Say it's 15% (it doesn't matter; this is an example only). Remember:
    average raw energy density x plant conversion efficiency = average output
    200 x .15 = 30W/m2 So: 30W/m2 x 2000 = 60kWh per m2 vs LAGI:
    average raw energy density = average output
    200W/m2 x 2000 = 400kWh per m2 This is not esoteric. Can someone please come to the rescue. I'm tired.
    0 0
  15. Well, based on the evidence shown, I don't know who is more deadly wrong, they who assume that sun radiation direction is determined by gravity so every square metre of the planet gets plenty of it -they must live inside some sort of Dyson sphere- or they who assume that the year has 2000 hours. Efficiency of 10, 15 or 20%, who cares? One has a wrong assumption in one term, the other one has two inconsistent values in a product. In my neck of the woods, with an overall efficiency of 15%, and taking into account local heliophany, I'd have 0.36 KW-h per day and horizontal square metre in June and 1.01 in December, that is 270 Kw-h a year. With a square metre of solar panels placed at an angle of 45° and the same efficiency of 15% I would get 380 Kw-h a year with peaks in the last days of Winter (heliophany is not constant through the year). And I'm at a 35.5° latitude what qualifies as mid-latitude, and I get 1,150mm of rain a year, with an heliophany of 71%, so this is no dessert at all but one of the most fertile plains in the world. I'd got 270 Kw-h from an horizontal square meter and 380 from a well oriented one with an efficiency of 15%. So, anyone can see which one was wronger: 400 KW-h with 20% efficiency or 60 KW-h with 15%. I don't have an efficiency of 15%. I hope I'll do in the future. The rest of it is out of discussion: I know what I'm talking about and I'm not interested in other opinions about what happens in the roof of my home. If someone disagrees, consider it a private matter.
    0 0
  16. #263 erratum Dang! Volume of all oceans are three orders of magnitude higher. That volume of natural gas matches just the volume of the Caspian Sea and Black Sea together, or just more than a sixth of the Mediterranean's.
    0 0
  17. Alec Cowan @265, nobody in this "discussion" or being discussed (ie, LAGI) assumes that "sun radiation direction is determined by gravity so every square metre of the planet gets plenty of it". LAGI discuss the potential of solar generation for sites located in southern Spain, North Africa, South West United States and Central Australia. These are all areas with high insolation and low cloud cover and, as shown by a comparison of Andasol data with their estimate, the estimate is reasonable, indeed conservative for most areas discussed. They do include a very few and small locations for which your criticism may be valid - South Africa, New Zealand, Seattle (what where they thinking), and Armenia. However, some of these can be fixed by simple relocation (South Africa to Namibia for example) and in others (New Zealand, Seattle) there are ample alternative sources of renewable energy (geothermal). That, however, does not detract from their point, which is not a proposal, but a demonstration of the capability of solar power.
    0 0
  18. @267 Tom, I only have read what I supposed a faithful quotation in #264. In the sentence "We can figure a capacity of .2KW per SM of land (an efficiency of 20% of the 1000 watts that strikes the surface in each SM of land)." the phrase between parenthesis is factually wrong unless that land is a small spot that changes location by the minute -though I don't understand why third person singular if 20% and 80% are striking the same SM so 20% is not the subject- In the best case, it is a sloppy way to say it. I have at least the excuse of hardly speaking English -in spite of me using my real name here what seems to suppose some kind of linguistic obligation-. The term capacity is not really a problem, though it suggest a technological limit. I don't need to be "sold" solar energy. But I wasn't born yesterday. Free energy like solar or petroleum has the cost of knowing where to find it -solar is easy about that- and later the cost of making it available where and when you need it. I think that many people is needing lessons of economy, not ecology or physics, so they can land safely at last. If the topic was feasibility of solar energy, of course it is. What surface is needed? Just within the same order of magnitude of paved roads and urban sprawl in the United States.
    0 0
  19. Alec Cowan @268, there is a difference between being abbreviated (or simplified) and being wrong. In the former case there are relevant qualifications or conditions which are omitted for simplicity or brevity of exposition, but which are reasonably evident from context, or explained in more detailed work elsewhere (which is preferably cited or linked, but often not). In the latter case, the statement is simply false or misleading in the context regardless of any unmentioned qualifications. The unstated qualifications in this case are that the irradiance figure is the clear sky, daylight direct normal irradiance. Here are clear sky irradiance figures for Albaquerque, New Mexico (35.11 degrees North) for June 22: Note that with 2-axis tracking, solar irradiance of 1000 W/m^is achieved for 8 hours of the day, with the sun having an altitude of approximately 78 degrees at noon. Between the tropics this would be a reasonable annual average. On December 22, with a solar altitude of 32 degrees at noon, the 2-axis tracking clear sky, daylight direct normal irradiance still averages 800 W/m^2 for eight hours of the day: As it happens, LAGI do link to a source for their 1000 W/m^2 figure, but google docs won't open it for me so I cannot comment on it.
    0 0
  20. Tom You are not addressing #264. At #252, you said (and not for the first time - it is your entire argument):
    LAGI do not use a 200 Watt insolation value (which they give as 1000 W/m^2), and they do not omitting the panel conversion efficiency (which they give as 20%).
    But that is exactly what LAGI does. It multiplies 200W/m2 by the estimate of 2000 hours p/a of direct sunlight: 200W/m2 x 2000 = 400kWh per m2 And on this assumption estimates: 500,000 km2 = 23TW Plant conversion efficiency is not calculated Instead of this:
    average raw energy density x plant conversion efficiency = average output
    LAGI does this:
    average raw energy density = average output
    200W/m2 x 2000 = 400kWh per m2 I show this, again, at #264. Please respond to this. Do not introduce any extraneous argument. Respond to this alone. Politely. You must: - show that it is incorrect or - admit that LAGI is in error # 264.
    0 0
  21. Since there seems to be something of a mental log-jam going on here, how about a different framing of the problem with LAGI: LAGI calculates: 200W/m2 x 2000 = 400kWh per m2 Average output capacity per square metre is given as: 200W/m2 What kind of solar plant delivers an average output capacity of 200W/m2? See it now?
    0 0
  22. BBD - Aha, a light dawns (so to speak). "Here's what LAGI does: - reasonably assumes 200W/m2 raw energy density - multiplies 200W/m2 by the estimate of 2000 hours p/a of direct sunlight: 200W/m2 x 2000 = 400kWh per m2 - and on this assumption estimates: - 500,000 km2 = 23TW Plant conversion efficiency is not calculated." (emphasis added) No. LAGI, Tom, and myself have assumed 1 KW/m^2 raw energy intensity for a near equatorial site, which is then scaled by conversion efficiency and (quite importantly, and not done by LAGI) plant fill factor. 1KW * 0.2 efficiency * 2000 p/a = 400kWh/m^2 including plant efficiency. You appear to have applied the LAGI 20% efficiency twice, BBD, and are starting from a raw power a factor of five too low. Did you read Tom's post here? Showing insolation for New Mexico, with irradiance of ~1 KW/m^2? Where are you getting 200 W/m^2 for tropic raw power? You are incorrect. [Waldpolenz Solar Park in Germany, incidentally, has a fill factor (collection to plant areas) of ~30%, a conversion efficiency of ~12%, so 30% is quite achievable with current tech for PV - scaling up LAGI's land estimates by 3.3 at most for PV. Most current CSP plants have lower fill factors, ~15%, although some have hit 30% (Solar Millennium, Ridgecrest CA, parabolic trough, appears to be at 30%). So scaling up LAGI's estimates by 3.3 is reasonable for a physically achievable power station. Downscaling raw power by 5, on the other hand, is not.]
    0 0
  23. In my previous comment I may have underestimated the fill factor at Waldpolenz Solar Park and the CSP plants; to the extent that I have done so more energy per land area is available. I've found it rather difficult to get the numbers for these. Conversion efficiency of 15 to perhaps 20% of collected raw energy is possible with current technology photovoltaics, while CSP is rated at 30%+ for high temperature arrangements. But it's easier to densely fill the land with collectors for PV, so this CSP advantage may cancel out.
    0 0
  24. It looks for me now that all three of you are here because you enjoy the swamp. Tom, you chose to voluntarily ignore BBD in a recently deleted comment. Don't use me to continue your feud with that person. I told you that I don't need to be sold "solar". I'm telling you I don't need to be lectured about solar either. The notion of 1000 Watts striking every square meter of land on a regular basis is dead wrong. Don't build up a list of "buts" to excuse the author. That he or she may have been carried away by legitimate enthusiasm and a sales pitch mood, I agree, but that doesn't change how the world works. BBD, now part of your mind has realized your gruesome arithmetical mistakes after a spree of sterile debate caused by that mistake. The chosen strategy is asking others a written admission of the straw in their eyes. You are moving now to efficiency in a effort to keep your preformatted conclusions and simultaneously avoid the apologies about the rafter that any level-headed grown-up would give. I'm telling you: Tell yourself whatever you want, but it shows! It shows, and it's written!
    0 0
  25. KR
    No. LAGI, Tom, and myself have assumed 1 KW/m^2 raw energy intensity for a near equatorial site, which is then scaled by conversion efficiency and (quite importantly, and not done by LAGI) plant fill factor.
    If you look at this set of values for average raw energy density at the surface range from 87W/m2 to 273W/m2. This is where I get my 200W/m2 raw energy average. I've been saying this over and over here. Perhaps now the penny will drop. Once more, for the record: 200W/m2 is a good estimate for average raw energy density at the surface for low latitude desert. So far, so good. But then LAGI causes much confusion by its use of the term 'capacity' (emphasis added):
    We can figure a capacity of .2KW per SM of land (an efficiency of 20% of the 1000 watts that strikes the surface in each SM of land). So now we know the capacity of each square meter and what our goal is. We have our capacity in KW so in order to figure out how much area we’ll need, we have to multiply it by the number of hours that we can expect each of those square meters of photovoltaic panel to be outputting the .2KW capacity (kilowatts x hours = kW•h).
    LAGI does this:
    average raw energy density = average output
    200W/m2 x 2000 = 400kWh per m2 Instead of this:
    average raw energy density x plant conversion efficiency = average output
    200 x 15% = 30W/m2 30W/m2 x 2000 = 60kWh per m2 What I suggested at 271 is that you can see that LAGI is nonsense because it's entire calculation is based on solar plant with an average output of 200W/m2. It doesn't exist. Can you please, finally, just take a few minutes to think about this (eg #270 and #271). It beggars belief that something so obvious can be misunderstood for so long.
    0 0
  26. Alec Cowan @274, LAGI do not assert that 1000 Watts strikes every square meter of land. You put that claim into their mouths. In other words, you verbaled them. Until you go to their site, and follow up the link in which they justify their claim, and show that they are claiming something ridiculous, you are accusing them of asserting falsehoods solely on the basis of your lazy interpretation. And I don't give a hoot what your views are on global warming or solar power, or anything, that is a nasty habit. My criticism of you has nothing to do with any disagreement I have with BBD. As is quite evident from his posts, he has not yet even caught on that LAGI make the claim that you are mistakenly rejecting. It does have everything to do with rejecting a style of criticism that insists on interpreting the views being discussed, not as they are understood by the author of that view, but by dressing that view up in a straight jacket of the critiques own devising, thus interpreting sensible claims as ridiculous. It is an argument style I strenuously dislike, because it is lazy, because it is dishonest, and because it makes actual debate impossible.
    0 0
  27. BBD @276, do you think it just might be possible that it sounds like they are trying to say something different from how you interpret it because they are trying to say something different from how you interpret it? Or do you hold it as a axiom that you cannot misinterpret what somebody else says?
    0 0
  28. Oh, don't mind me. Here's what the Energy Department of the Republic of South Africa says about average raw energy density at the surface:
    Most areas in South Africa average more than 2 500 hours of sunshine per year, and average solar-radiation levels range between 4.5 and 6.5kWh/m2 in one day. The southern African region, and in fact the whole of Africa, has sunshine all year round. The annual 24-hour global solar radiation average is about 220 W/m2 for South Africa, compared with about 150 W/m2 for parts of the USA, and about 100 W/m2 for Europe and the United Kingdom. This makes South Africa's local resource one of the highest in the world.
    Any pennies dropped yet?
    0 0
  29. Tom [posturing deleted]
    0 0
    Moderator Response: [Dikran Marsupial] Skeptical science is for calm rational discussion of scientific issues relating to climate change. Rhetoric is not appropriate; please everybody let's get back to a more moderate, impersonal tone.
  30. BBD - MacKay does not indicate in that chart whether that is raw power or power over the course of the day. Looking at raw insolation for Africa, for example, extracting 400 kWh/m^2 over the course of the year represents about 20% of available power. MacKay's chart looks like daily average insolation (including night), whereas the LAGI figures are raw insolation times hours that is available - Apples and oranges, BBD. You state: "LAGI says: We can figure a capacity of .2KW per SM of land (an efficiency of 20% of the 1000 watts that strikes the surface in each SM of land). What it means is that average raw energy density at the surface is 200W/m2. The choice of words is fabulously confusing. One might even suspect deliberately so." What LAGI actually states in that figure is: "Areas are calculated based on an assumption of 20% operating efficiency of collection devices and a 2000 hour per year natural solar input of 1000 watts per square meter striking the surface." I found that quite clear - you have (mis)stated the figure, which shows your confusion on the LAGI statement. Raw insolation is on the order of 1000 W/m^2, not 200 W/m^2, and taking (as you have repeatedly) an output value of 200 W/m^2 and then applying conversion efficiency again is an error. --- And now for some math from your South Africa example: 5.25 kWh/m^2 per day * 365 days is 1916 kWh/year available; extracting 20% of that would be 383 kWh/m^2 - both numbers right about what LAGI estimates. An average of 220 W/m^2 over the course of the day looks about right for an insolation peak of 1000 W/m^2. You keep confusing averages over the course of the day with peak insolation * hours available, BBD, and then claiming calculations based on the latter are incorrect. I don't believe it's worth discussing this matter further with you until we can agree on a common vocabulary.
    0 0
  31. Moderator Dikram Marsupial I do not understand why the deleted comment has re-appeared. If I have somehow re-sent it I did so in error
    0 0
    Moderator Response: [Dikran Marsupial] No problem, I have deleted it. I suspect KR is right, I've done the same thing myself more than once!
  32. BBD - Reposting sometimes occurs when a page is refreshed; that's happened to me a number of times.
    0 0
  33. BBD - Comparisons, converting both 'apples' and 'oranges' into juice: LAGI figures of 1 KW/m^2 * 2000 hours = 2000 kWh/m^2/year before conversion efficiency applied. MacKay figures of Honolulu, HI, 248 W/h/m^2 daily average * 24 hours * 365 = 2172 kWh/m^2/year before conversion efficiency applied. No disagreement once scaling factors are accounted for.
    0 0
  34. KR Yes! You've got it:
    LAGI figures of 1 KW/m^2 * 2000 hours = 2000 kWh/m^2/year before conversion efficiency applied. MacKay figures of Honolulu, HI, 248 W/h/m^2 daily average * 24 hours * 365 = 2172 kWh/m^2/year before conversion efficiency applied. No disagreement once scaling factors are accounted for.
    LAGI has used a reasonable estimate for average raw energy density of 200W/m2. It's properly conservative compared to those we have for SA (220W/m2) and Honolulu (248W/m2). It then takes this estimate, and treats it as 'capacity' - without a plant conversion efficiency factor - and uses it to get its footprint estimate. In LAGI:
    average raw energy density = plant output
    LAGI does this:
    average raw energy density = average output
    200W/m2 x 2000 = 400kWh per m2 Instead of this:
    average raw energy density x plant conversion efficiency = average output
    200 x 15%* = 30W/m2 30W/m2 x 2000 = 60kWh per m2 That's why it is wrong. *This is an example only. Put in your preferred CEF, but remember, anything above 20% is getting fanciful.
    0 0
  35. BBD - And... you repeat the error, by stating "200W/m2 x 2000 = 400kWh per m2" It's not 200W * 2000 hours, but 200W * 24 hours * 365 days. Or, 1000W * 2000 hours/year of available time for collection. 200W is daily per/hour average, while 1000W on the other hand is peak power that is then scaled by the hours that power is available (2000/year, or 5.5 hours a day, more, actually, tapered for morning/evening). Apples and oranges, BBD - you are taking a 24 hour daily average and then scaling again by a fraction of a day. This is an error. I simply don't know how to put that any more clearly, BBD. 200W daily average is already scaled by hourly availability - yet you scale it again! LAGI then (properly) applies a 20% conversion efficiency. 30% is possible for CSP, minus additional plant footprint - not unreasonable.
    0 0
  36. BBD - To be as clear as possible: Power over the course of the year can be calculated in two different ways. (1) Daily average power/m^2 * number of hours per year, or 200 * 24 * 365. (2) Peak power/m^2 * effective number of hours peak power is available, or 1000 * 2000. You keep calculating it as: Daily average power/m^2 * effective number of hours peak power is available This is a fundamental math flaw, mixing the two equations.
    0 0
  37. In my previous comment I am referring to pre-conversion energy available at tropical sites. Equations 1 and 2 yield the same numbers (with LAGI's figures being rather conservative), and hence LAGI is properly doing their math.
    0 0
  38. KR Okay. LAGI has tied us all in knots. Let's try again. Here's my take for dissection: LAGI is based on an unrealistic estimate of output from solar plant. It generates an exaggerated value for this as follows: It takes the peaking mid-day figure of 1000W/m2 and applies a 20% efficiency: 1000 x 20% = 200W/m2 This figure will be correct for the middle of the day. It is the highest possible output the plant can achieve. Peak. LAGI then uses this peak value for every sunshine hour in its caclulation. It assumes 8 hours per day and 250 sunshine days a year. Perfectly reasonable. 8 x 250 = 2000 hours BUT - 2000 hours of 200W/m2 output: 2000 x 200 = 400,000 or 400kWh Which is a substantial exaggeration based on: - the incorrect assumption of constant 200W/m2 plant output - non-standard method This then forms the basis of its estimate of 500,000 km2 = 23W. The correct method is:
    average raw energy density x plant conversion efficiency = average output
    200W/m2 x 20% = 40W/m2 It looks like I am applying a 20% conversion efficiency on top of LAGI's 20% conversion efficiency. But I am not. I'm using the standard method. This is why we are all confused. I am more convinced than ever that LAGI is a deliberate attempt to mislead.
    0 0
  39. #276 Tom, I understand that when someone is saying "I'm gonna kill you", he or she probably doesn't mean it the literal way. But I wasn't going to read LAGI or whatever. BBD simply quoted them and nobody has said that BBD misquoted them. "...1000 watts that strikes the surface in each SM of land" is factually and utterly false; I'm tempted to add shamefully. That doesn't make the conclusions in LAGI wrong -in fact what everybody have quoted here looks 'rightish' at a conclussion level-. Also, that doesn't make BBD arithmetic a sound one either. The fact here is we are not talking of Aristotle. LAGI is not a dead scholar from times gone and the text is not written in a parchment so it's easy to use a text editor and change the content of the site. There's no excuse. In fact those verbal blunders allow the BBDs in the world to continue their harangues. That should concern you, not showing instead how deeply wrong is BBD's, or making of me a substitute target. Making infantile math like 20% of 1000 during 2000 only attracts the infants and allows the mathematically infantile to flit about.
    0 0
  40. BBD: This is really quite simple. Either of the approaches below would be reasonable; 1000 W/m^2 peak insolation * 20% efficient panels * 8 peak hours per day * 250 peak days per year = 400 kWh OR 250 W/m^2 average insolation * 20% efficient panels * 24 hours per day * 365 days per year = 438 kWh However, what you are doing is applying AVERAGE insolation for only the time per day and days per year when PEAK insolation is available. That is obviously incorrect.
    0 0
  41. BBD - OK, I'll try this one last time. Yearly power incident on a tropical site: Either ~225 W/m^2 daily hour average * 24 * 365, or 1000 W/m^2 peak * 2000 hours effective time at that peak = ~2000 kWh/year/m^2. Don't mix the equations, BBD, don't cross the streams. The same amount of energy can be computed either way. 2000 kWh/year/m^2, collected with 20% efficiency, is 400 kWh/year/m^2 power output. --- Now, using your method correctly, given 228 W/m^2 as a 24 hours a day average, 365 days a year (MacKay figures), * 20% efficiency = 45.6 W/m^2 average power year round. 45.6 * 1,000,000 m^2/k^2 * 500,000 km^2 = 2.28*10^13 = 22.8 TW. --- Please, BBD, correct your math - use one equation or the other, but stop mixing the two. Your math is wrong, your conclusions are therefore wrong; you're scaling 24 hour daily averages with the time that peak power is available.
    0 0
  42. CBDunkerspn
    However, what you are doing is applying AVERAGE insolation for only the time per day and days per year when PEAK insolation is available. That is obviously incorrect.
    The average includes the peak. What I am doing avoids the trickery by LAGI, which uses peak for every single sunlight hour in its calculation. That is obviously incorrect.
    0 0
    Response:

    [DB] If you persist in casting aspersions of "trickery" to methodologies which give answers different to those methodologies which you employ, you will find it even more difficult to participate in this discussion...

  43. BBD @288, there is not a "correct method". There are just different methods. In what you call the correct method, an implicit assumption is that all solar collectors are laid horizontal to the ground, and are never tilted to track the sun. That is, of course, a false assumption. In contrast, the LAGI method assumes that the projected power plants will use collectors which track the sun both for season and for time of day (ie, on two axis). That is also a false assumption, but closer to the truth. Further, as the are calculating the minimum area required to provide the worlds power, it is the correct approach. In calculating the minimum, they do not assume that if all the worlds power was generated by solar (which they recommend against), that the minimum area will be in fact achieved. If we look again at the summer solstice clear sky data for Albaguerque, New Mexico (below), you will see that both two axis tracking collectors, and single axis tracking collectors orientated on the North-South axis both collect nearly the same energy throughout day light hours. Significantly, they collect nearly the same value as at noon for the four hours on either side of noon, ie, for eight hours a day. That fact justifies LAGI's method. It is only if you assume the collectors will not track the sun during the day that LAGI's assumption is false. Indeed, during the winter solstice, a one axis tracking, N_S axis collector actually performs better during mid morning and mid afternoon than it does at noon (see chart @269 above). It should also be noted that the 2 axis tracking collectors do not perform as well in mid morning and afternoon as at noon (though much better than the N-S single axis tracking). That is because of the very low angle of the sun. Therefore LAGI's assumption only holds when the angle of the sun is not very low, ie, for sites in the tropics.
    0 0
  44. Various readers - Given that solar power levels are presented in various formats, it's easy to miscalculate available energy due to a mis-conversion (as seen in this thread). The Wiki Insolation page, in the "Applications" section, has a conversion table that might be helpful in this regard. Given tropical insolation, and solar collection efficiencies of ~20%, roughly 500,000 km^2 of solar panels or CSP collection mirrors would supply an average of 23 TW to the world - sufficient for mid-century power supply including transportation. Note that there will be infrastructure (towers, supports, panel spacings, energy storage facilities, etc.) that enlarge this by some factor, but it's a reasonable estimate of what would be needed as collection area. Wind power follows similar calculations for area, and the Surface Area Required to Power the Whole World With Solar and Wind Power shows those at scale. Note that just solar or just wind isn't on anyone's horizon - nuclear, wave, geothermal, and biomass cann all make contributions as replacements for fossil fuels. But it at least gives some perspective.
    0 0
  45. BBD @292:
    "What I am doing avoids the trickery by LAGI, which uses peak for every single sunlight hour in its calculation."
    Is that that same "trickery" that assumes there are only eight hours of daylight in any day? Or the same "trickery" that assumes that only 250 days of a year have clear skies in the Sahara? I don't see any complaints from you about LAGI's trickery that reduces the expected power generated. Regardless, as I have shown with the Albaquerque data, with 2-axis tracking, close to the equator you gain approximately the same energy for four hours on either side of noon. Hence there was no trickery from LAGI at all.
    0 0
  46. KR
    Either ~225 W/m^2 daily hour average * 24 * 365, or 1000 W/m^2 peak * 2000 hours effective time at that peak = ~2000 kWh/year/m^2. Please clarify for me why LAGI's use of peak 1000W/m2 x 20% for every single sunlight hour in its calculation is not incorrect? LAGI assumes 8 hours per day and 250 sunshine days a year and cacluates: 8 x 250 = 2000 hours BUT it uses 2000 hours of 200W/m2 (eg peak mid-day) output: 2000 x 200 = 400,000 or 400kWh Which is wrong. I do not understand you point about mixing equations in #288. I used the standard method instead of LAGI's because the annual average energy density is a much better indicator of annual average plant performance (assuming a conversion efficiency is included). The average raw energy density x plant conversion efficiency will give the most accurate estimate of average plant output. That's why it's the standard method (eg MacKay) for obtaining them.
    0 0
  47. KR @294, your points are correct except for one. It is perfectly possible to design collectors with 2 axis tracking and zero waste space. There will be a loss of efficiency, but that will be inversely proportional to the size of the field and can be reduced to less than 5%. It is not economically worthwhile doing this because in most areas the land is so cheap relative to the cost of the collectors. Actually, LAGI's calculation of the minimum area needed is quite correct. ON the other hand, an estimate of three times LAGI's figures as the practical requirement is also valid, but only because economically, the land area is inconsequential as a cost (except in Singapore and other similarly crowded states).
    0 0
  48. BBD wrote: "Please clarify for me why LAGI's use of peak 1000W/m2 x 20% for every single sunlight hour in its calculation is not incorrect? LAGI assumes 8 hours per day and 250 sunshine days a year" The Sun only shines 8 hours a day and 250 days a year on your planet? You should move. It is much sunnier here on planet Earth.
    0 0
  49. BBD @296, MacKay's method (not the standard method) only provides an accurate estimate of plant output for fixed horizontal collectors. For other types of collectors, different methods should be used, as detailed here. As can be seen below, different collection methods behave quite differently in terms of seasonal performance, and in terms of total power collected trhough the year:
    0 0
  50. BBD - How about you answer a question? ~225 W/m^2 daily hour average * 24 * 365 = ~2000 kWh/year/m^2. 1000 W/m^2 peak * 2000 hours effective peak available = ~2000 kWh/year/m^2 2000 kWh collected at 20% efficiency is 400 kWh/year. For both computations, when done right, as 2000 = 2000. You (repeatedly) claim the peak * peak available is incorrect - if so, why isn't the average hourly rate times the number of hours? Either both are right, or both are wrong. And, as the moderator stated, 'trickery' is not an appropriate term. If you cannot accept that you made an error here, BBD, I cannot expect that you will be an effective contributor to the various discussions. --- Tom - Thanks for pointing that out, I was not aware of field designs with zero waste space, although I knew parabolic trough designs get close to that. Any links you can point me to?
    0 0

Prev  1  2  3  4  5  6  7  8  9  Next

You need to be logged in to post a comment. Login via the left margin or if you're new, register here.


The Consensus Project Website

THE ESCALATOR

(free to republish)


© Copyright 2024 John Cook
Home | Translations | About Us | Privacy | Contact Us